Houses for sale & to rent in Foulridge, Colne
House Prices in Foulridge
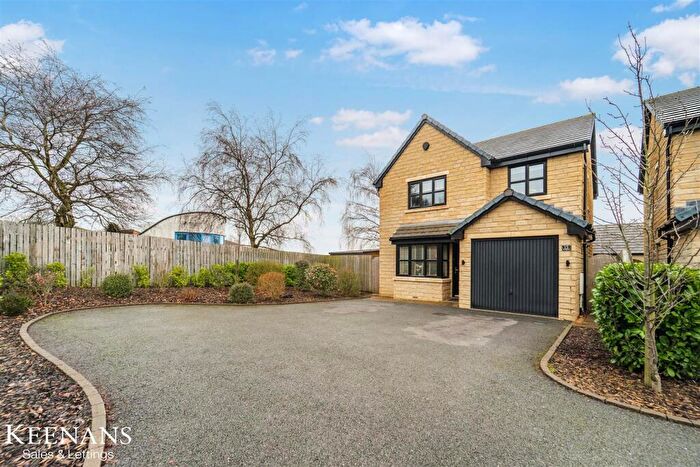
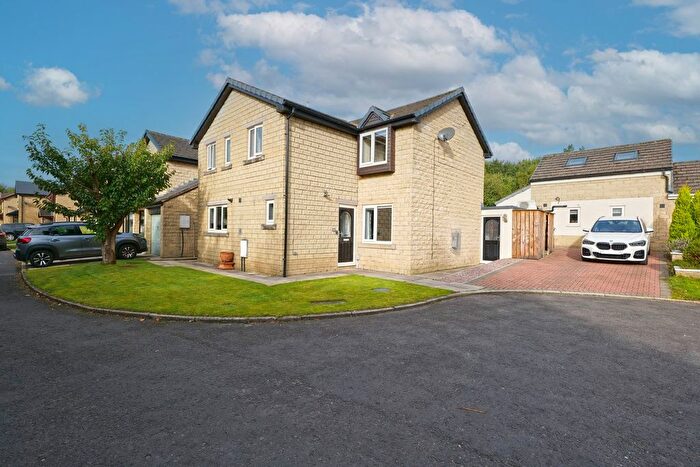
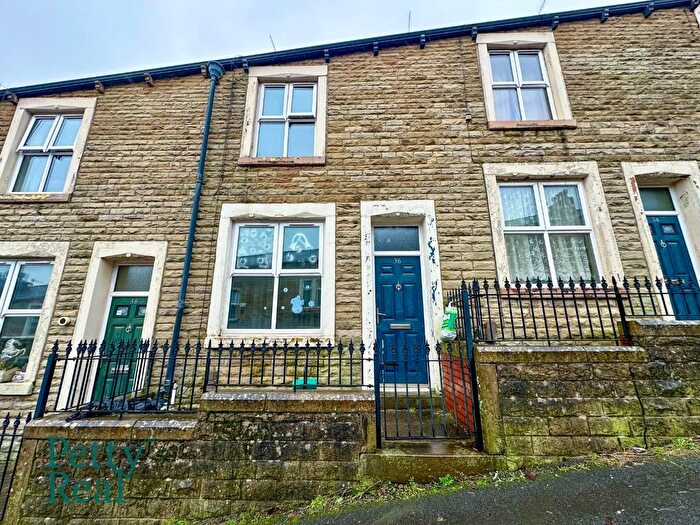
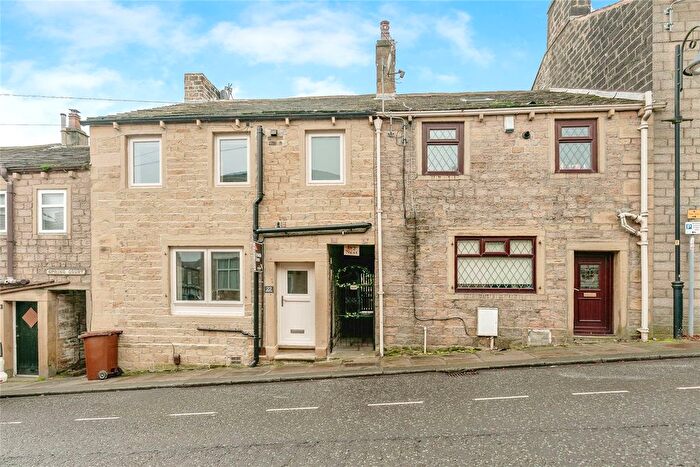
Properties in Foulridge have an average house price of £234,918.00 and had 74 Property Transactions within the last 3 years¹.
Foulridge is an area in Colne, Lancashire with 732 households², where the most expensive property was sold for £1,100,000.00.
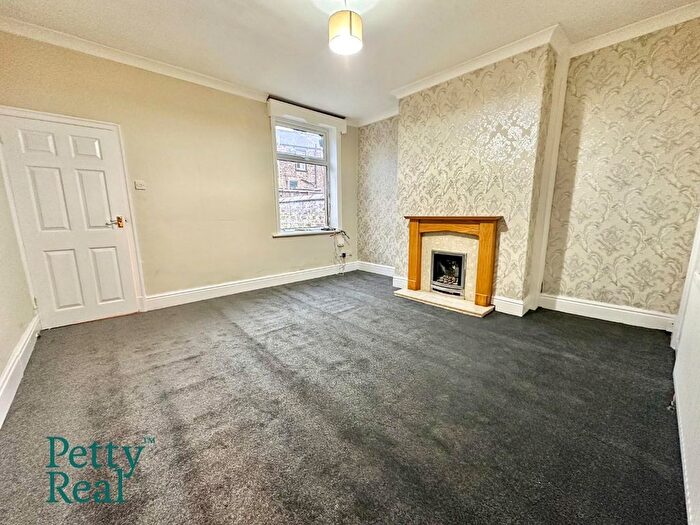
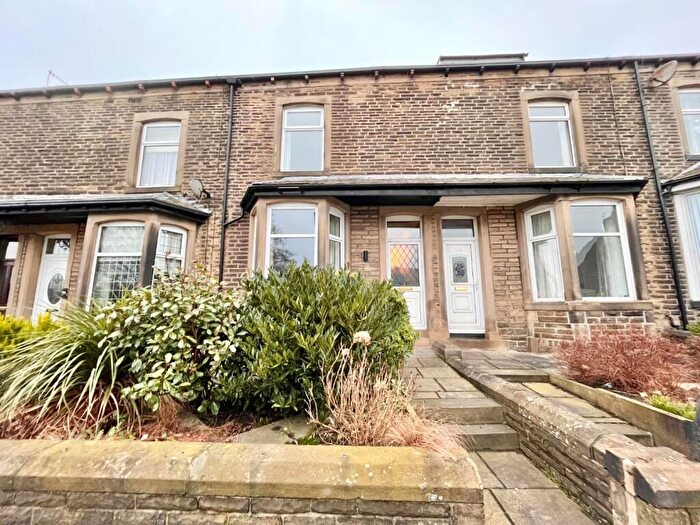
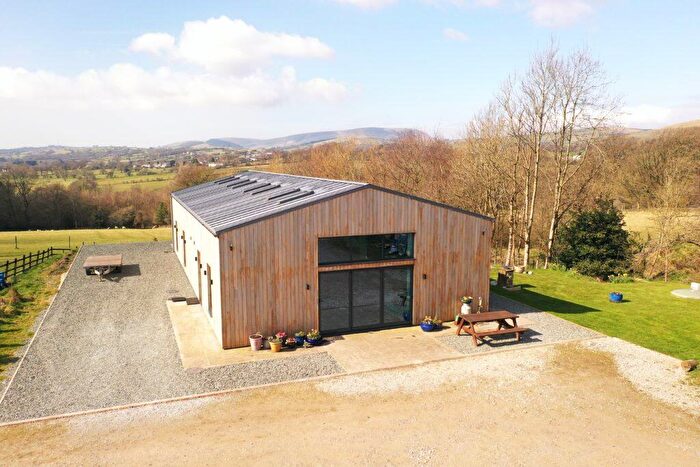
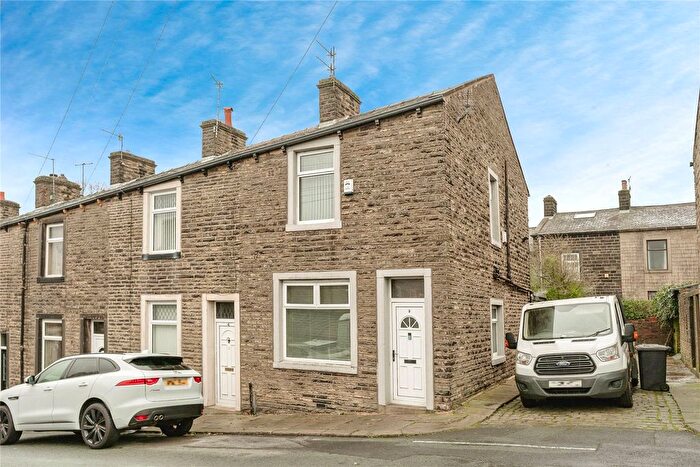
Properties for sale in Foulridge
Roads and Postcodes in Foulridge
Navigate through our locations to find the location of your next house in Foulridge, Colne for sale or to rent.
| Streets | Postcodes |
|---|---|
| Abner Row | BB8 7PN |
| Alma Avenue | BB8 7NS |
| Archery Avenue | BB8 7NH |
| Belmont Terrace | BB8 7PF |
| Blenheim Terrace | BB8 7PG |
| Burwains Avenue | BB8 7NT |
| Castle Road | BB8 7AR |
| Cat Fold | BB8 7PJ |
| Causeway | BB8 7PH |
| Chapel Street | BB8 7PU |
| Cocker Hill | BB8 7LW |
| County Brook Lane | BB8 7LS |
| Cromwell Street | BB8 7PW |
| Hawthorne Terrace | BB8 7PE |
| High Lane | BB8 7AJ |
| Highfield Avenue | BB8 7PB |
| Hill Top | BB8 7LR |
| Kirkdene Avenue | BB8 7NU |
| Kirkdene Mews | BB8 7NQ |
| Lowther Lane | BB8 7JY |
| Manor Road | BB8 7AS |
| Meadow Close | BB8 7NY |
| Mile End Close | BB8 7LD |
| Moss House Road | BB8 7QL |
| Mount View | BB8 7LP |
| Noyna Avenue | BB8 7PA |
| Noyna Road | BB8 7QN BB8 7QW BB8 7QY |
| Noyna View | BB8 7AU |
| Ormerod Terrace | BB8 7PT |
| Parkinson Street | BB8 7PS |
| Pasture Drive | BB8 7NX |
| Pendle View | BB8 7NR |
| Pleasant View | BB8 7PZ |
| Railway Street | BB8 7LF |
| Reedymoor Cottages | BB8 7LH |
| Reedymoor Lane | BB8 7LJ BB8 7LL |
| Reedymoor Terrace | BB8 7LQ |
| Robinson Street | BB8 7LG |
| Skipton Old Road | BB8 7PD BB8 7QA BB8 7QE BB8 7QG |
| Skipton Road | BB8 7AT BB8 7NN BB8 7NP BB8 7NW BB8 7PQ BB8 7PX BB8 7PY |
| Slipper Hill | BB8 7LY |
| Station Road | BB8 7LB BB8 7NB |
| Stoney Court | BB8 7QD |
| Stoney Lane | BB8 7QB |
| Sycamore Gardens | BB8 7NF |
| Sycamore Rise | BB8 7NZ |
| The Old Sidings | BB8 7GQ |
| Towngate | BB8 7PL |
| Towngate Mews | BB8 7QT |
| Trent Row | BB8 7QF |
| Waller Hill | BB8 7JZ |
| Warehouse Lane | BB8 7PP |
| Wilson Street | BB8 7LA |
Transport near Foulridge
- FAQ
- Price Paid By Year
- Property Type Price
Frequently asked questions about Foulridge
What is the average price for a property for sale in Foulridge?
The average price for a property for sale in Foulridge is £234,918. This amount is 45% higher than the average price in Colne. There are 1,623 property listings for sale in Foulridge.
What streets have the most expensive properties for sale in Foulridge?
The streets with the most expensive properties for sale in Foulridge are Hill Top at an average of £481,250, Archery Avenue at an average of £430,000 and Noyna View at an average of £420,000.
What streets have the most affordable properties for sale in Foulridge?
The streets with the most affordable properties for sale in Foulridge are Chapel Street at an average of £92,500, Robinson Street at an average of £106,833 and Belmont Terrace at an average of £117,500.
Which train stations are available in or near Foulridge?
Some of the train stations available in or near Foulridge are Colne, Nelson and Brierfield.
Property Price Paid in Foulridge by Year
The average sold property price by year was:
| Year | Average Sold Price | Price Change |
Sold Properties
|
|---|---|---|---|
| 2025 | £203,714 | -8% |
27 Properties |
| 2024 | £220,957 | -34% |
27 Properties |
| 2023 | £295,892 | 1% |
20 Properties |
| 2022 | £291,995 | 21% |
23 Properties |
| 2021 | £231,488 | 11% |
34 Properties |
| 2020 | £204,998 | 22% |
29 Properties |
| 2019 | £160,865 | -30% |
40 Properties |
| 2018 | £209,446 | 15% |
38 Properties |
| 2017 | £177,794 | -21% |
27 Properties |
| 2016 | £215,582 | 28% |
32 Properties |
| 2015 | £156,159 | -5% |
31 Properties |
| 2014 | £164,363 | -8% |
26 Properties |
| 2013 | £177,016 | 25% |
31 Properties |
| 2012 | £133,250 | -21% |
29 Properties |
| 2011 | £161,499 | -15% |
18 Properties |
| 2010 | £186,500 | 9% |
25 Properties |
| 2009 | £170,240 | -4% |
27 Properties |
| 2008 | £176,666 | -15% |
25 Properties |
| 2007 | £203,832 | 0,2% |
31 Properties |
| 2006 | £203,476 | 34% |
40 Properties |
| 2005 | £133,430 | -13% |
23 Properties |
| 2004 | £150,599 | 19% |
43 Properties |
| 2003 | £122,021 | -2% |
35 Properties |
| 2002 | £124,594 | 39% |
44 Properties |
| 2001 | £75,895 | -7% |
43 Properties |
| 2000 | £81,398 | 10% |
37 Properties |
| 1999 | £72,858 | 6% |
37 Properties |
| 1998 | £68,442 | -6% |
37 Properties |
| 1997 | £72,386 | -13% |
29 Properties |
| 1996 | £81,688 | 24% |
18 Properties |
| 1995 | £62,441 | - |
29 Properties |
Property Price per Property Type in Foulridge
Here you can find historic sold price data in order to help with your property search.
The average Property Paid Price for specific property types in the last three years are:
| Property Type | Average Sold Price | Sold Properties |
|---|---|---|
| Semi Detached House | £242,069.00 | 18 Semi Detached Houses |
| Detached House | £406,736.00 | 19 Detached Houses |
| Terraced House | £142,965.00 | 36 Terraced Houses |
| Flat | £152,000.00 | 1 Flat |

