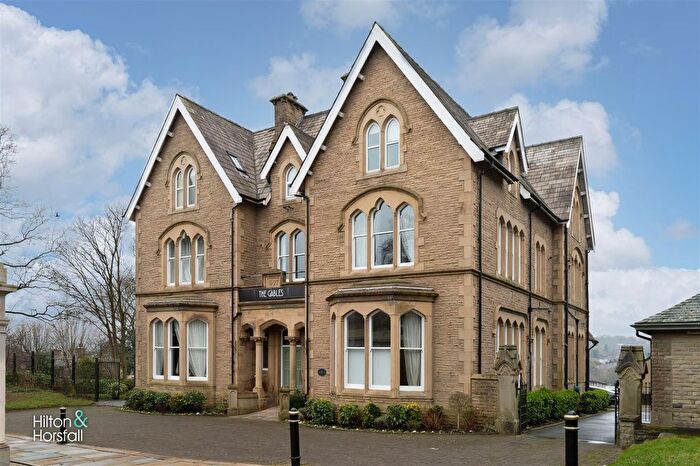
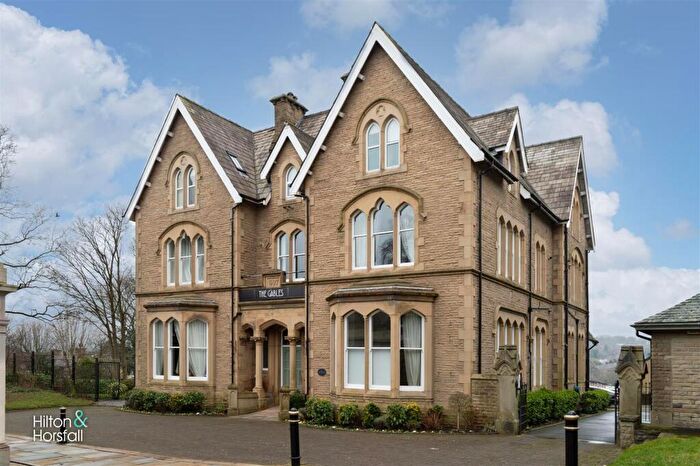
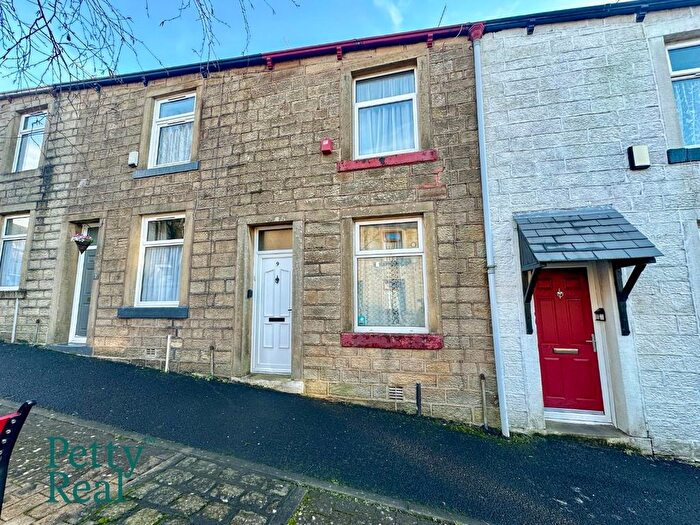
Houses for sale & to rent in Horsfield, Colne
House Prices in Horsfield
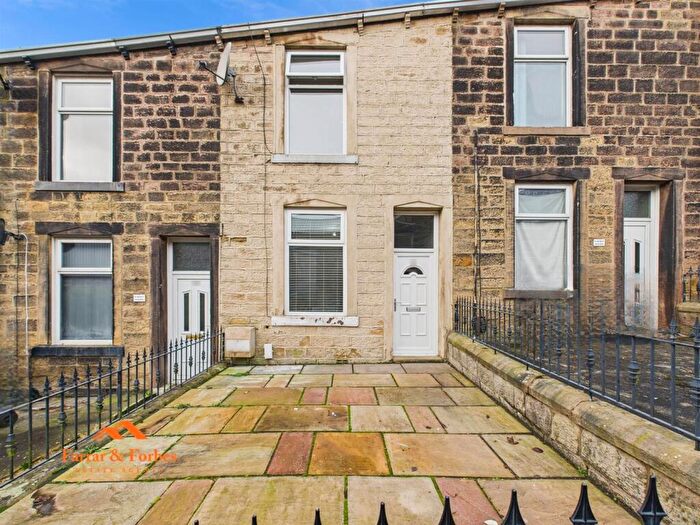
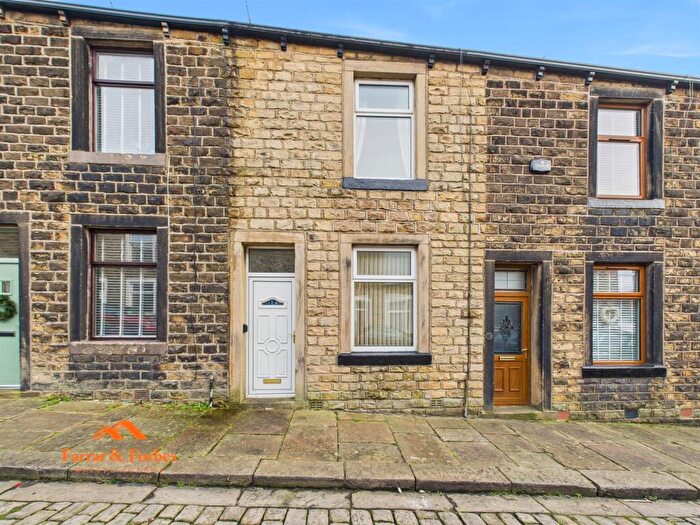
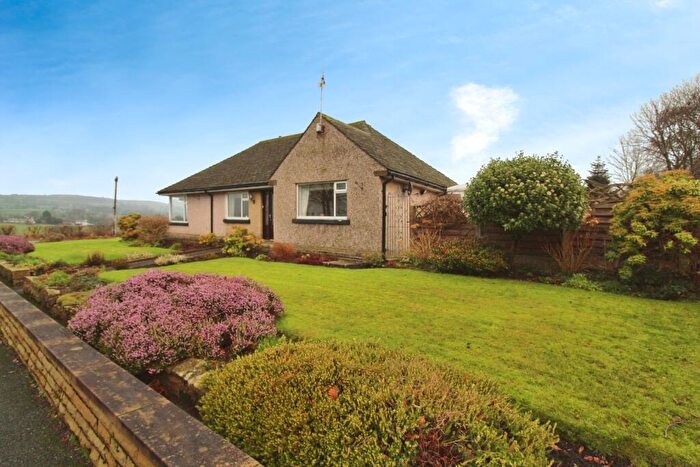
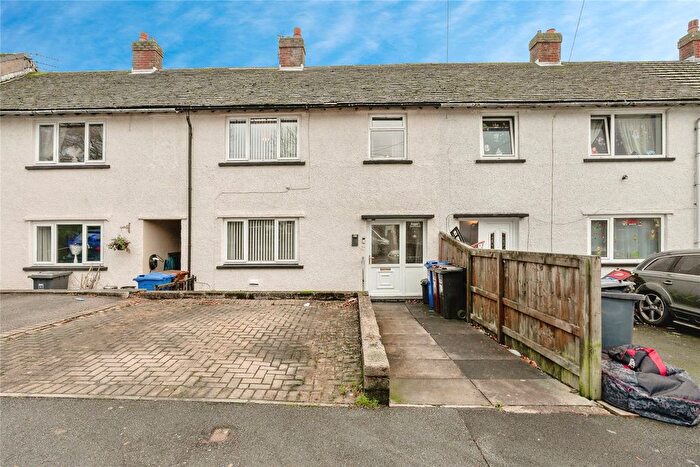
Properties in Horsfield have an average house price of £122,710.00 and had 226 Property Transactions within the last 3 years¹.
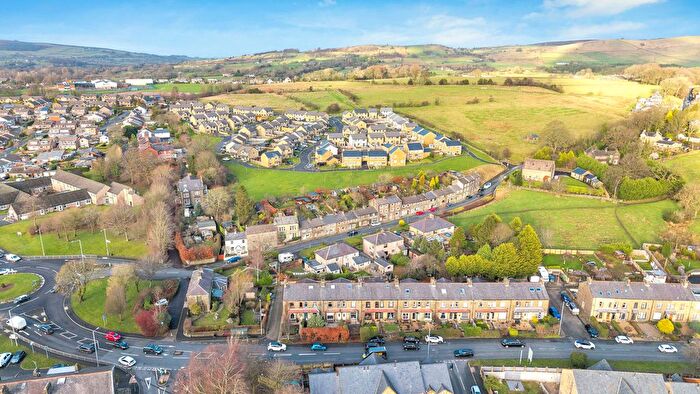
Horsfield is an area in Colne, Lancashire with 2,308 households², where the most expensive property was sold for £530,000.00.
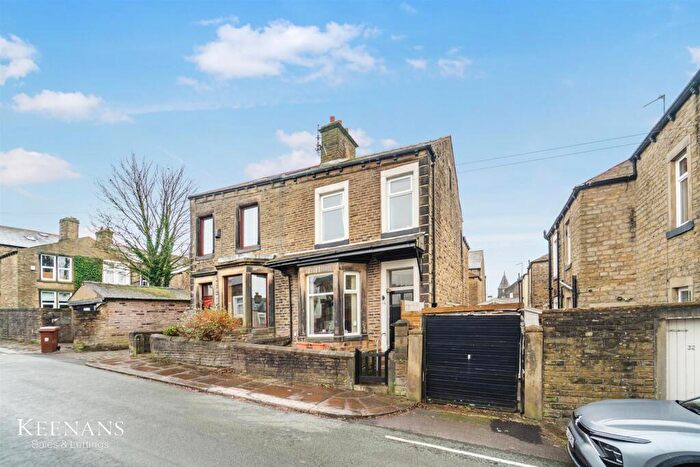
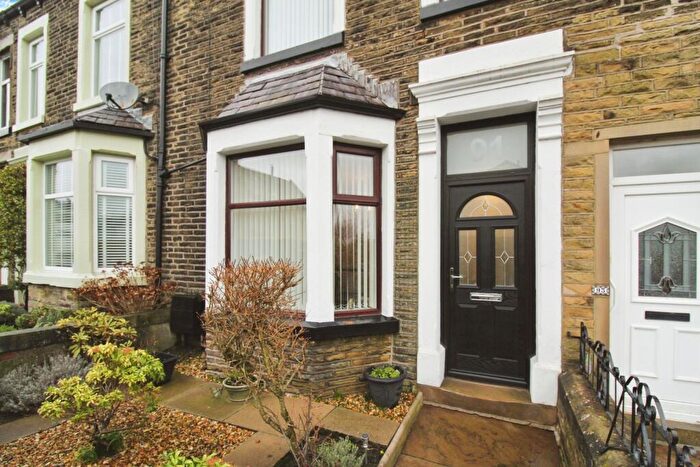
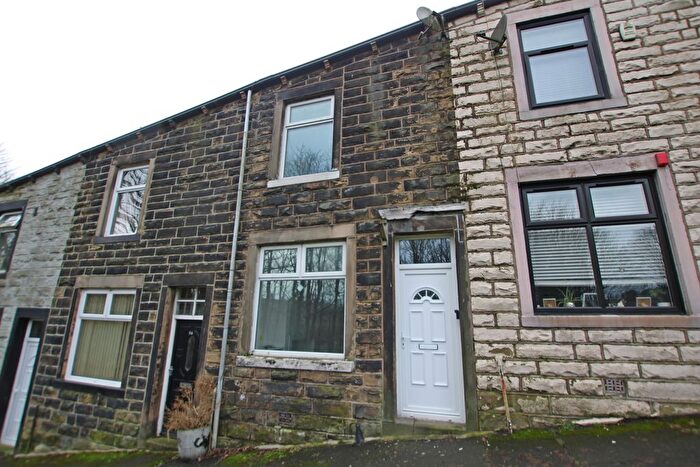
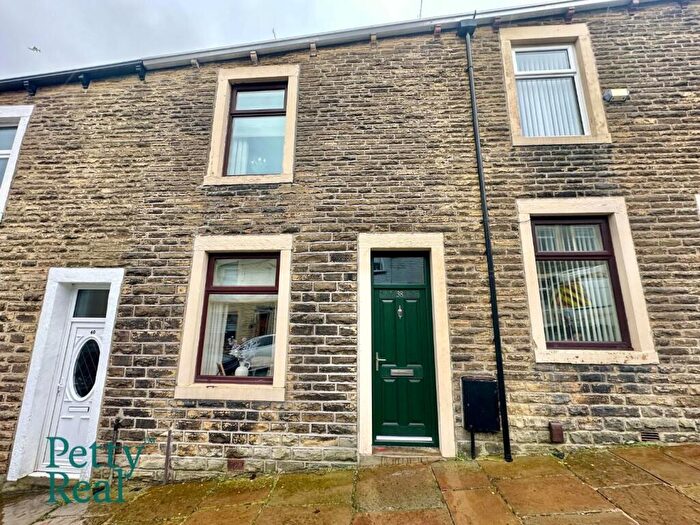
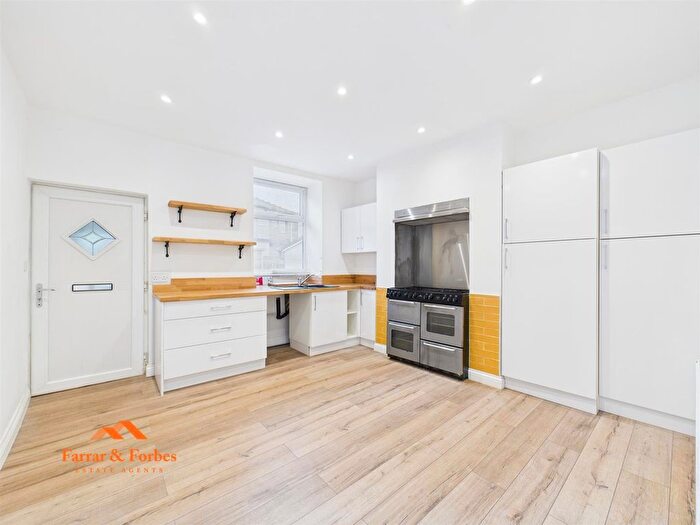
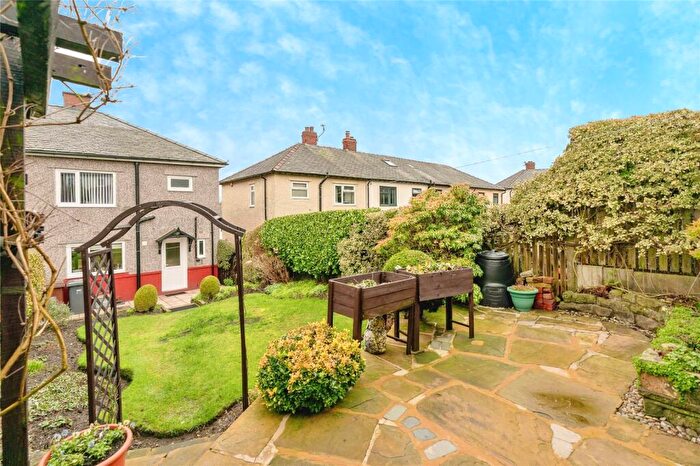
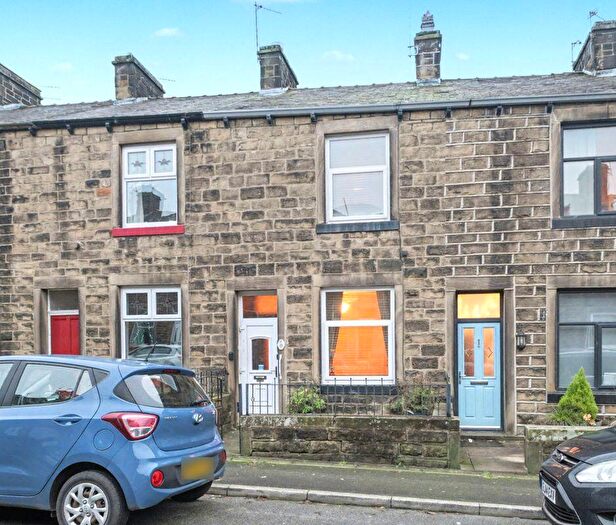
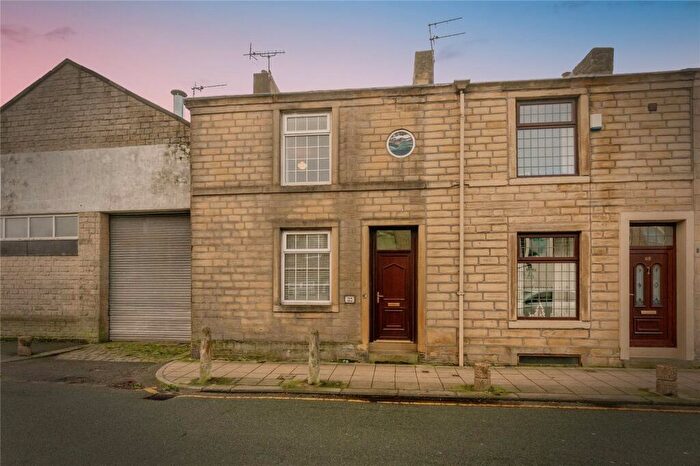
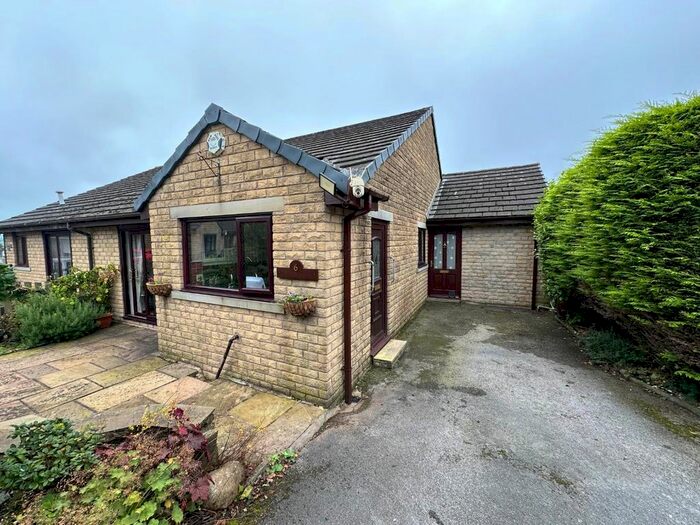
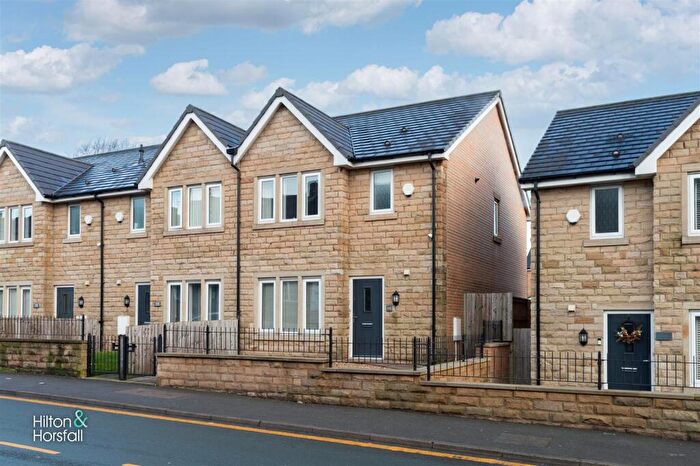
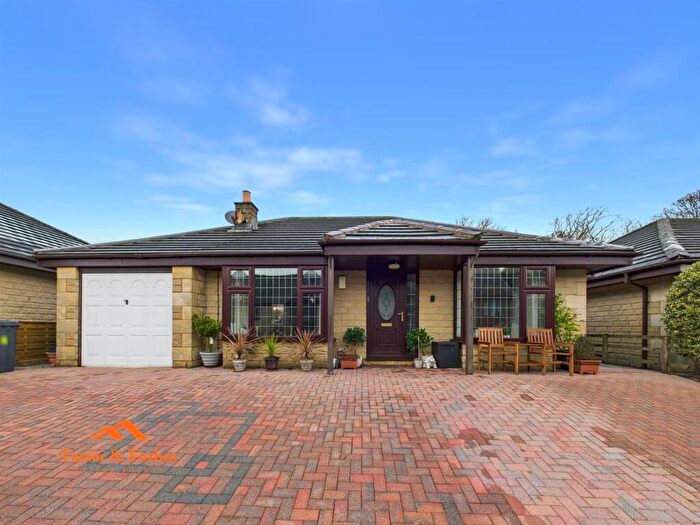
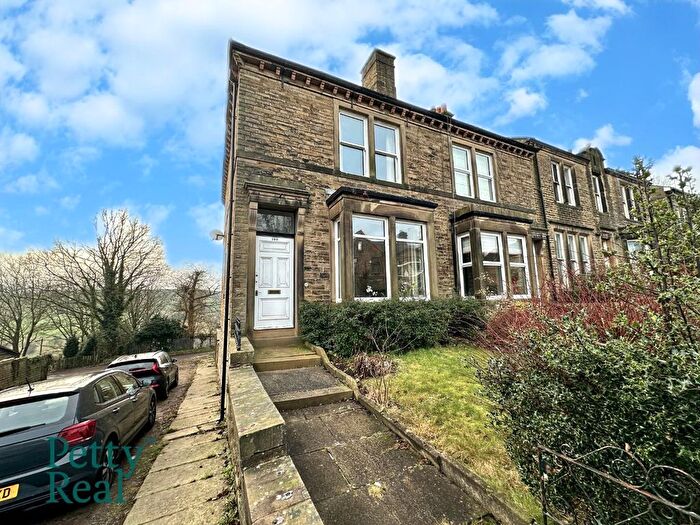
Properties for sale in Horsfield
Roads and Postcodes in Horsfield
Navigate through our locations to find the location of your next house in Horsfield, Colne for sale or to rent.
| Streets | Postcodes |
|---|---|
| Allendale Street | BB8 0BG |
| Allison Grove | BB8 0RA |
| Bath Street | BB8 9JQ |
| Beckett Mews | BB8 0QQ |
| Bradley Street | BB8 0QN |
| Brownhill Row | BB8 7DR |
| Buttermere Avenue | BB8 7RB |
| Byron Road | BB8 0BQ BB8 0RF |
| Carr Road | BB8 9LL |
| Casserley Road | BB8 0QT |
| Castle Close | BB8 0PD |
| Castle Court | BB8 7RD |
| Castle Road | BB8 7DS BB8 7EA |
| Charles Street | BB8 0LY BB8 0LZ |
| Chatham Crescent | BB8 9LS |
| Chatham Street | BB8 9LR BB8 9LT |
| Cleveland Street | BB8 0BD BB8 0BE |
| Clifford Street | BB8 9JL |
| Coniston Grove | BB8 7DE |
| Cross Skelton Street | BB8 9JB |
| Cumberland Street | BB8 9JD |
| Derwent Close | BB8 7DB |
| Dickson Street | BB8 9LU |
| Dockray Street | BB8 9HT |
| Dudley Street | BB8 0QW |
| Ellesmere Avenue | BB8 0QR |
| Elm Street | BB8 0RQ |
| Favordale Road | BB8 7AG |
| Fern Street | BB8 0QY BB8 0QZ |
| Gordon Street | BB8 0NE BB8 0NF |
| Granville Street | BB8 0NA BB8 0NB |
| Grasmere Close | BB8 7DN |
| Hawes Drive | BB8 7DL |
| High Street | BB8 9JA |
| Horsfield Close | BB8 0RE |
| Intake Crescent | BB8 0QU |
| Ivegate | BB8 9BN BB8 9DH |
| Keighley Road | BB8 0LP BB8 0LR BB8 0LS BB8 0QF BB8 0QG BB8 0TN |
| Langdale Rise | BB8 7RA |
| Langroyd Road | BB8 7AW BB8 9EG BB8 9EN BB8 9EQ |
| Lark Street | BB8 9EH |
| Lidgett | BB8 7AF |
| Lime Street | BB8 9EL |
| Lowther Street | BB8 9LN |
| Mason Street | BB8 9BU |
| Montague Street | BB8 9LP |
| New Bath Street | BB8 9LJ |
| New Market Street | BB8 9BY |
| New Oxford Street | BB8 9LQ |
| Norfolk Street | BB8 9JH BB8 9JN |
| Noyna Street | BB8 0PE |
| Oak Street | BB8 0AZ BB8 0BA BB8 0RH |
| Oxford Street | BB8 9JJ |
| Percy Street | BB8 0PB |
| Portland Street | BB8 0LX |
| Regent Avenue | BB8 7AX |
| Richmond Court | BB8 9HR |
| Russell Avenue | BB8 9LW |
| Rutland Street | BB8 0QJ |
| Rydal Place | BB8 7DA |
| Salisbury Street | BB8 9JF BB8 9JG |
| Sefton Street | BB8 0QP |
| Skelton Street | BB8 9JE |
| Skipton Old Road | BB8 7AE |
| Skipton Road | BB8 0NG BB8 0NH BB8 0NQ BB8 0NU BB8 0NX BB8 0NY BB8 0NZ |
| Snell Grove | BB8 0QS |
| Stratford Way | BB8 0QL |
| Temple Street | BB8 9LG |
| The Castle | BB8 7DX |
| The Green | BB8 0RG |
| The Park | BB8 0QH |
| Thirlmere Avenue | BB8 7DD |
| Thorn Grove | BB8 0QX |
| Townley Street | BB8 9LF |
| Union Street | BB8 9HX |
| Varley Street | BB8 0RB BB8 0RD |
| Venables Avenue | BB8 7DF BB8 7DG BB8 7DH BB8 7DJ BB8 7DQ |
| Windermere Avenue | BB8 7DW |
| Windsor Street | BB8 9LD |
| Windy Bank | BB8 9HJ BB8 9HY BB8 9HZ |
| York Street | BB8 0ND |
Transport near Horsfield
- FAQ
- Price Paid By Year
- Property Type Price
Frequently asked questions about Horsfield
What is the average price for a property for sale in Horsfield?
The average price for a property for sale in Horsfield is £122,710. This amount is 24% lower than the average price in Colne. There are 956 property listings for sale in Horsfield.
What streets have the most expensive properties for sale in Horsfield?
The streets with the most expensive properties for sale in Horsfield are Castle Court at an average of £460,000, Castle Road at an average of £403,750 and Langdale Rise at an average of £275,000.
What streets have the most affordable properties for sale in Horsfield?
The streets with the most affordable properties for sale in Horsfield are Cleveland Street at an average of £48,620, Ivegate at an average of £66,000 and High Street at an average of £70,000.
Which train stations are available in or near Horsfield?
Some of the train stations available in or near Horsfield are Colne, Nelson and Brierfield.
Property Price Paid in Horsfield by Year
The average sold property price by year was:
| Year | Average Sold Price | Price Change |
Sold Properties
|
|---|---|---|---|
| 2025 | £120,207 | -7% |
72 Properties |
| 2024 | £128,780 | 9% |
90 Properties |
| 2023 | £116,989 | -11% |
64 Properties |
| 2022 | £129,636 | -5% |
111 Properties |
| 2021 | £135,652 | 12% |
147 Properties |
| 2020 | £119,425 | 3% |
82 Properties |
| 2019 | £115,686 | 13% |
107 Properties |
| 2018 | £101,017 | 1% |
91 Properties |
| 2017 | £100,272 | -4% |
88 Properties |
| 2016 | £104,402 | 11% |
114 Properties |
| 2015 | £92,745 | 1% |
94 Properties |
| 2014 | £91,412 | 3% |
78 Properties |
| 2013 | £88,589 | -21% |
65 Properties |
| 2012 | £107,623 | 17% |
57 Properties |
| 2011 | £89,144 | 7% |
61 Properties |
| 2010 | £83,067 | -15% |
47 Properties |
| 2009 | £95,361 | 2% |
60 Properties |
| 2008 | £93,310 | -15% |
85 Properties |
| 2007 | £107,055 | 18% |
151 Properties |
| 2006 | £87,886 | 13% |
200 Properties |
| 2005 | £76,693 | 13% |
142 Properties |
| 2004 | £66,936 | 10% |
148 Properties |
| 2003 | £60,294 | 35% |
133 Properties |
| 2002 | £39,211 | -5% |
137 Properties |
| 2001 | £40,995 | 13% |
112 Properties |
| 2000 | £35,780 | 2% |
156 Properties |
| 1999 | £35,069 | 2% |
100 Properties |
| 1998 | £34,380 | -13% |
98 Properties |
| 1997 | £38,707 | 27% |
63 Properties |
| 1996 | £28,080 | -13% |
74 Properties |
| 1995 | £31,733 | - |
65 Properties |
Property Price per Property Type in Horsfield
Here you can find historic sold price data in order to help with your property search.
The average Property Paid Price for specific property types in the last three years are:
| Property Type | Average Sold Price | Sold Properties |
|---|---|---|
| Semi Detached House | £188,200.00 | 37 Semi Detached Houses |
| Detached House | £370,833.00 | 6 Detached Houses |
| Terraced House | £102,354.00 | 178 Terraced Houses |
| Flat | £65,000.00 | 5 Flats |

