
Houses for sale & to rent in John Ogaunt, Lancaster
House Prices in John Ogaunt
Properties in John Ogaunt have an average house price of £209k and had 386 Property Transactions within the last 3 years¹.
John Ogaunt is an area in Lancaster, Lancashire with 2,858 households², where the most expensive property was sold for £695k.
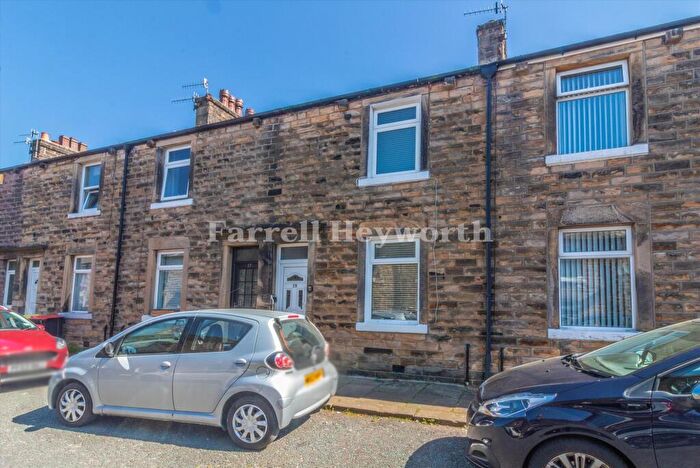
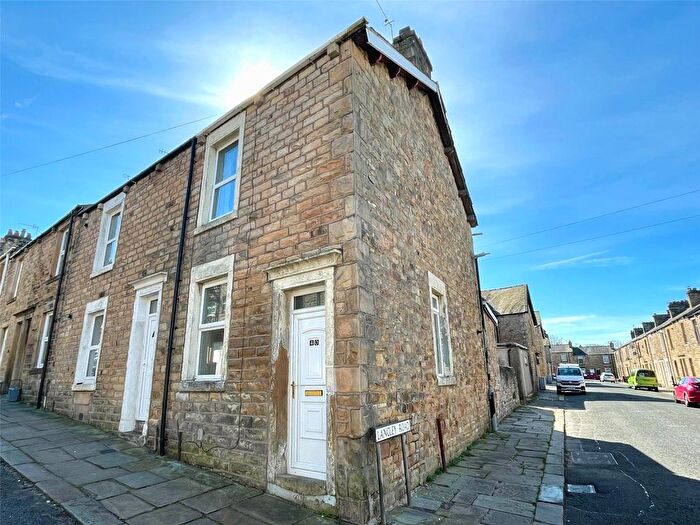
Properties for sale in John Ogaunt
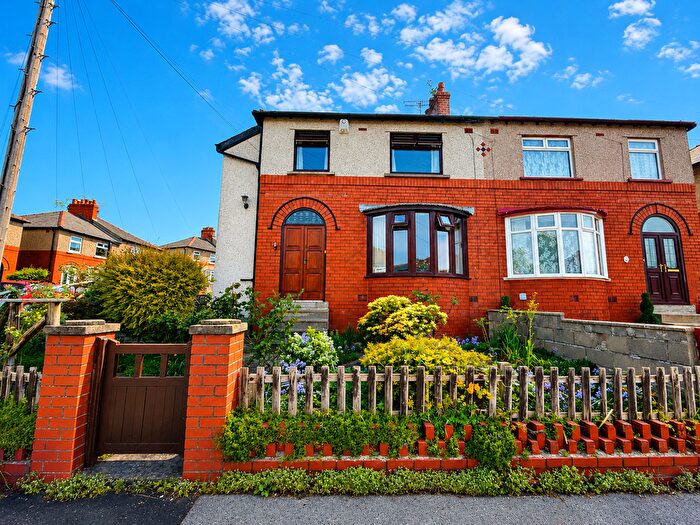
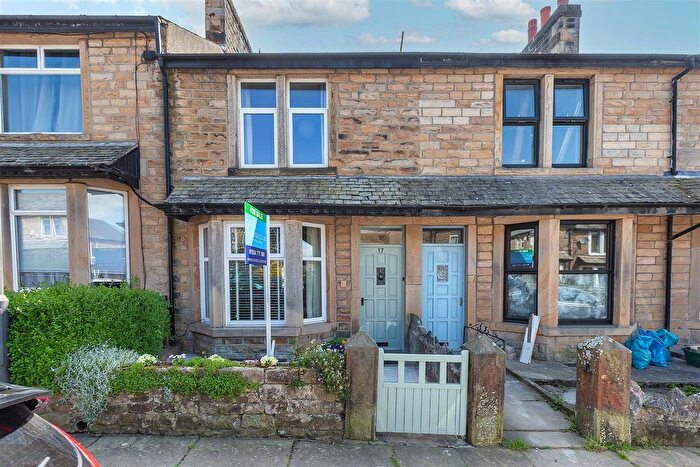

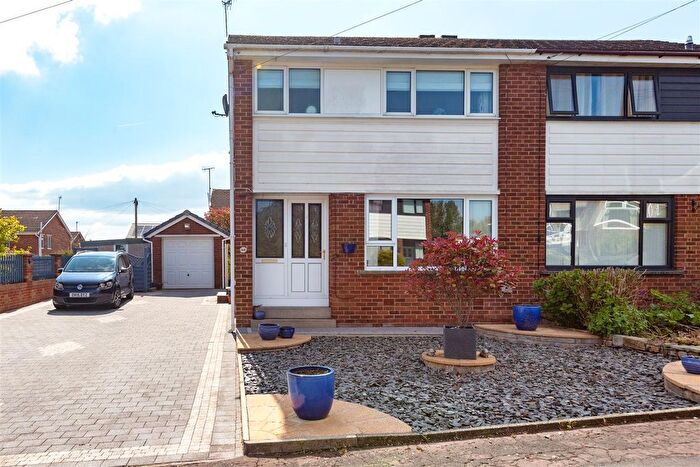
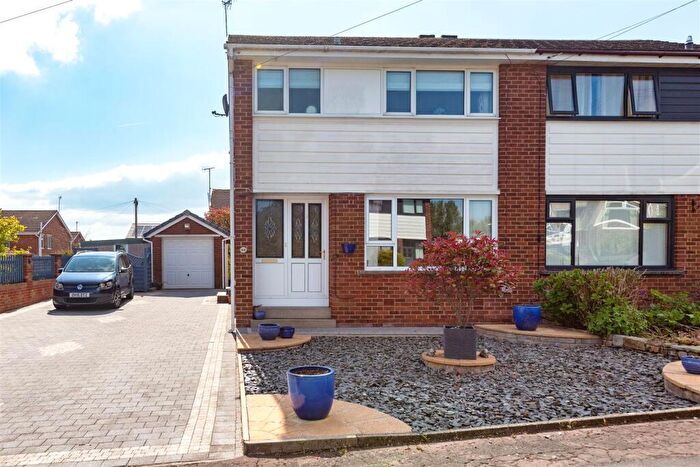
![]()
If you are looking to sell your house, let it out, or receive a property valuation, an expert can help you.
Click the button below to get started.


Roads and Postcodes in John Ogaunt
Navigate through our locations to find the location of your next house in John Ogaunt, Lancaster for sale or to rent.
| Streets | Postcodes |
|---|---|
| Aberdeen Road | LA1 3DA LA1 3DB |
| Adelphi Street | LA1 4AF |
| Anderson Close | LA1 3JE |
| Argyle Street | LA1 3DD |
| Ayr Street | LA1 3DT |
| Balmoral Road | LA1 3BT LA1 3BU |
| Blackwood Place | LA1 4HS |
| Bowerham Road | LA1 4AA LA1 4AE LA1 4AG LA1 4AQ LA1 4HJ LA1 4HN LA1 4HT LA1 4JP LA1 3JD LA1 3RR LA1 3RS LA1 3RT LA1 3RU |
| Bowerham Terrace | LA1 3AR |
| Bradshaw Street | LA1 3BE |
| Broadstone Court | LA1 3ST |
| Cambridge Avenue | LA1 4BB |
| Canterbury Avenue | LA1 4AU |
| Cedarwood Place | LA1 3FL |
| Chelmsford Close | LA1 4BJ |
| Chequers Avenue | LA1 4HY LA1 4HZ LA1 4JA |
| Clarence Street | LA1 3BB LA1 3BD LA1 3BG |
| Clougha Avenue | LA1 3JG |
| Colchester Avenue | LA1 4AX |
| Connaught Road | LA1 4BQ |
| Cork Road | LA1 4AJ LA1 4AY LA1 4BD |
| Coulston Road | LA1 3AB LA1 3AD LA1 3AE LA1 3JF |
| Cranwell Avenue | LA1 4HW |
| Cumberland View | LA1 4AB |
| Dale Street | LA1 3AP LA1 3AW |
| Dumbarton Road | LA1 3BX |
| Dundee Street | LA1 3DS |
| Dunkeld Street | LA1 3DQ |
| Eastham Street | LA1 3AY |
| Elgin Street | LA1 3DG |
| Exeter Avenue | LA1 4AL |
| Farmdale Road | LA1 4JB LA1 4JD |
| Fenham Carr Lane | LA1 3FH |
| Gleneagles Drive | LA1 3RP |
| Golgotha Road | LA1 3AA |
| Golgotha Village | LA1 3DZ |
| Greenfield Court | LA1 3EG |
| Gregson Road | LA1 3DH LA1 3DJ |
| Havelock Street | LA1 4AD |
| Hodder Place | LA1 4HR |
| Hope Street | LA1 3BQ |
| Kirkes Road | LA1 3DP LA1 3DW |
| Langley Road | LA1 3AZ |
| Leinster Court | LA1 4BH |
| Leinster Road | LA1 4BG |
| Lytham Close | LA1 3RN |
| Masonfield Crescent | LA1 3SR |
| Melrose Street | LA1 3DL |
| Newlands Avenue | LA1 4HU |
| Newlands Road | LA1 4JE LA1 4JF |
| Oakland Close | LA1 3SS |
| Park Avenue | LA1 3DX |
| Parkgate Drive | LA1 3FE LA1 3FN |
| Perth Street | LA1 3DR |
| Pottery Gardens | LA1 3TB |
| Primrose Court | LA1 3BF |
| Primrose Street | LA1 3BN |
| Prospect Street | LA1 3BH LA1 3BJ LA1 3BL |
| Quarry Mount Mews | LA1 3BZ |
| Quarry Road | LA1 3TR |
| Quernmore Road | LA1 3JT LA1 1UX |
| Redwood Heights | LA1 3FG |
| Shrewsbury Drive | LA1 4BA |
| St Andrews Close | LA1 3RL |
| St Oswald Street | LA1 3AS LA1 3AT |
| Standen Park House | LA1 3FF |
| Steward Avenue | LA1 4HP |
| Stirling Road | LA1 3DE LA1 3DF |
| Swan Yard | LA1 3EQ |
| Tarbet Street | LA1 3DN |
| The Colonnade | LA1 3FP |
| The Piazza | LA1 3FJ |
| The Spinney | LA1 4JQ |
| Ulster Road | LA1 4AH |
| Vincent Street | LA1 3BA |
| Wentworth Drive | LA1 3RJ |
| Westham Street | LA1 3AU LA1 3AX |
| Winchester Avenue | LA1 4HX |
| Windsor Avenue | LA1 4BE |
| Woodlea Court | LA1 3RW |
| Worcester Avenue | LA1 4AZ |
| Wyresdale Court | LA1 3FB |
| Wyresdale Gardens | LA1 3FA |
| Wyresdale Road | LA1 3DU LA1 3DY LA1 3EA LA1 3JJ LA1 3RF LA1 3JQ LA1 3LA |
Transport near John Ogaunt

- FAQ
- Price Paid By Year
- Property Type Price
Frequently asked questions about John Ogaunt
What is the average price for a property for sale in John Ogaunt?
The average price for a property for sale in John Ogaunt is £208,783. This amount is 9% lower than the average price in Lancaster. There are 1,290 property listings for sale in John Ogaunt.
What streets have the most expensive properties for sale in John Ogaunt?
The streets with the most expensive properties for sale in John Ogaunt are Redwood Heights at an average of £605,833, Standen Park House at an average of £479,375 and Chelmsford Close at an average of £440,000.
What streets have the most affordable properties for sale in John Ogaunt?
The streets with the most affordable properties for sale in John Ogaunt are Dunkeld Street at an average of £119,850, Swan Yard at an average of £124,750 and Dundee Street at an average of £125,562.
Which train stations are available in or near John Ogaunt?
Some of the train stations available in or near John Ogaunt are Lancaster, Bare Lane and Morecambe.
Property Price Paid in John Ogaunt by Year
The average sold property price by year was:
| Year | Average Sold Price | Price Change |
Sold Properties
|
|---|---|---|---|
| 2026 | £231,653 | 6% |
13 Properties |
| 2025 | £217,026.42 | 5% |
138 Properties |
| 2024 | £205,670.54 | 3% |
119 Properties |
| 2023 | £199,604.89 | -7% |
116 Properties |
| 2022 | £213,358.71 | 14% |
132 Properties |
| 2021 | £184,184.41 | 9% |
172 Properties |
| 2020 | £167,951.94 | 7% |
129 Properties |
| 2019 | £155,623.08 | -12% |
130 Properties |
| 2018 | £173,776.51 | 4% |
159 Properties |
| 2017 | £166,362.57 | -13% |
168 Properties |
| 2016 | £187,407.36 | 16% |
160 Properties |
| 2015 | £157,929.9 | 4% |
155 Properties |
| 2014 | £151,746 | 0,2% |
151 Properties |
| 2013 | £151,441 | 3% |
118 Properties |
| 2012 | £146,950 | -6% |
125 Properties |
| 2011 | £155,728 | 1% |
115 Properties |
| 2010 | £154,166 | 14% |
105 Properties |
| 2009 | £131,906 | -14% |
127 Properties |
| 2008 | £150,939 | -2% |
97 Properties |
| 2007 | £153,288 | 3% |
263 Properties |
| 2006 | £147,981 | 10% |
248 Properties |
| 2005 | £132,596 | -5% |
181 Properties |
| 2004 | £139,104 | 20% |
207 Properties |
| 2003 | £111,720 | 22% |
271 Properties |
| 2002 | £86,989 | 18% |
318 Properties |
| 2001 | £71,237 | 4% |
213 Properties |
| 2000 | £68,341 | 8% |
234 Properties |
| 1999 | £63,058 | 21% |
167 Properties |
| 1998 | £49,837 | 13% |
153 Properties |
| 1997 | £43,158 | -1% |
145 Properties |
| 1996 | £43,628 | -1% |
133 Properties |
| 1995 | £44,155 | - |
146 Properties |
Property Price per Property Type in John Ogaunt
Here you can find historic sold price data in order to help with your property search.
The average Property Paid Price for specific property types in the last three years are:
| Property Type | Average Sold Price | Sold Properties |
|---|---|---|
| Semi Detached House | £243,755.28 | 97 Semi Detached Houses |
| Detached House | £403,121.62 | 37 Detached Houses |
| Terraced House | £164,561.00 | 237 Terraced Houses |
| Flat | £201,956.00 | 15 Flats |