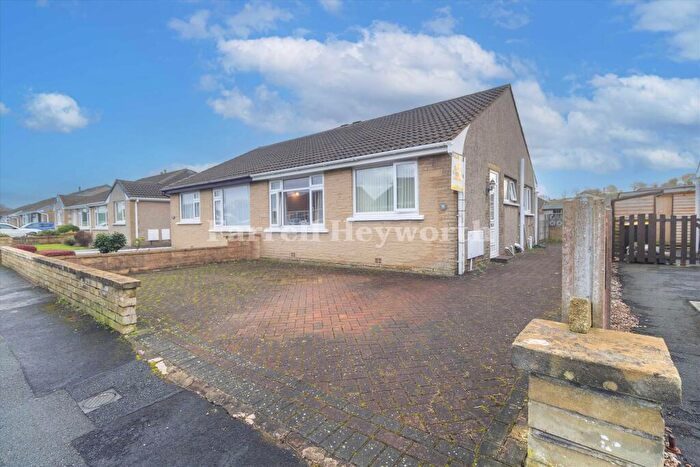
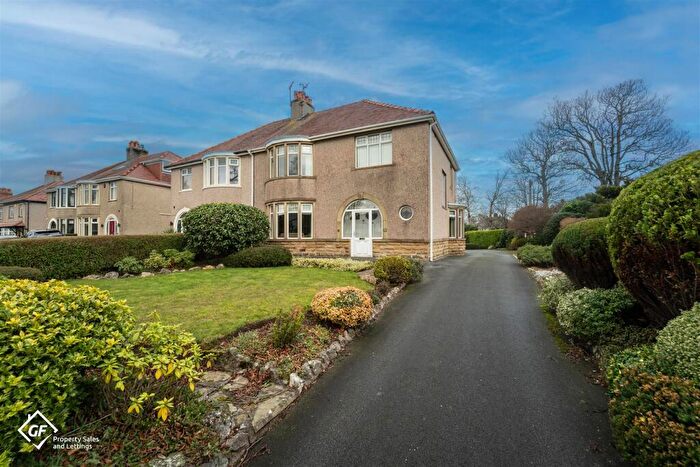
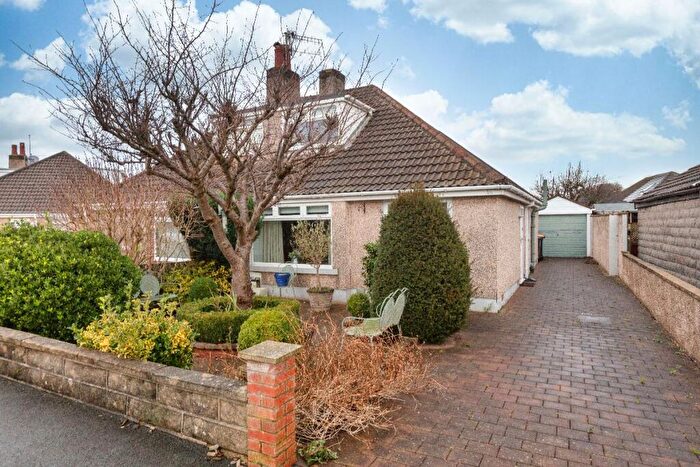
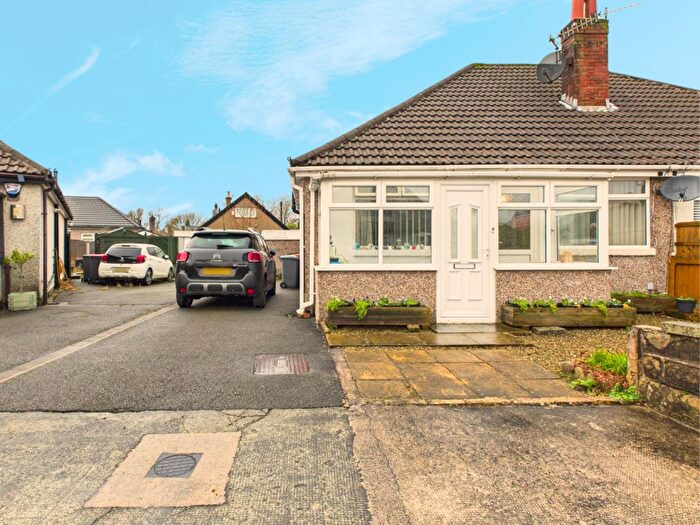
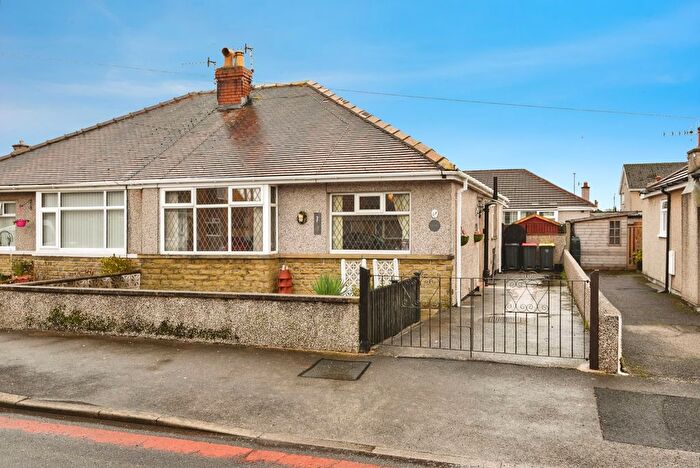
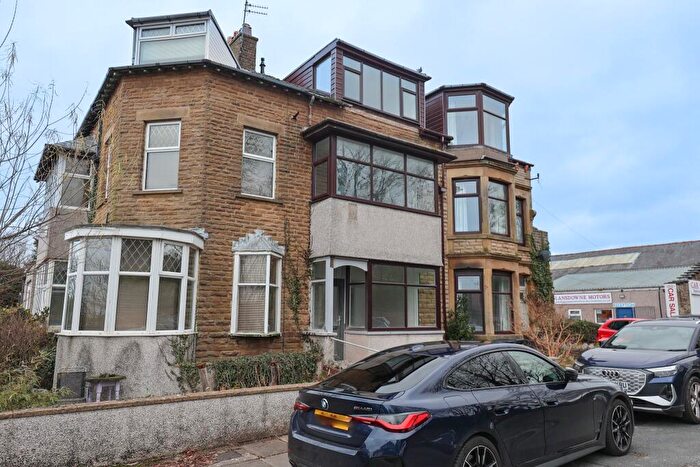
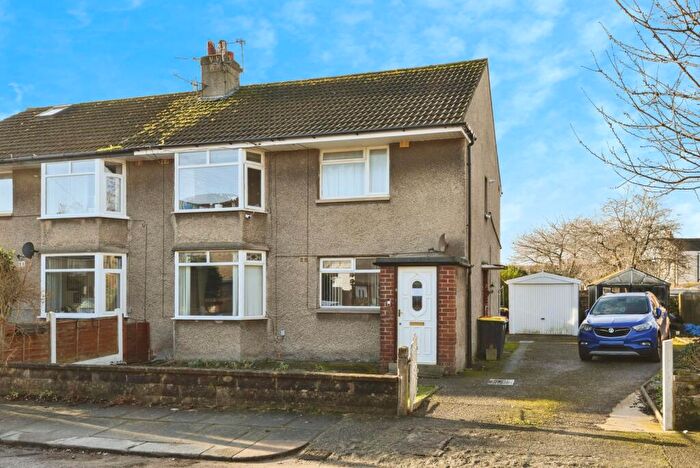
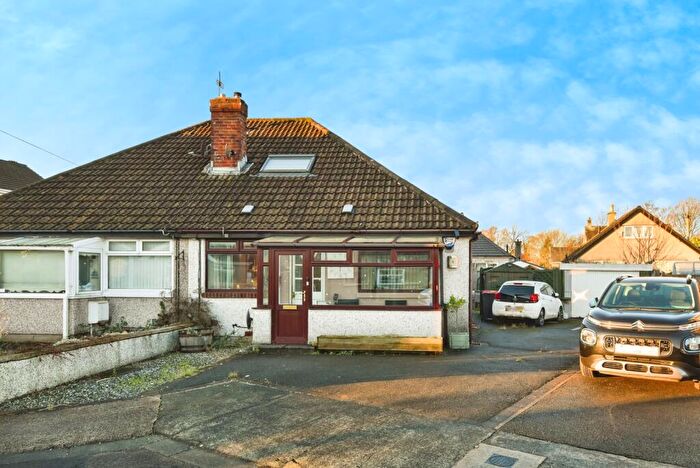
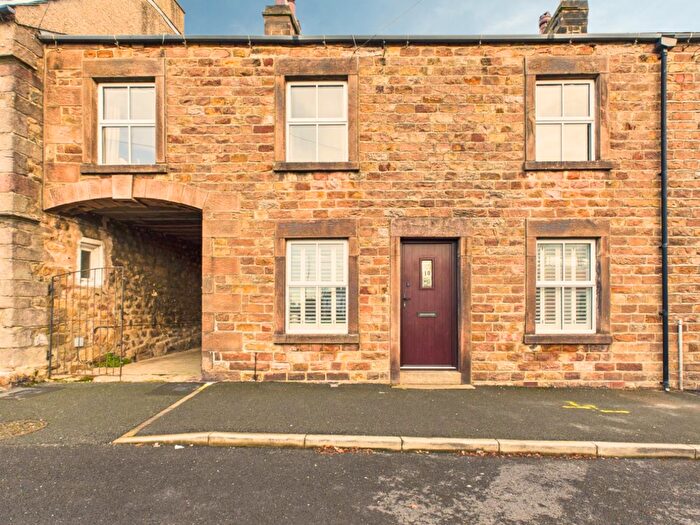
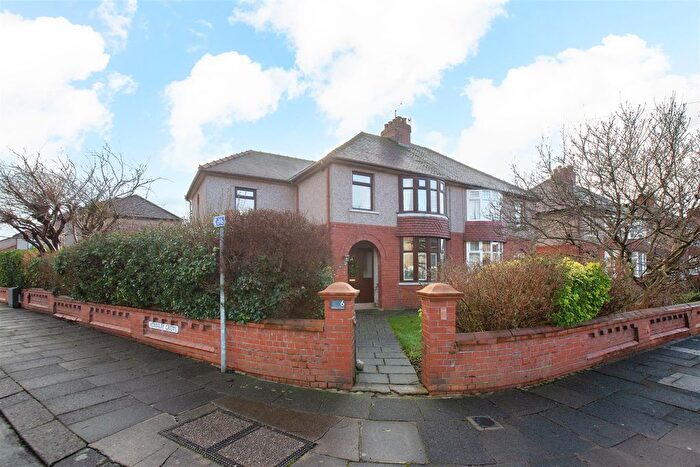
Houses for sale & to rent in Bare, Morecambe
House Prices in Bare
Properties in Bare have an average house price of £231,908.00 and had 234 Property Transactions within the last 3 years¹.
Bare is an area in Morecambe, Lancashire with 1,951 households², where the most expensive property was sold for £670,000.00.
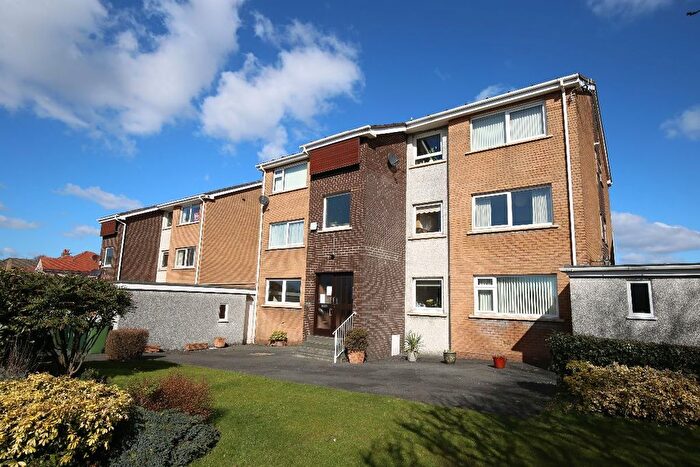
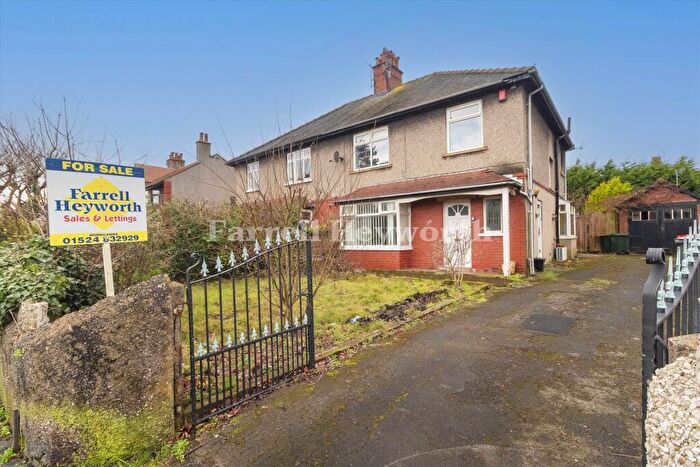
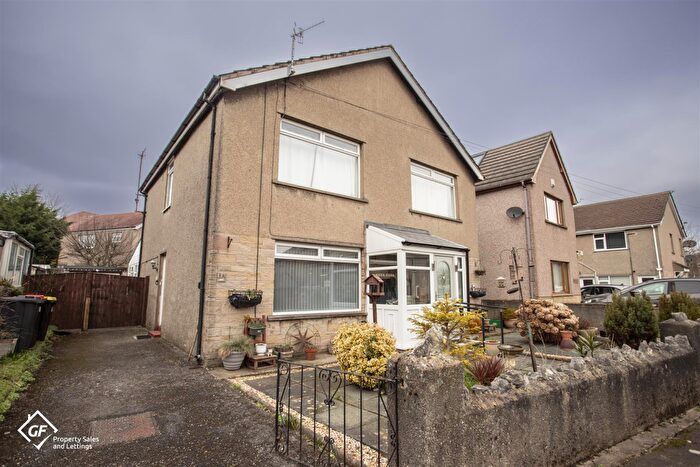
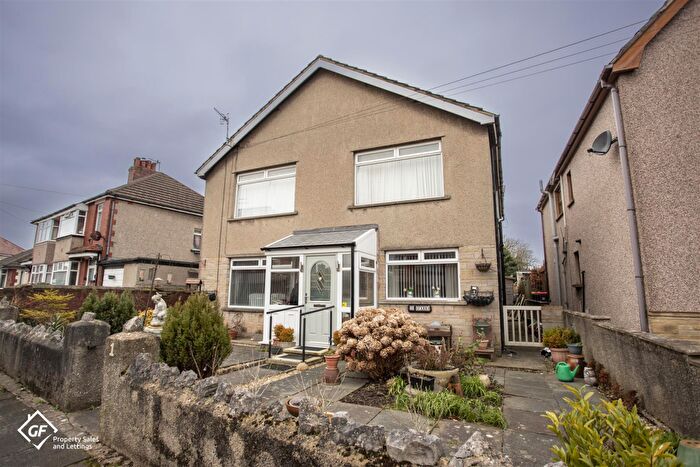
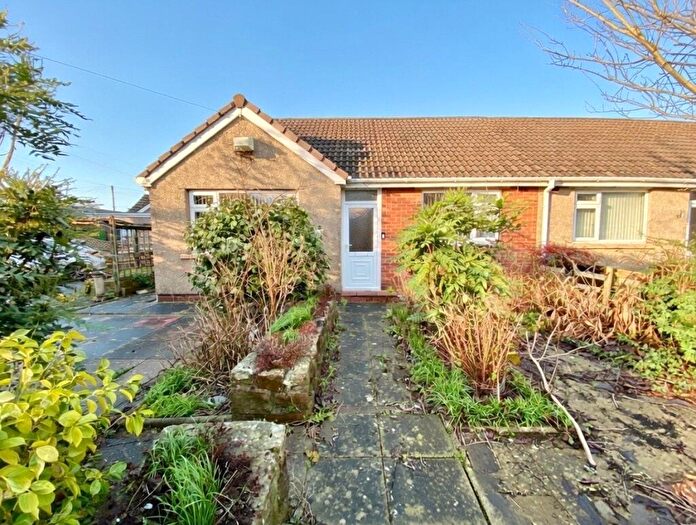
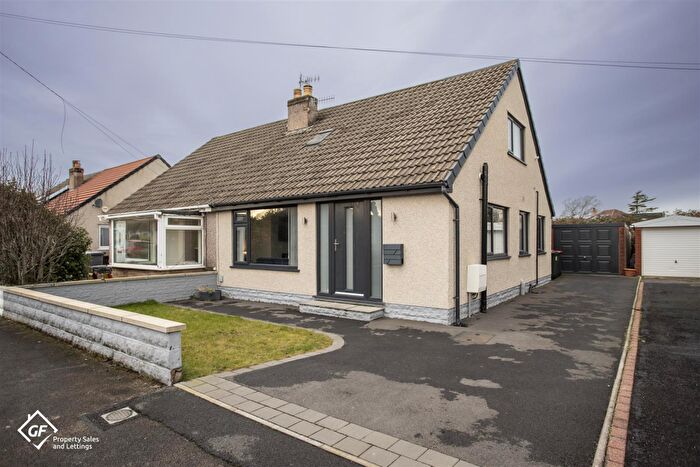
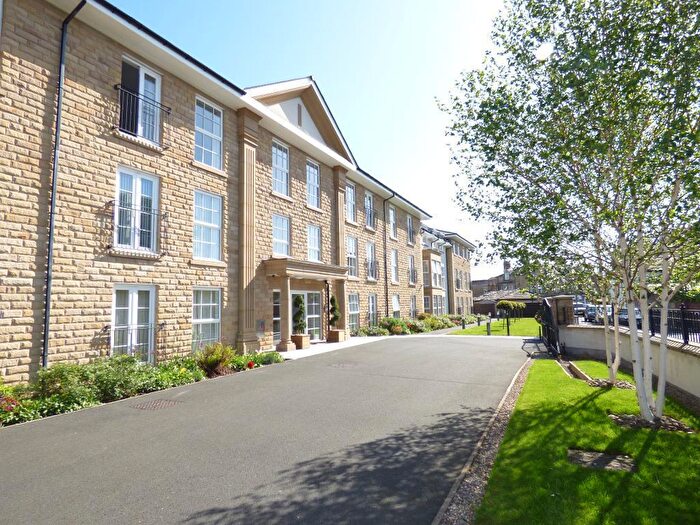
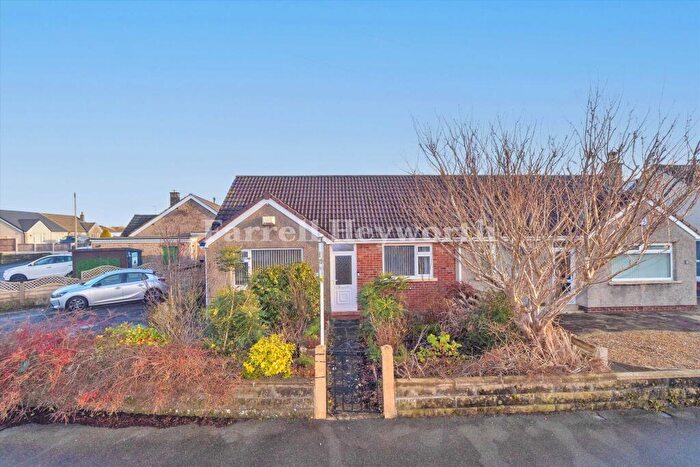
Properties for sale in Bare
Roads and Postcodes in Bare
Navigate through our locations to find the location of your next house in Bare, Morecambe for sale or to rent.
| Streets | Postcodes |
|---|---|
| Back Princes Crescent West | LA4 6BU |
| Bare Avenue | LA4 6BD LA4 6BE |
| Bare Lane | LA4 6DE LA4 6DF LA4 6DH LA4 6LJ LA4 6LL |
| Beach Street | LA4 6BS LA4 6BT |
| Berwyn Avenue | LA4 6DU |
| Betony | LA4 6JD |
| Brantwood Avenue | LA4 6HB |
| Broadway | LA4 5BH LA4 5BJ LA4 5BQ |
| Carlyle Grove | LA4 6HA |
| Chestnut Drive | LA4 6HN LA4 6HZ |
| Clarence Court | LA4 6DL |
| Clifford Avenue | LA4 6EG |
| Colwyn Avenue | LA4 6EH LA4 6EQ |
| Dallam Avenue | LA4 5BB LA4 5BD |
| Ellis Drive | LA4 6DN LA4 6DW |
| Elm Grove | LA4 6AT |
| Elms Drive | LA4 6DG LA4 6DQ |
| Elms Lane | LA4 6LR |
| Elms Road | LA4 6AP LA4 6DD |
| Fairhaven Way | LA4 5BP |
| Foxholes Road | LA4 6EL |
| Gainsborough Avenue | LA4 6DT |
| Gleneagles Drive | LA4 5BN |
| Grange Street | LA4 6BW |
| Grasmere Road | LA4 6DZ LA4 6EN |
| Halsall Drive | LA4 6JH |
| Happy Mount Court | LA4 6HX |
| Happy Mount Drive | LA4 6AR |
| Hazelwood Drive | LA4 6HP |
| Hest Bank Road | LA4 6HG LA4 6HH LA4 6HJ LA4 6HL LA4 6HQ |
| Lansdowne Grove | LA4 6AN LA4 6AW |
| Lansdowne Road | LA4 6AL |
| Lichfield Avenue | LA4 6EA |
| Lodges Grove | LA4 6HE LA4 6HF |
| Marine Road East | LA4 5AN LA4 5AR LA4 6AA LA4 6AB LA4 6AD LA4 6AE LA4 6AF LA4 6AG LA4 6AQ LA4 6AY LA4 6AJ |
| Mayfield Drive | LA4 6EP LA4 6ER LA4 6ES |
| Mount Avenue | LA4 6DJ |
| Mount Gardens | LA4 6AS |
| Newmarket Street | LA4 6BJ LA4 6BL LA4 6FA |
| Oak Avenue | LA4 6HR LA4 6HS LA4 6HY |
| Palmer Grove | LA4 6BQ |
| Park Crescent | LA4 6AU |
| Park Street | LA4 6BN |
| Pembroke Avenue | LA4 6EJ |
| Pinewood Avenue | LA4 6HW |
| Platten Grove | LA4 5RQ |
| Princes Crescent | LA4 6BX LA4 6BY LA4 6DA |
| Queens Drive | LA4 6LN |
| Ruskin Drive | LA4 6EY LA4 6EZ LA4 6EX |
| Seaborn Drive | LA4 6ET |
| Seaborn Grove | LA4 6BH |
| Seaborn Road | LA4 6BA LA4 6BB |
| St Andrews Grove | LA4 5BL |
| St Christophers Way | LA4 6EE |
| St Margarets Road | LA4 6EF |
| Stuart Avenue | LA4 6EB |
| Sulby Grove | LA4 6HD |
| Sunnyfield Avenue | LA4 6EU |
| Taylor Grove | LA4 6HT LA4 6HU |
| The Cove | LA4 6AX |
| The Parks | LA4 6BP |
| Thornton Road | LA4 5PB |
| Tudor Grove | LA4 6DP |
| Turnberry Close | LA4 5BS |
| Wakefield Avenue | LA4 6DY |
| Willow Grove | LA4 6JJ |
| Winchester Avenue | LA4 6DX |
| Woodrush | LA4 6JB |
Transport near Bare
- FAQ
- Price Paid By Year
- Property Type Price
Frequently asked questions about Bare
What is the average price for a property for sale in Bare?
The average price for a property for sale in Bare is £231,908. This amount is 22% higher than the average price in Morecambe. There are 951 property listings for sale in Bare.
What streets have the most expensive properties for sale in Bare?
The streets with the most expensive properties for sale in Bare are Happy Mount Court at an average of £470,000, Betony at an average of £412,500 and Broadway at an average of £405,750.
What streets have the most affordable properties for sale in Bare?
The streets with the most affordable properties for sale in Bare are Elm Grove at an average of £51,000, Park Street at an average of £75,000 and Lansdowne Grove at an average of £92,000.
Which train stations are available in or near Bare?
Some of the train stations available in or near Bare are Bare Lane, Morecambe and Lancaster.
Property Price Paid in Bare by Year
The average sold property price by year was:
| Year | Average Sold Price | Price Change |
Sold Properties
|
|---|---|---|---|
| 2025 | £236,847 | 7% |
63 Properties |
| 2024 | £220,216 | -8% |
78 Properties |
| 2023 | £238,368 | 11% |
93 Properties |
| 2022 | £211,785 | 6% |
124 Properties |
| 2021 | £199,896 | 5% |
129 Properties |
| 2020 | £189,856 | 16% |
79 Properties |
| 2019 | £159,460 | -4% |
105 Properties |
| 2018 | £165,698 | 1% |
94 Properties |
| 2017 | £163,544 | -4% |
97 Properties |
| 2016 | £169,526 | 0,2% |
92 Properties |
| 2015 | £169,146 | -2% |
109 Properties |
| 2014 | £172,109 | 9% |
142 Properties |
| 2013 | £157,060 | -5% |
76 Properties |
| 2012 | £165,424 | 8% |
81 Properties |
| 2011 | £152,419 | 6% |
97 Properties |
| 2010 | £143,331 | -1% |
84 Properties |
| 2009 | £145,056 | 5% |
75 Properties |
| 2008 | £137,147 | -16% |
60 Properties |
| 2007 | £159,282 | 4% |
142 Properties |
| 2006 | £153,138 | 6% |
156 Properties |
| 2005 | £143,900 | 10% |
74 Properties |
| 2004 | £129,838 | 20% |
142 Properties |
| 2003 | £104,253 | 20% |
148 Properties |
| 2002 | £83,027 | 16% |
167 Properties |
| 2001 | £69,336 | -6% |
173 Properties |
| 2000 | £73,493 | 8% |
162 Properties |
| 1999 | £67,959 | 16% |
124 Properties |
| 1998 | £57,413 | 4% |
138 Properties |
| 1997 | £54,893 | -4% |
122 Properties |
| 1996 | £56,958 | 10% |
135 Properties |
| 1995 | £51,066 | - |
117 Properties |
Property Price per Property Type in Bare
Here you can find historic sold price data in order to help with your property search.
The average Property Paid Price for specific property types in the last three years are:
| Property Type | Average Sold Price | Sold Properties |
|---|---|---|
| Semi Detached House | £259,000.00 | 79 Semi Detached Houses |
| Detached House | £349,371.00 | 41 Detached Houses |
| Terraced House | £232,868.00 | 22 Terraced Houses |
| Flat | £156,067.00 | 92 Flats |

