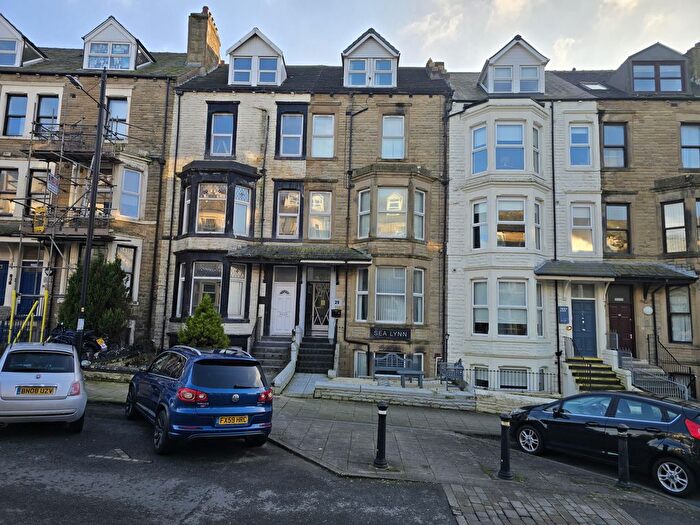
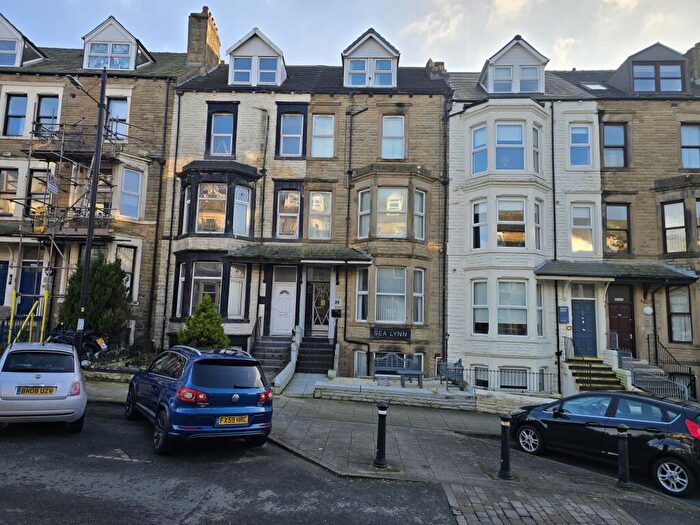
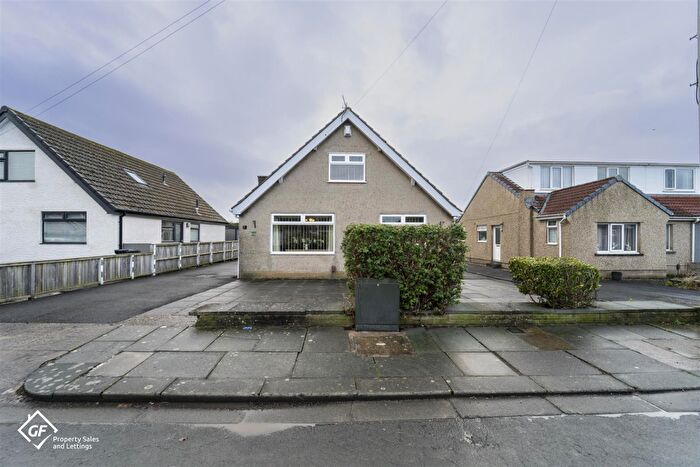
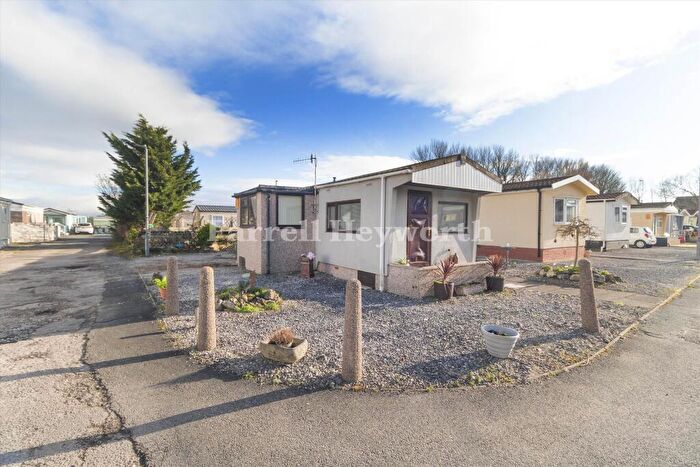
Houses for sale & to rent in Morecambe, Lancashire
House Prices in Morecambe
Properties in Morecambe have an average house price of £189,434.00 and had 2,308 Property Transactions within the last 3 years.¹
Morecambe is an area in Lancashire with 22,906 households², where the most expensive property was sold for £1,500,000.00.
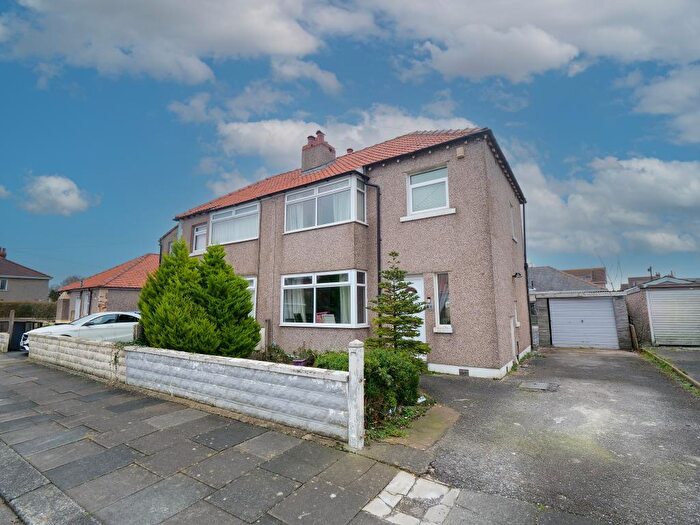
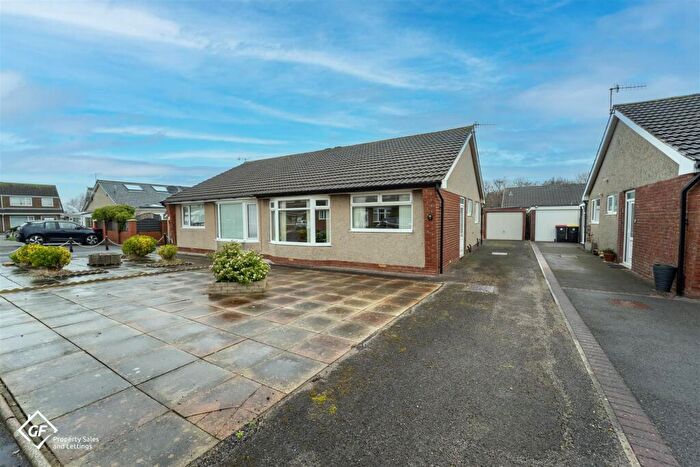
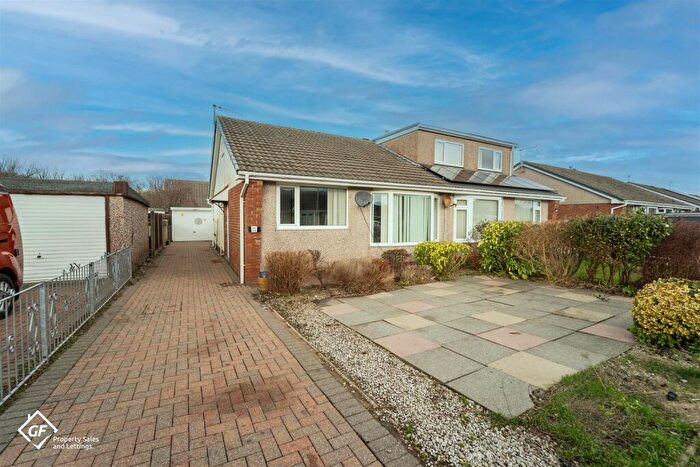
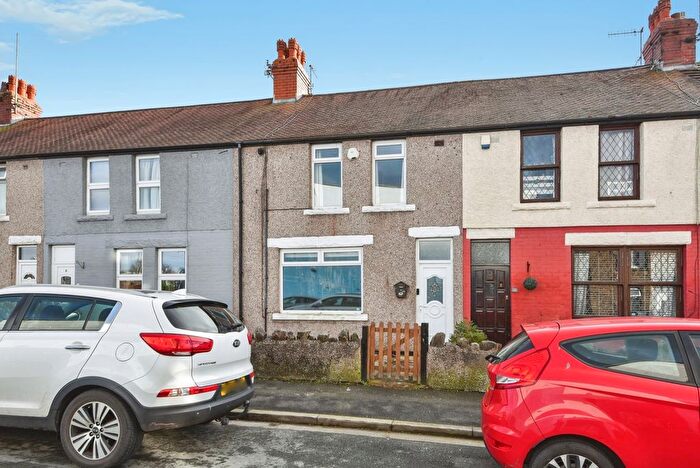
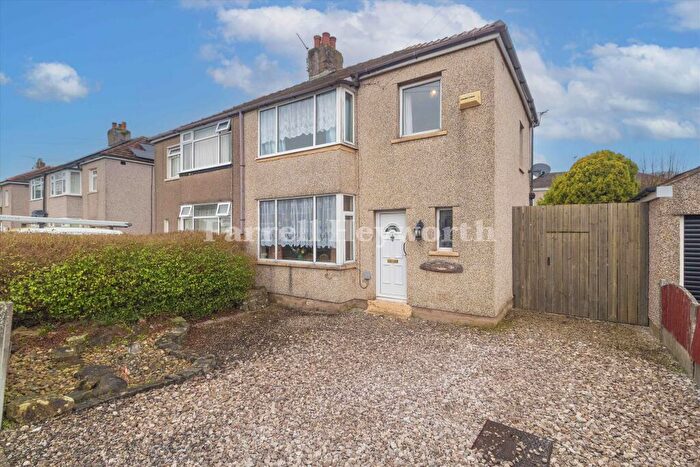
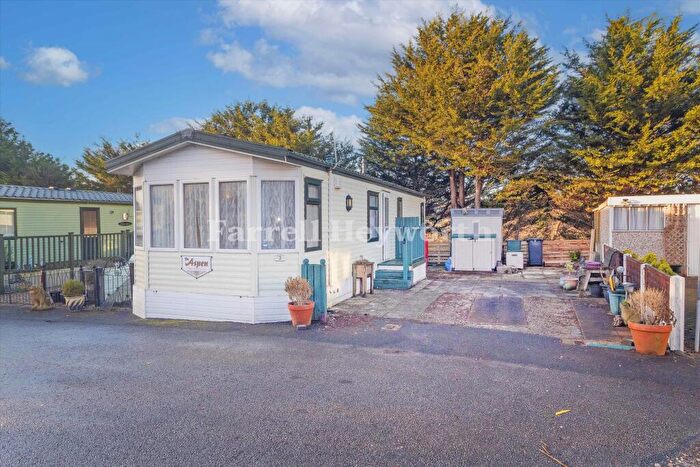
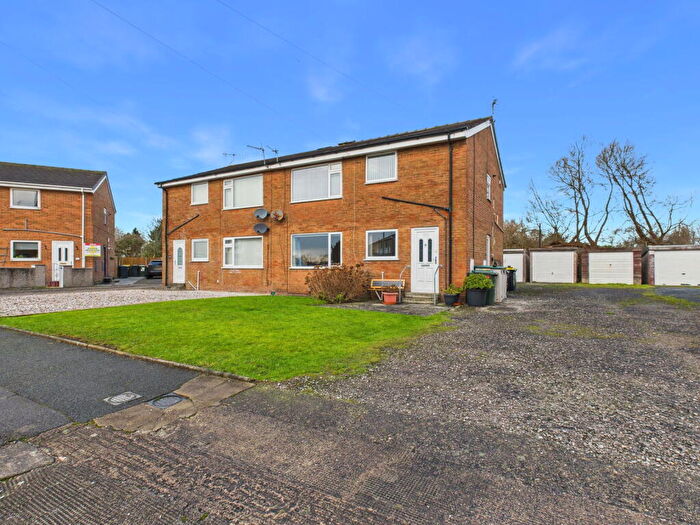
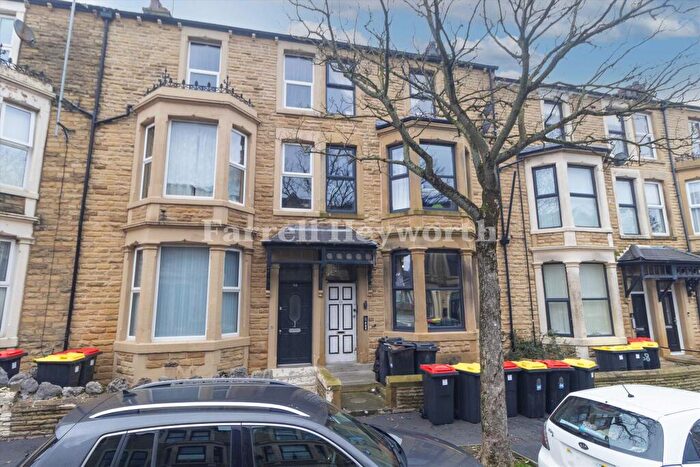
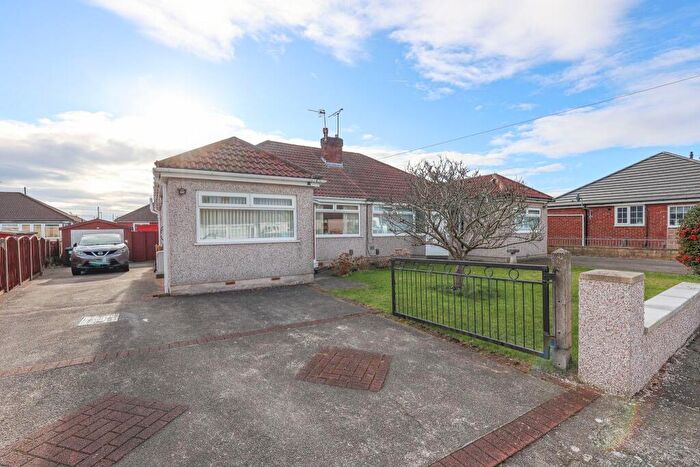
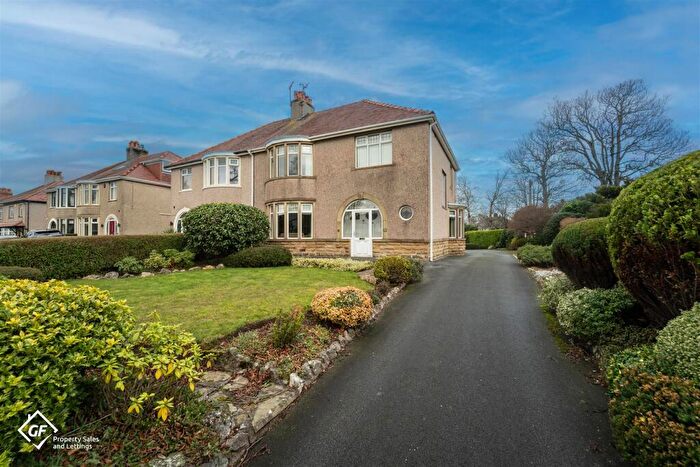
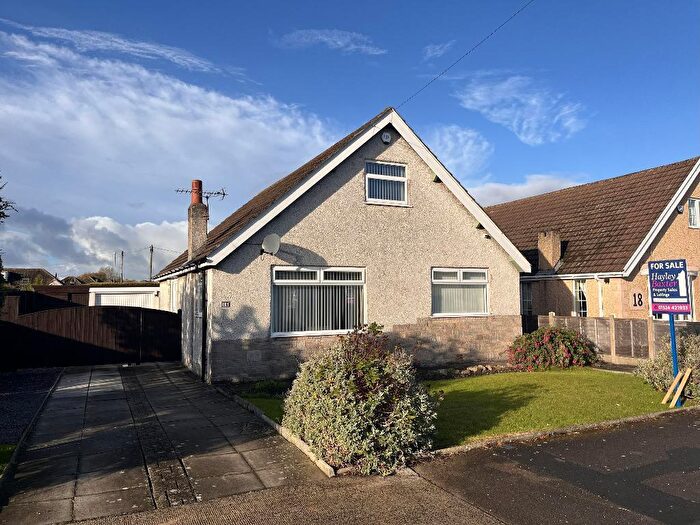
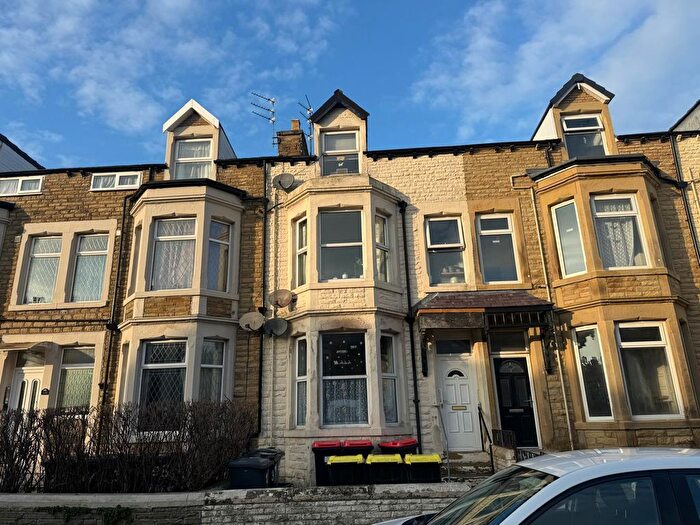
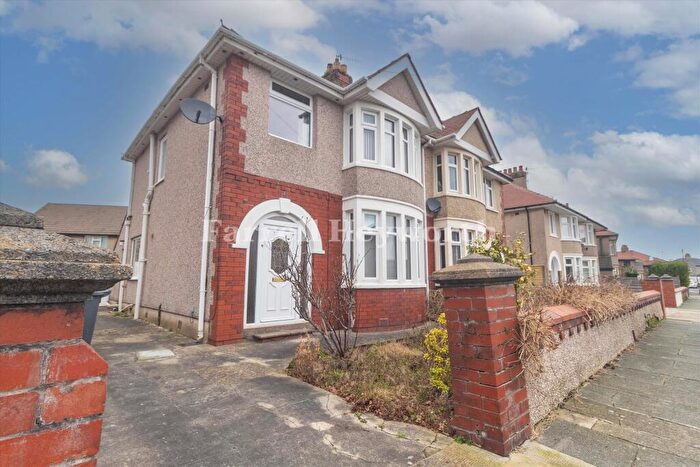
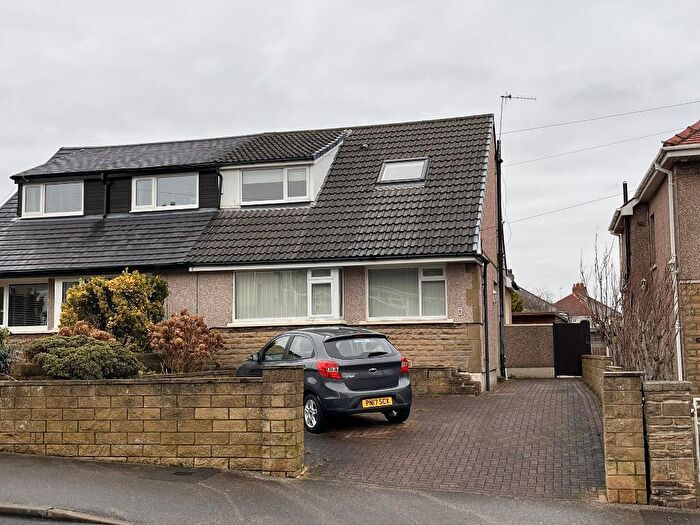
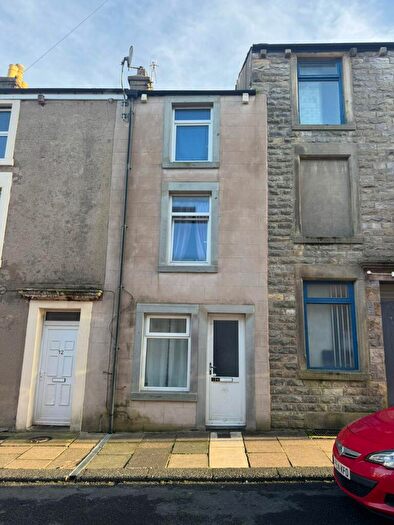
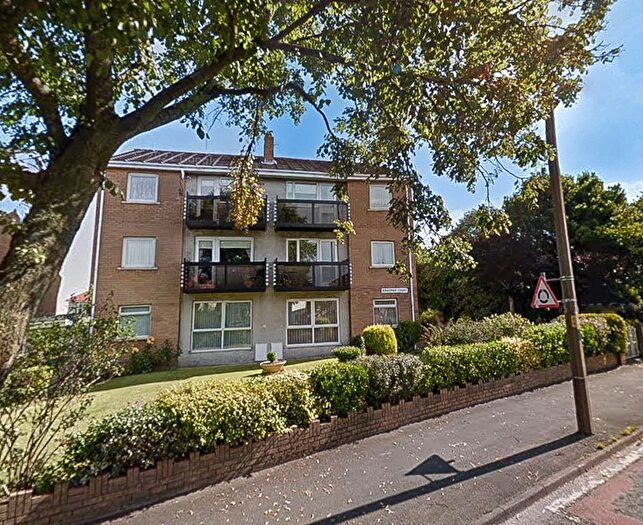
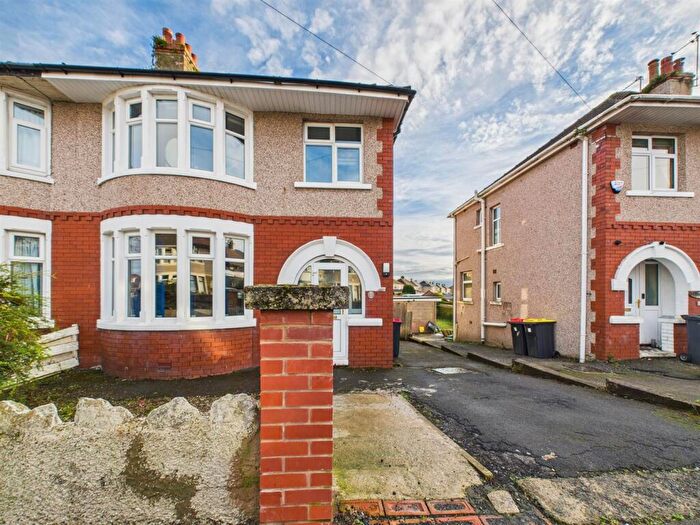
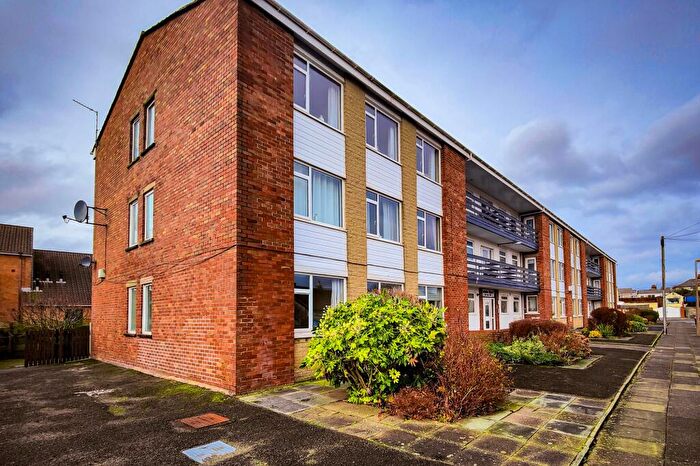
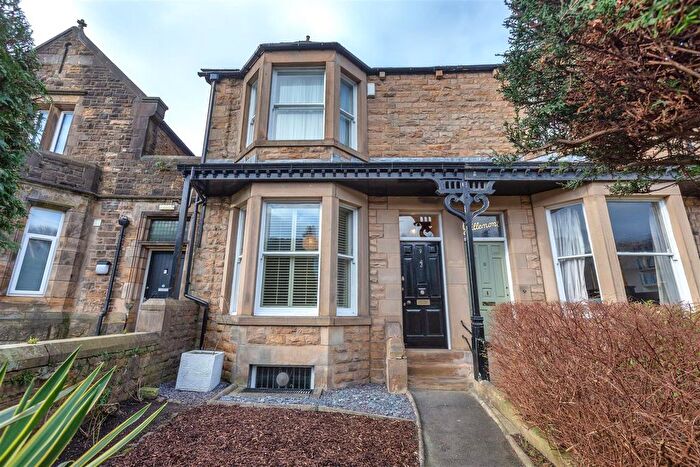
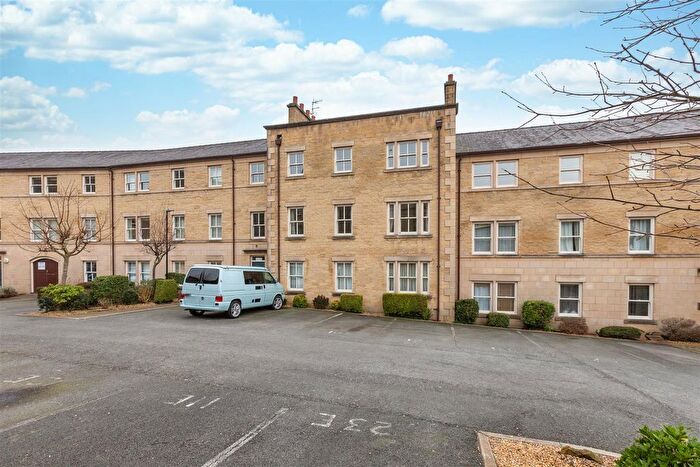
Properties for sale in Morecambe
Neighbourhoods in Morecambe
Navigate through our locations to find the location of your next house in Morecambe, Lancashire for sale or to rent.
Transport in Morecambe
Please see below transportation links in this area:
- FAQ
- Price Paid By Year
- Property Type Price
Frequently asked questions about Morecambe
What is the average price for a property for sale in Morecambe?
The average price for a property for sale in Morecambe is £189,434. This amount is 9% lower than the average price in Lancashire. There are 6,515 property listings for sale in Morecambe.
What locations have the most expensive properties for sale in Morecambe?
The locations with the most expensive properties for sale in Morecambe are Bare at an average of £231,908, Torrisholme at an average of £225,772 and Overton at an average of £219,007.
What locations have the most affordable properties for sale in Morecambe?
The locations with the most affordable properties for sale in Morecambe are Heysham North at an average of £139,670, Poulton at an average of £146,046 and Harbour at an average of £153,659.
Which train stations are available in or near Morecambe?
Some of the train stations available in or near Morecambe are Morecambe, Bare Lane and Lancaster.
Property Price Paid in Morecambe by Year
The average sold property price by year was:
| Year | Average Sold Price | Price Change |
Sold Properties
|
|---|---|---|---|
| 2025 | £194,638 | 3% |
710 Properties |
| 2024 | £188,811 | 2% |
792 Properties |
| 2023 | £185,462 | 4% |
806 Properties |
| 2022 | £178,874 | 3% |
988 Properties |
| 2021 | £172,832 | 11% |
1,157 Properties |
| 2020 | £153,638 | 3% |
749 Properties |
| 2019 | £148,419 | 5% |
998 Properties |
| 2018 | £140,943 | 1% |
958 Properties |
| 2017 | £138,849 | 5% |
989 Properties |
| 2016 | £131,707 | -2% |
971 Properties |
| 2015 | £134,879 | 3% |
985 Properties |
| 2014 | £130,172 | 5% |
1,028 Properties |
| 2013 | £124,129 | -3% |
780 Properties |
| 2012 | £128,293 | 5% |
720 Properties |
| 2011 | £122,380 | -1% |
805 Properties |
| 2010 | £123,890 | 1% |
691 Properties |
| 2009 | £122,051 | -4% |
752 Properties |
| 2008 | £127,145 | -8% |
776 Properties |
| 2007 | £137,645 | 9% |
1,430 Properties |
| 2006 | £125,638 | 9% |
1,514 Properties |
| 2005 | £113,710 | 9% |
1,083 Properties |
| 2004 | £103,225 | 22% |
1,583 Properties |
| 2003 | £80,697 | 24% |
1,740 Properties |
| 2002 | £61,702 | 10% |
1,745 Properties |
| 2001 | £55,493 | 5% |
1,623 Properties |
| 2000 | £52,646 | 4% |
1,405 Properties |
| 1999 | £50,622 | 7% |
1,056 Properties |
| 1998 | £47,020 | 6% |
1,073 Properties |
| 1997 | £44,114 | -0,2% |
1,123 Properties |
| 1996 | £44,191 | -1% |
989 Properties |
| 1995 | £44,710 | - |
857 Properties |
Property Price per Property Type in Morecambe
Here you can find historic sold price data in order to help with your property search.
The average Property Paid Price for specific property types in the last three years are:
| Property Type | Average Sold Price | Sold Properties |
|---|---|---|
| Semi Detached House | £200,442.00 | 1,074 Semi Detached Houses |
| Terraced House | £150,848.00 | 561 Terraced Houses |
| Detached House | £307,403.00 | 307 Detached Houses |
| Flat | £117,325.00 | 366 Flats |

