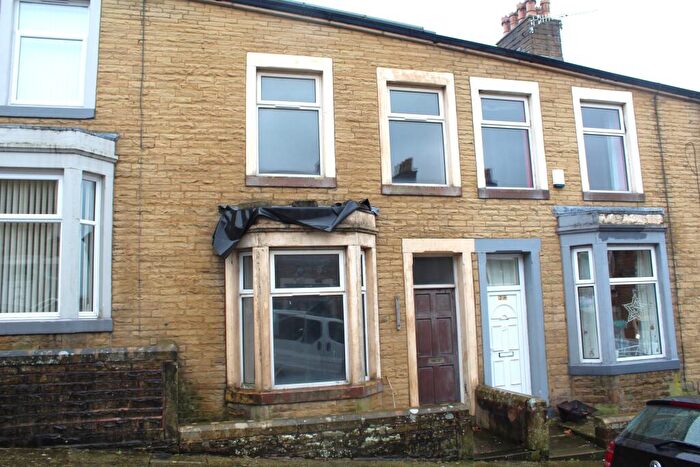
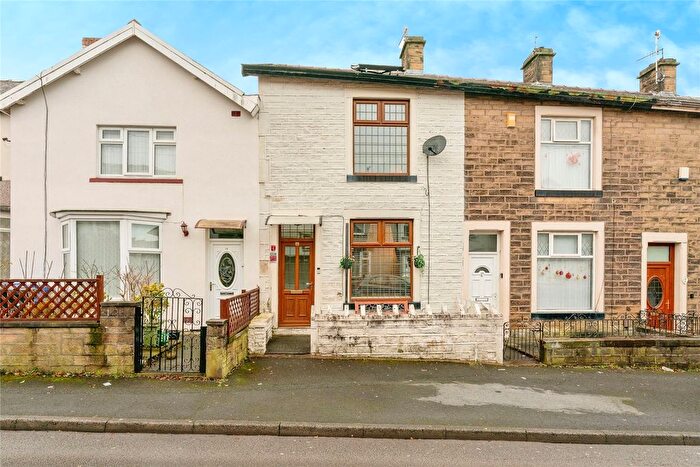
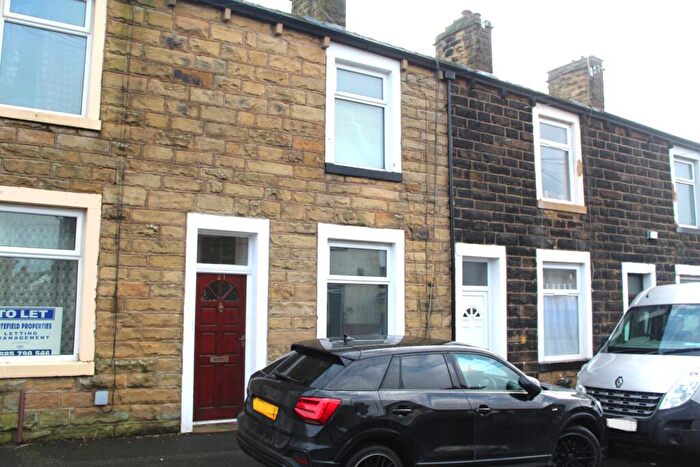
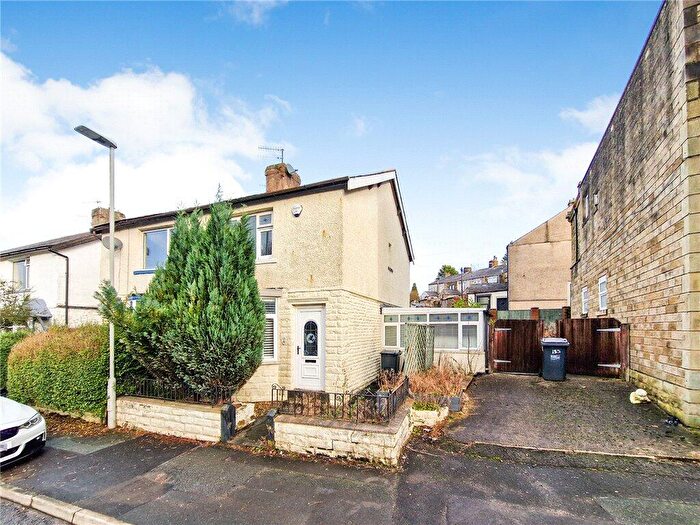
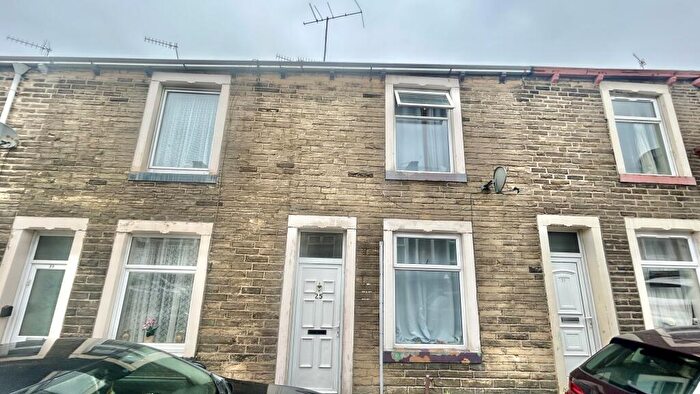
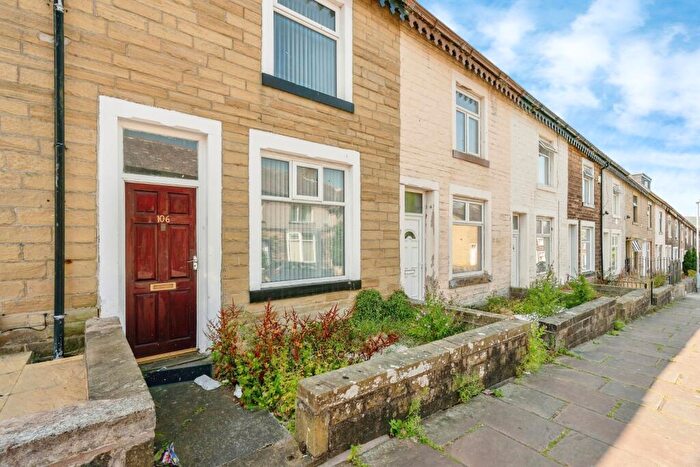
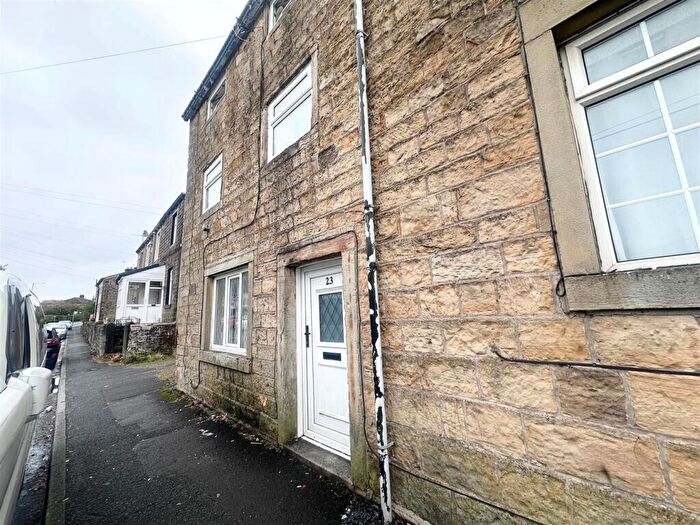
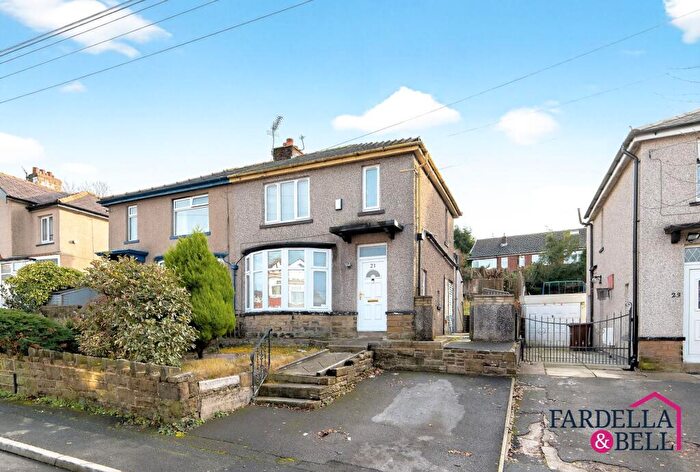
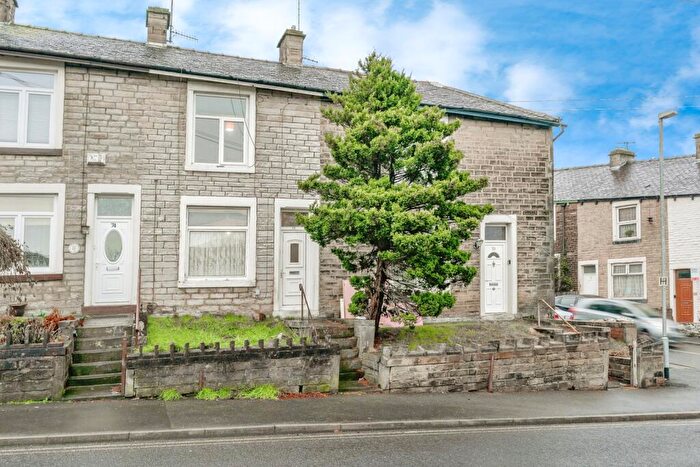
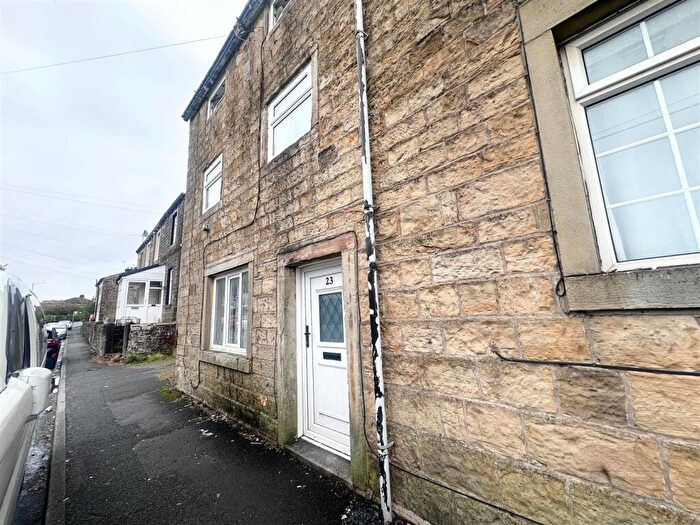
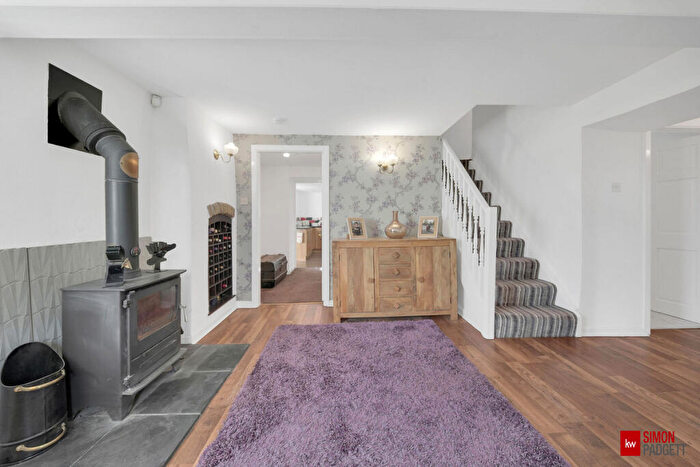
Houses for sale & to rent in Clover Hill, Nelson
House Prices in Clover Hill
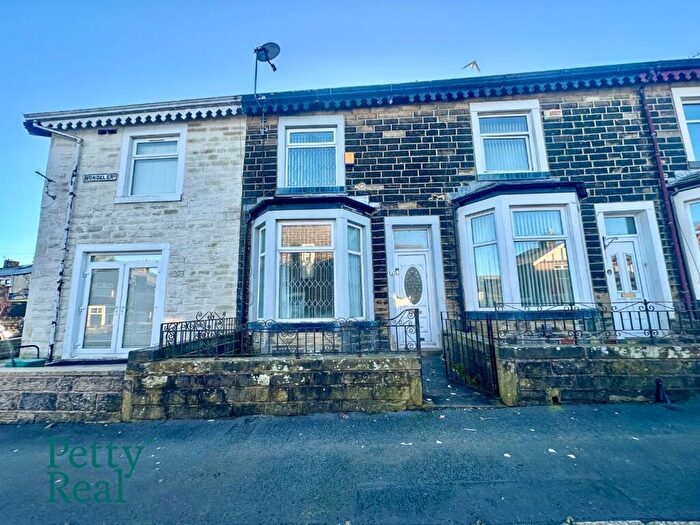
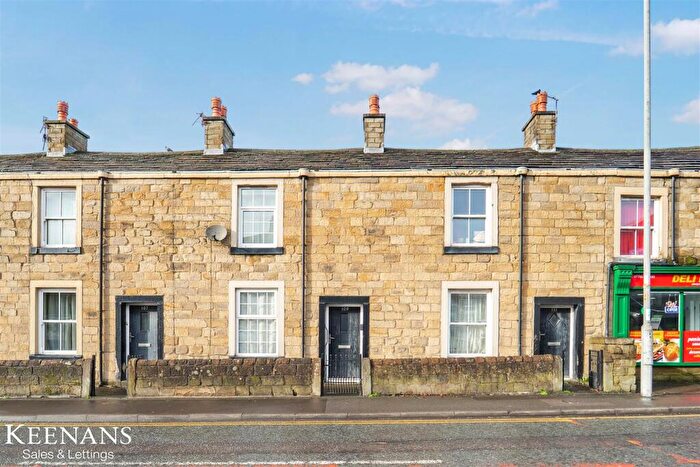
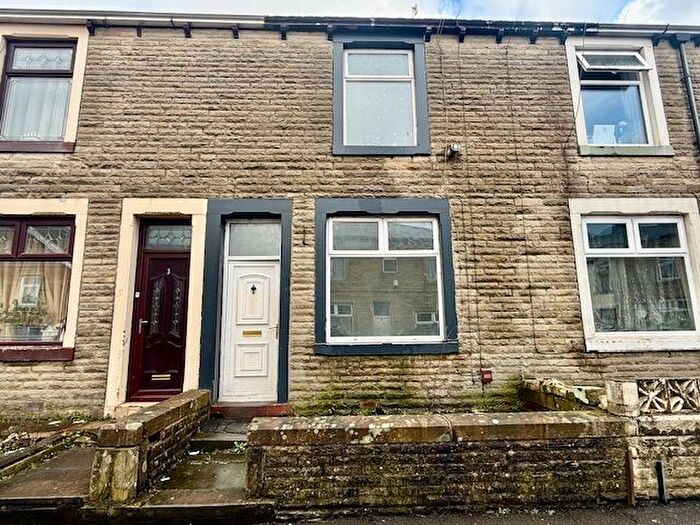
Properties in Clover Hill have an average house price of £97,338.00 and had 244 Property Transactions within the last 3 years¹.
Clover Hill is an area in Nelson, Lancashire with 2,127 households², where the most expensive property was sold for £460,000.00.
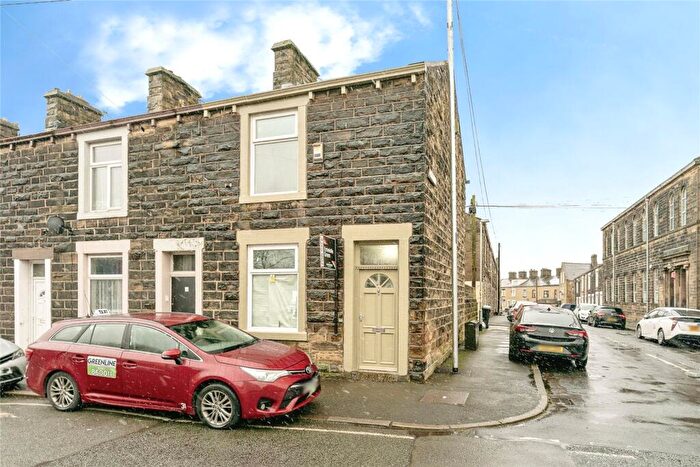
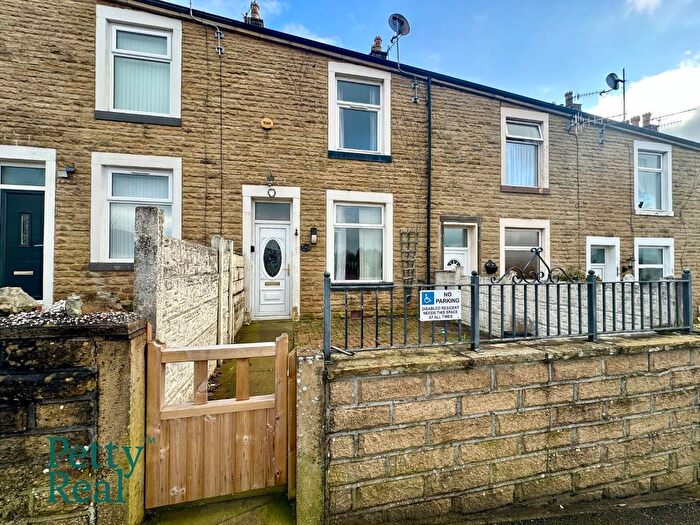
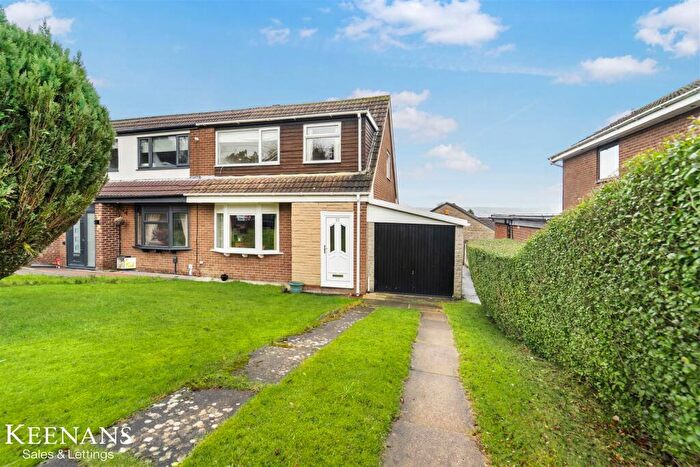
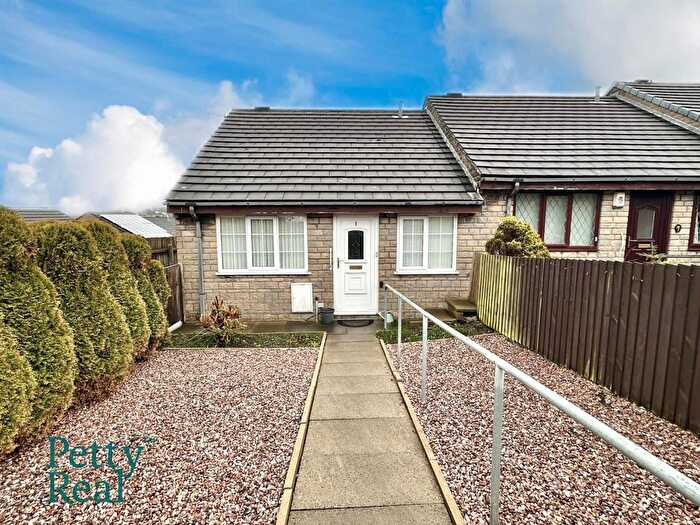
Properties for sale in Clover Hill
Roads and Postcodes in Clover Hill
Navigate through our locations to find the location of your next house in Clover Hill, Nelson for sale or to rent.
| Streets | Postcodes |
|---|---|
| Ada Street | BB9 0RU |
| Ashford Street | BB9 9DG |
| Ashton Drive | BB9 0UA |
| Beaufort Street | BB9 0RD BB9 0RE BB9 0RL BB9 0SA |
| Beech Tree Close | BB9 0XD |
| Beresford Street | BB9 0JB |
| Berkeley Close | BB9 0XA |
| Berkeley Street | BB9 0RH BB9 0RJ BB9 0RQ BB9 0SJ |
| Bispham Road | BB9 0RX |
| Borrowdale Avenue | BB9 0JW |
| Bowness Avenue | BB9 0SR |
| Bradshaw Street | BB9 9BW |
| Brunswick Street | BB9 0HS BB9 0JH BB9 0JP BB9 0JT BB9 0JX BB9 0LY BB9 0SL BB9 0SQ BB9 9DX BB9 9DY |
| Caldbeck Close | BB9 0SY |
| Carleton Street | BB9 9DH BB9 9DQ |
| Chapel House Road | BB9 0QN BB9 0QP BB9 0QS BB9 0QU BB9 9DJ BB9 9DL BB9 9PL |
| Clegg Street | BB9 0RT |
| Clover Hill Road | BB9 0JR |
| Day Street | BB9 0NJ |
| Ethersall Road | BB9 0RP |
| Fern Bank | BB9 0NH |
| Garden Street | BB9 9DN |
| Halifax Road | BB9 0EG BB9 0EL BB9 0EQ BB9 0ER BB9 0EW |
| Hammond Street | BB9 0LJ |
| Hawarden Street | BB9 0SF |
| Highmoor | BB9 0TU |
| Howgill Close | BB9 0SX |
| Hunslet Street | BB9 0JF |
| Kelswick Drive | BB9 0SZ |
| Langholme Street | BB9 0RW |
| Lowthwaite Drive | BB9 0SU |
| Mancknols Street | BB9 0LL |
| Marsden Fold | BB9 0ET |
| Messenger Street | BB9 0LW |
| Moorland View | BB9 0UB |
| Napier Street | BB9 0RA BB9 0RB BB9 0RF BB9 0RG BB9 0SN |
| Park Drive | BB9 0JY |
| Pilgrim Street | BB9 0JQ |
| Railway Street | BB9 0JD BB9 0JE BB9 0QH BB9 0QJ BB9 0QL BB9 0SE BB9 9PG |
| Redness Close | BB9 0SS |
| Rickard Road | BB9 0RN |
| Rosser Court | BB9 9DF |
| Sackville Street | BB9 0JG BB9 0JN |
| Scholefield Avenue | BB9 0EN |
| Scholefield Lane | BB9 0EP |
| Selby Street | BB9 0SH |
| Southfield Street | BB9 0LP BB9 0TB |
| Springfield Road | BB9 0QZ |
| St Georges Road | BB9 0YA |
| St Pauls Road | BB9 0QY |
| Stratton Court | BB9 0TZ |
| The Warings | BB9 0XF |
| Townsley Street | BB9 0RY |
| Uldale Close | BB9 0ST |
| Vaughan Street | BB9 0JS |
| Vernon Street | BB9 9DB BB9 9DD |
| Waidshouse Close | BB9 0SW |
| Waidshouse Road | BB9 0RR BB9 0RS BB9 0RZ BB9 0SB BB9 0XB |
| Walverden Terrace | BB9 0JL |
| Wenning Street | BB9 0LE |
| Wickworth Street | BB9 0LG |
Transport near Clover Hill
- FAQ
- Price Paid By Year
- Property Type Price
Frequently asked questions about Clover Hill
What is the average price for a property for sale in Clover Hill?
The average price for a property for sale in Clover Hill is £97,338. This amount is 26% lower than the average price in Nelson. There are 890 property listings for sale in Clover Hill.
What streets have the most expensive properties for sale in Clover Hill?
The streets with the most expensive properties for sale in Clover Hill are Marsden Fold at an average of £315,000, Howgill Close at an average of £231,666 and Lowthwaite Drive at an average of £207,000.
What streets have the most affordable properties for sale in Clover Hill?
The streets with the most affordable properties for sale in Clover Hill are Garden Street at an average of £56,466, Clover Hill Road at an average of £57,910 and Beresford Street at an average of £61,125.
Which train stations are available in or near Clover Hill?
Some of the train stations available in or near Clover Hill are Nelson, Brierfield and Colne.
Property Price Paid in Clover Hill by Year
The average sold property price by year was:
| Year | Average Sold Price | Price Change |
Sold Properties
|
|---|---|---|---|
| 2025 | £107,628 | 10% |
75 Properties |
| 2024 | £97,376 | 11% |
97 Properties |
| 2023 | £86,570 | -13% |
72 Properties |
| 2022 | £97,504 | 19% |
93 Properties |
| 2021 | £79,455 | 9% |
109 Properties |
| 2020 | £72,258 | 5% |
86 Properties |
| 2019 | £68,411 | -1% |
74 Properties |
| 2018 | £68,998 | 2% |
100 Properties |
| 2017 | £67,288 | 2% |
77 Properties |
| 2016 | £66,265 | 5% |
110 Properties |
| 2015 | £63,136 | 9% |
85 Properties |
| 2014 | £57,140 | 2% |
75 Properties |
| 2013 | £55,921 | -25% |
71 Properties |
| 2012 | £69,765 | 7% |
50 Properties |
| 2011 | £64,613 | 2% |
51 Properties |
| 2010 | £63,224 | -15% |
52 Properties |
| 2009 | £72,839 | -18% |
55 Properties |
| 2008 | £85,990 | -1% |
73 Properties |
| 2007 | £87,105 | 18% |
182 Properties |
| 2006 | £71,144 | 19% |
205 Properties |
| 2005 | £57,675 | 29% |
186 Properties |
| 2004 | £41,034 | 19% |
215 Properties |
| 2003 | £33,338 | 10% |
149 Properties |
| 2002 | £29,999 | 11% |
183 Properties |
| 2001 | £26,589 | -28% |
145 Properties |
| 2000 | £33,949 | 14% |
111 Properties |
| 1999 | £29,196 | 8% |
102 Properties |
| 1998 | £26,895 | -15% |
100 Properties |
| 1997 | £31,026 | -2% |
78 Properties |
| 1996 | £31,553 | 1% |
73 Properties |
| 1995 | £31,254 | - |
97 Properties |
Property Price per Property Type in Clover Hill
Here you can find historic sold price data in order to help with your property search.
The average Property Paid Price for specific property types in the last three years are:
| Property Type | Average Sold Price | Sold Properties |
|---|---|---|
| Semi Detached House | £160,561.00 | 39 Semi Detached Houses |
| Detached House | £272,750.00 | 8 Detached Houses |
| Terraced House | £77,646.00 | 196 Terraced Houses |
| Flat | £88,000.00 | 1 Flat |

