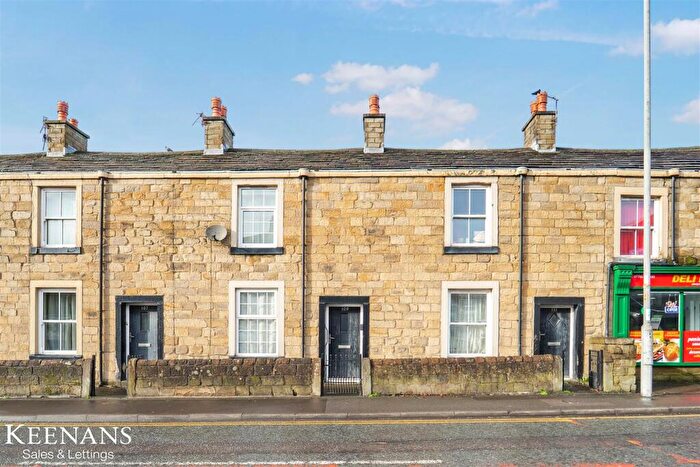
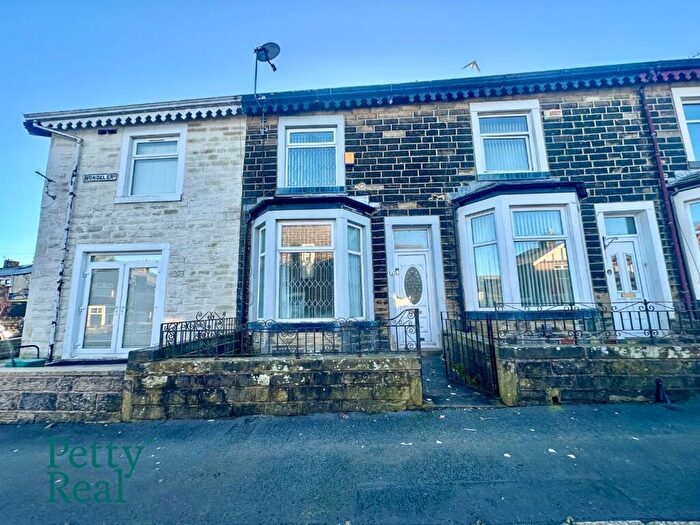
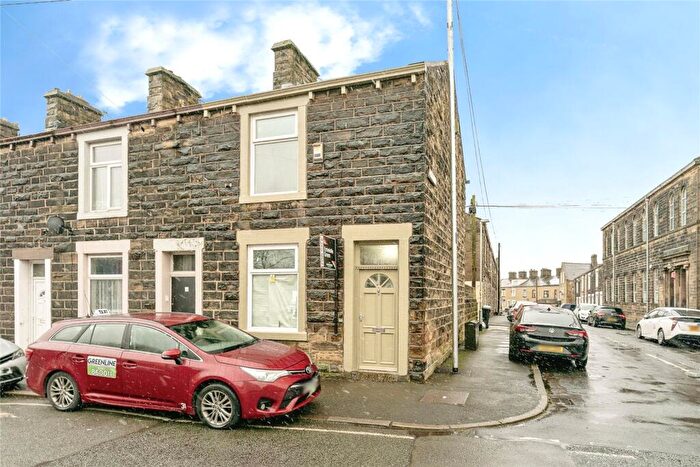
Houses for sale & to rent in Whitefield, Nelson
House Prices in Whitefield
Properties in Whitefield have an average house price of £92,678.00 and had 111 Property Transactions within the last 3 years¹.
Whitefield is an area in Nelson, Lancashire with 1,122 households², where the most expensive property was sold for £300,000.00.
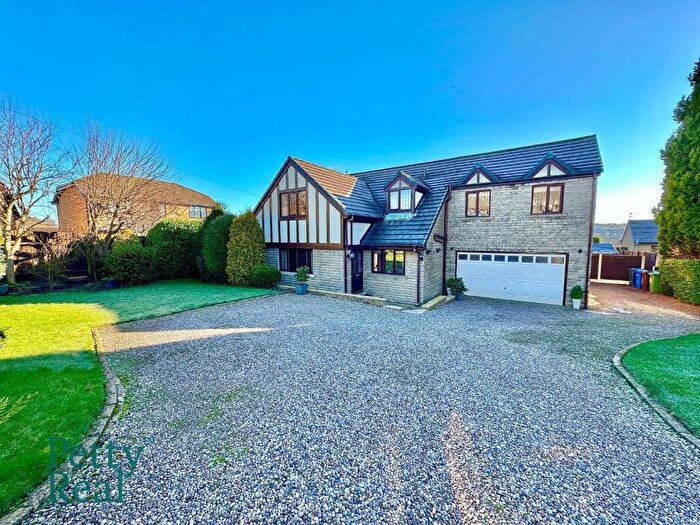
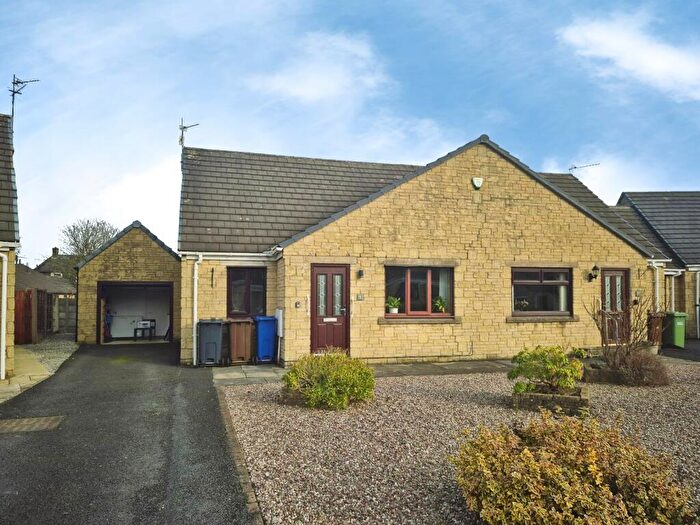
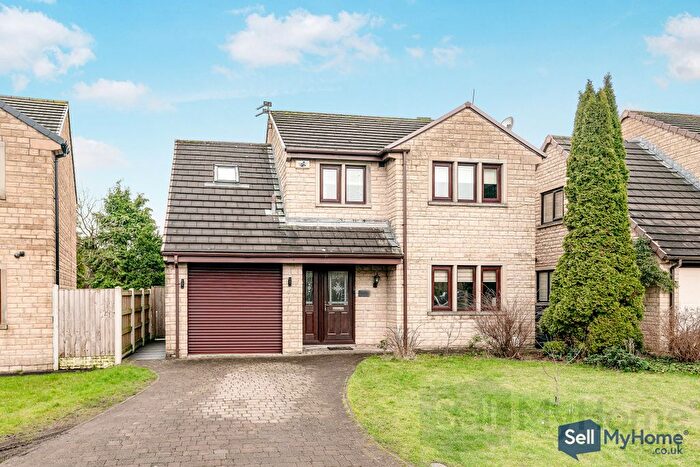
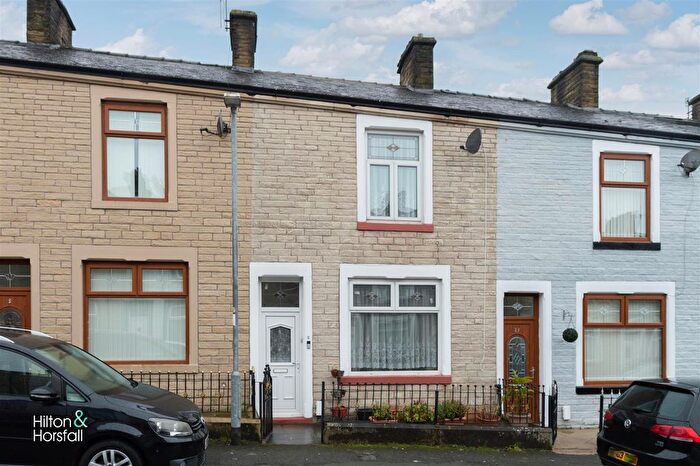
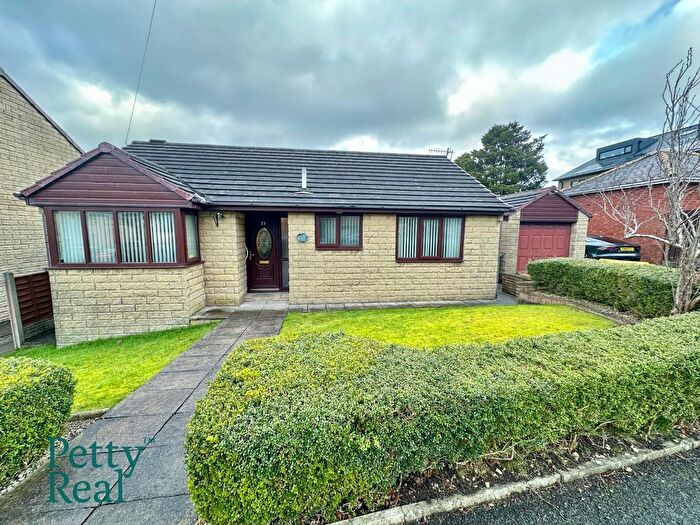
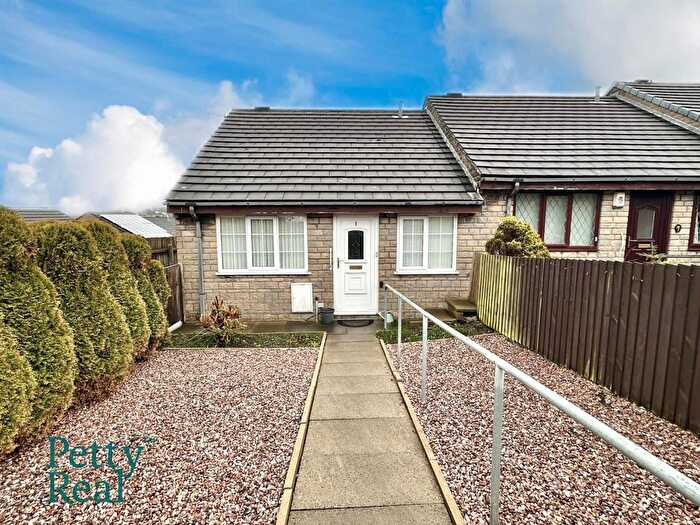
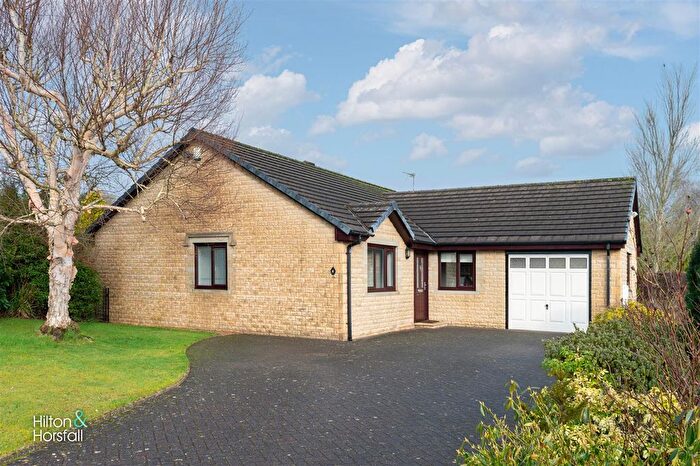
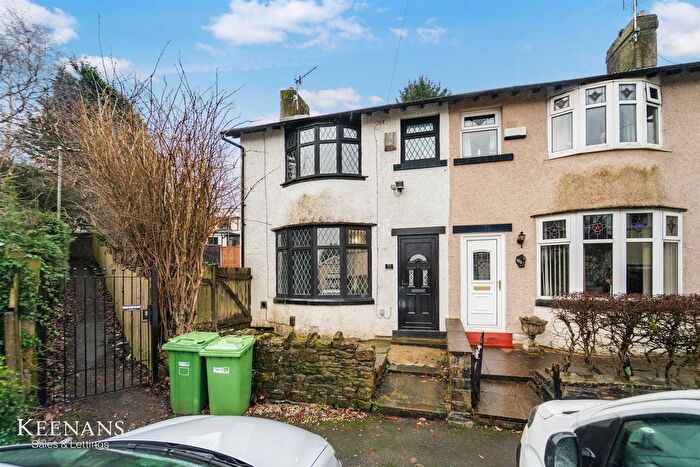
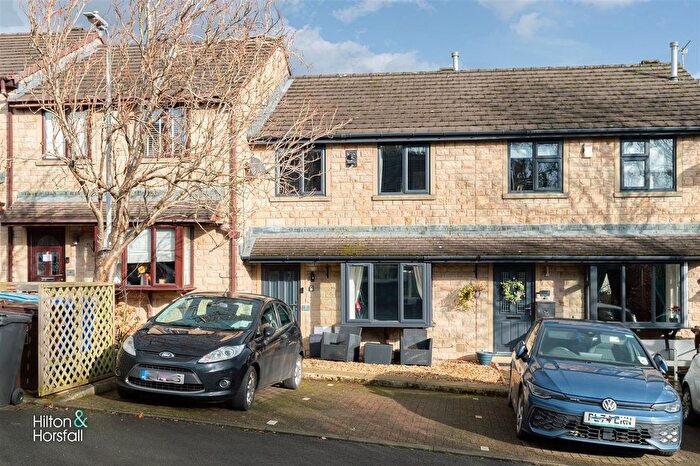
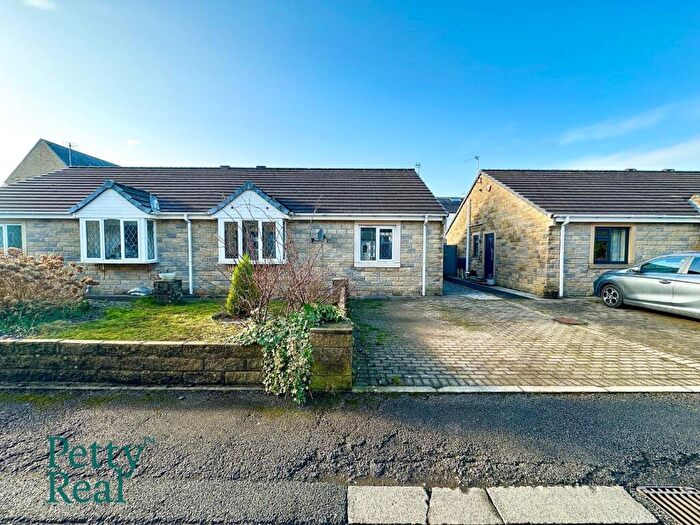
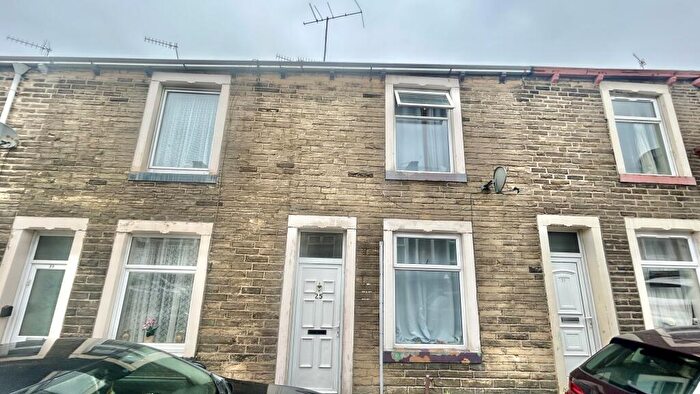
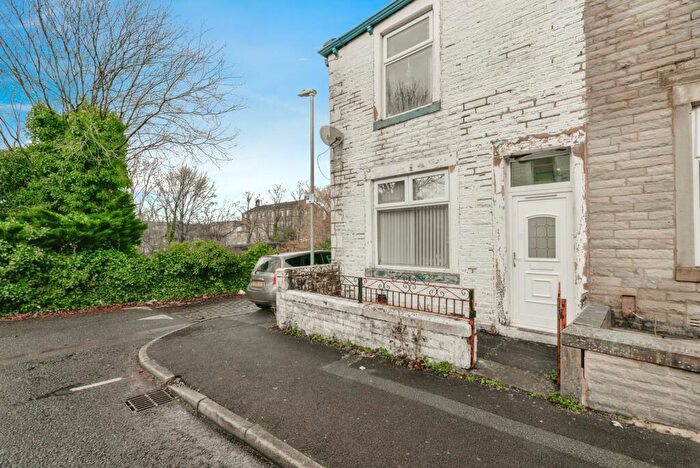
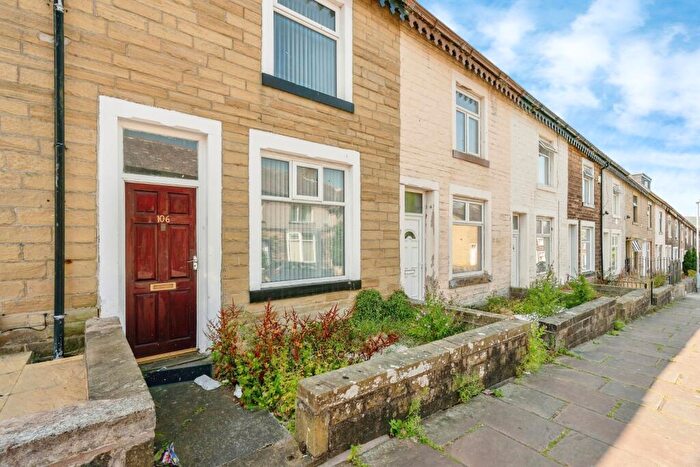
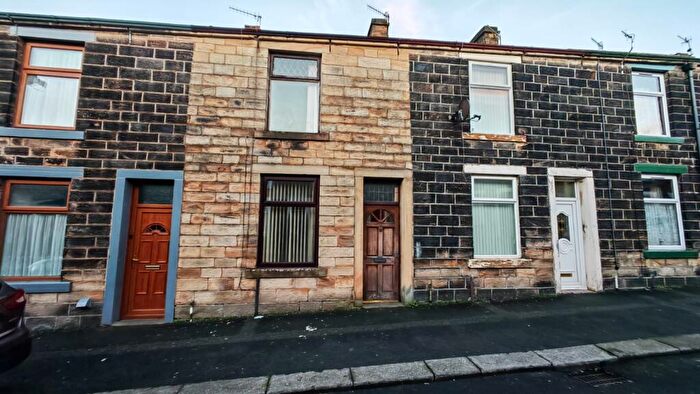
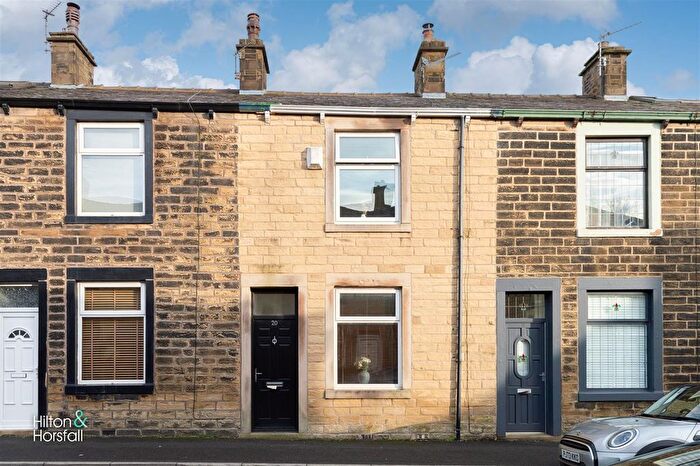
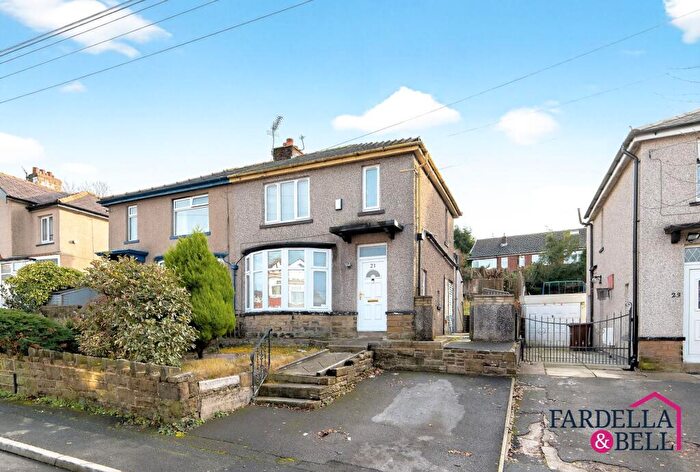
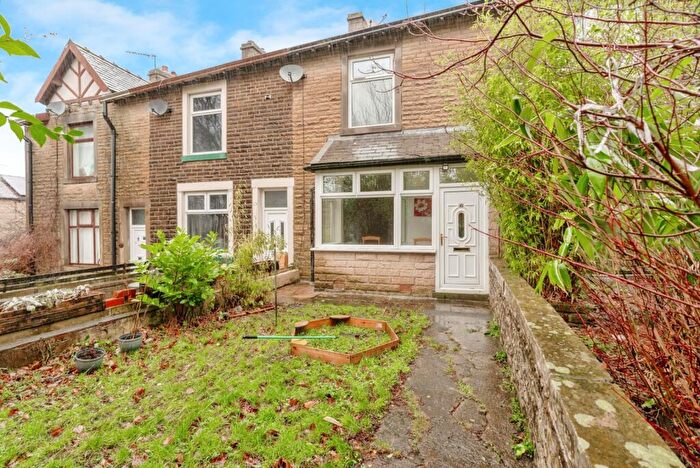
Properties for sale in Whitefield
Roads and Postcodes in Whitefield
Navigate through our locations to find the location of your next house in Whitefield, Nelson for sale or to rent.
| Streets | Postcodes |
|---|---|
| Albert Street | BB9 7EU BB9 7EY |
| Albion Street | BB9 7PT |
| Beddington Street | BB9 7TJ |
| Bishop Street | BB9 7AU |
| Bond Street | BB9 7AN |
| Buccleuch Road | BB9 7TE |
| Burlington Street | BB9 7DH |
| Calder Terrace | BB9 7BL |
| Carr Road | BB9 7JS BB9 7SP BB9 7SS BB9 7ST |
| Clayton Street | BB9 7ES BB9 7NX BB9 7PR |
| Conduit Street | BB9 7TR |
| Craven Street | BB9 7AZ |
| Cross Street | BB9 7EN |
| Dale Street | BB9 7BX |
| Dalkeith Road | BB9 7TD |
| Ecroyd Street | BB9 7BJ |
| Every Street | BB9 7AX BB9 7BS BB9 7BZ BB9 7EW BB9 7EX BB9 7HF BB9 7HG BB9 7JB BB9 7LT BB9 7LU |
| Farrer Street | BB9 7BY BB9 7DW |
| Gordon Road | BB9 7SX |
| Hargreaves Street | BB9 7BU BB9 7DB |
| Hereford Street | BB9 7JA |
| Holme Terrace | BB9 7BN |
| Kendal Street | BB9 7TW |
| Kensington Street | BB9 7DQ |
| Lime Street | BB9 7BP |
| Lomeshaye Road | BB9 7AP BB9 7AR BB9 7AS |
| Lowther Street | BB9 7TA |
| Macleod Street | BB9 7HE BB9 7HQ |
| Manchester Road | BB9 7AQ BB9 7DD BB9 7DE BB9 7DG BB9 7EG BB9 7EJ BB9 7HD BB9 7JD BB9 7SH BB9 7SJ |
| Market Square | BB9 7LP |
| Market Street | BB9 7LJ |
| Maurice Street | BB9 7HS BB9 7HT BB9 7HY |
| Merton Street | BB9 7TS |
| Milton Street | BB9 7TH BB9 7TP |
| Mosley Street | BB9 7HA |
| Norfolk Street | BB9 7TN |
| Pendle Street | BB9 7TX |
| Portland Street | BB9 7HJ |
| Prospect Buildings | BB9 7NS |
| Raglan Street | BB9 7NT |
| Rupert Street | BB9 7DN |
| Scotland Road | BB9 7UT |
| Spring Street | BB9 7DL |
| St Marys Street | BB9 7AT BB9 7AY BB9 7BA |
| Stanley Street | BB9 7EL BB9 7ET |
| Stott Street | BB9 7EP |
| Summer Street | BB9 7DJ |
| Sun Street | BB9 7BH |
| Swaine Street | BB9 7AW |
| Victoria Street | BB9 7HL BB9 7HP BB9 7HR |
| Wellington Street | BB9 7PS |
| West Street | BB9 7TL |
| Westmoreland Street | BB9 7BB BB9 7HU BB9 7HW |
| Woodside Terrace | BB9 7TB |
Transport near Whitefield
- FAQ
- Price Paid By Year
- Property Type Price
Frequently asked questions about Whitefield
What is the average price for a property for sale in Whitefield?
The average price for a property for sale in Whitefield is £92,678. This amount is 30% lower than the average price in Nelson. There are 927 property listings for sale in Whitefield.
What streets have the most expensive properties for sale in Whitefield?
The streets with the most expensive properties for sale in Whitefield are Manchester Road at an average of £201,791, Albert Street at an average of £177,500 and Mosley Street at an average of £150,000.
What streets have the most affordable properties for sale in Whitefield?
The streets with the most affordable properties for sale in Whitefield are Burlington Street at an average of £47,000, Bond Street at an average of £51,000 and Lowther Street at an average of £51,666.
Which train stations are available in or near Whitefield?
Some of the train stations available in or near Whitefield are Nelson, Brierfield and Colne.
Property Price Paid in Whitefield by Year
The average sold property price by year was:
| Year | Average Sold Price | Price Change |
Sold Properties
|
|---|---|---|---|
| 2025 | £106,499 | 3% |
29 Properties |
| 2024 | £103,447 | 28% |
38 Properties |
| 2023 | £74,268 | 6% |
44 Properties |
| 2022 | £69,445 | 8% |
47 Properties |
| 2021 | £64,011 | 13% |
31 Properties |
| 2020 | £55,651 | 9% |
23 Properties |
| 2019 | £50,483 | -4% |
37 Properties |
| 2018 | £52,661 | -5% |
43 Properties |
| 2017 | £55,367 | 4% |
36 Properties |
| 2016 | £53,319 | -2% |
34 Properties |
| 2015 | £54,161 | 6% |
36 Properties |
| 2014 | £50,645 | 1% |
35 Properties |
| 2013 | £50,176 | -4% |
33 Properties |
| 2012 | £52,287 | -4% |
44 Properties |
| 2011 | £54,121 | -24% |
39 Properties |
| 2010 | £67,323 | 11% |
34 Properties |
| 2009 | £59,597 | -42% |
37 Properties |
| 2008 | £84,629 | 22% |
46 Properties |
| 2007 | £66,052 | 19% |
114 Properties |
| 2006 | £53,484 | 21% |
125 Properties |
| 2005 | £42,372 | 35% |
136 Properties |
| 2004 | £27,734 | 14% |
156 Properties |
| 2003 | £23,831 | 18% |
116 Properties |
| 2002 | £19,471 | 1% |
129 Properties |
| 2001 | £19,334 | 1% |
120 Properties |
| 2000 | £19,045 | 3% |
78 Properties |
| 1999 | £18,386 | -2% |
44 Properties |
| 1998 | £18,733 | 5% |
58 Properties |
| 1997 | £17,775 | -6% |
43 Properties |
| 1996 | £18,777 | -13% |
49 Properties |
| 1995 | £21,199 | - |
79 Properties |
Property Price per Property Type in Whitefield
Here you can find historic sold price data in order to help with your property search.
The average Property Paid Price for specific property types in the last three years are:
| Property Type | Average Sold Price | Sold Properties |
|---|---|---|
| Detached House | £170,000.00 | 3 Detached Houses |
| Terraced House | £90,012.00 | 107 Terraced Houses |
| Semi Detached House | £146,000.00 | 1 Semi Detached House |

