Houses for sale & to rent in Brindle And Hoghton, Preston
House Prices in Brindle And Hoghton
Properties in Brindle And Hoghton have an average house price of £326,828.00 and had 44 Property Transactions within the last 3 years¹.
Brindle And Hoghton is an area in Preston, Lancashire with 503 households², where the most expensive property was sold for £715,000.00.
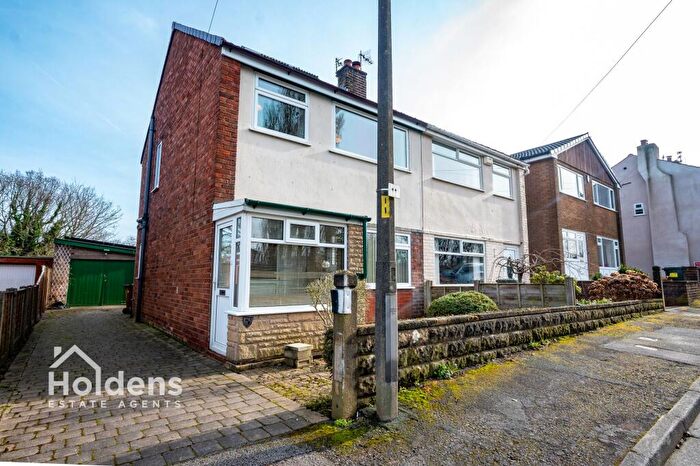
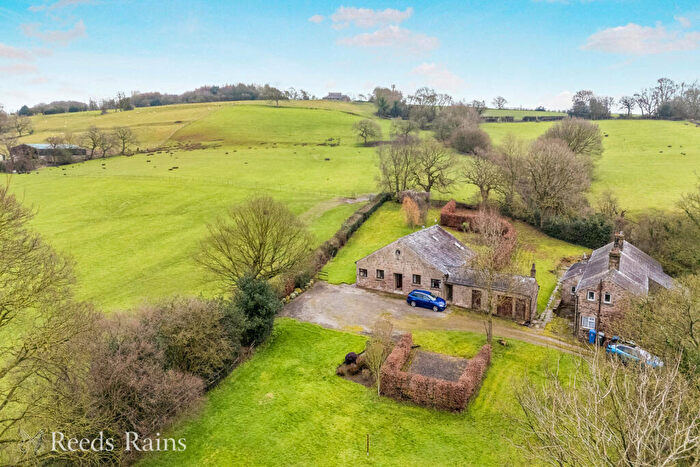
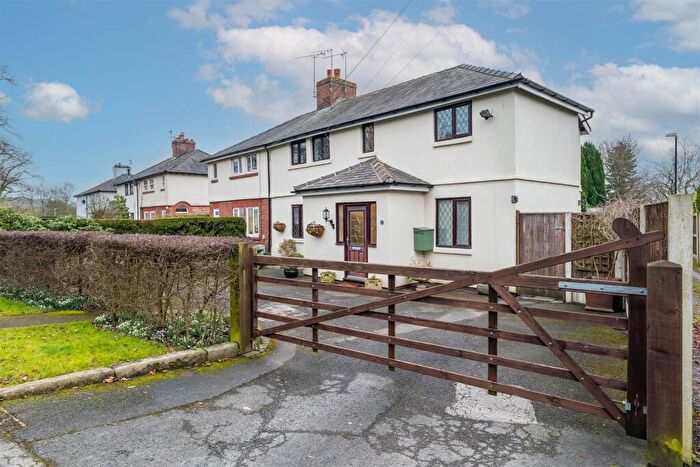
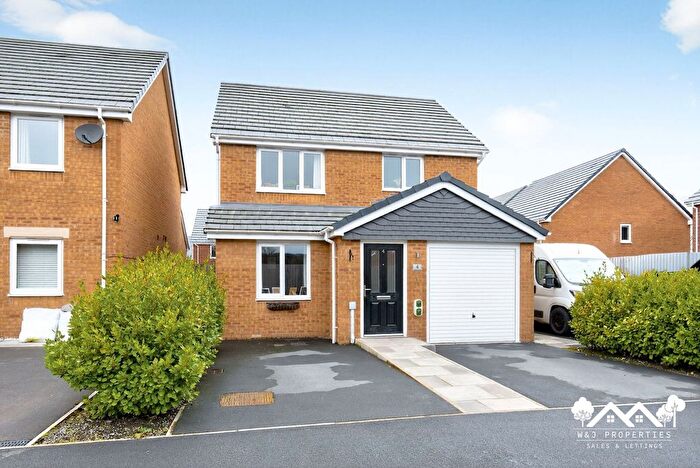
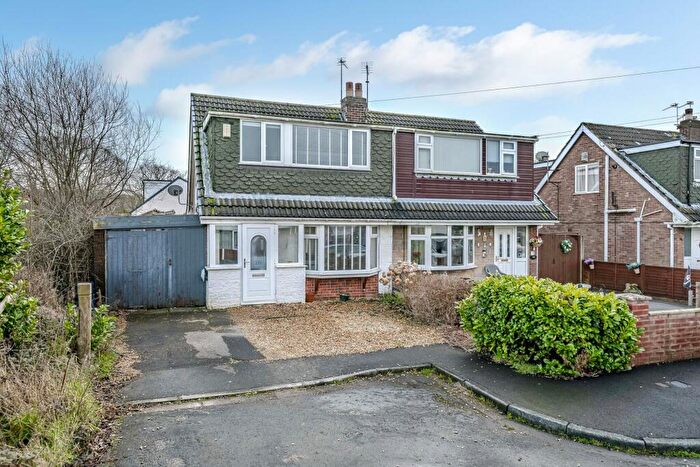
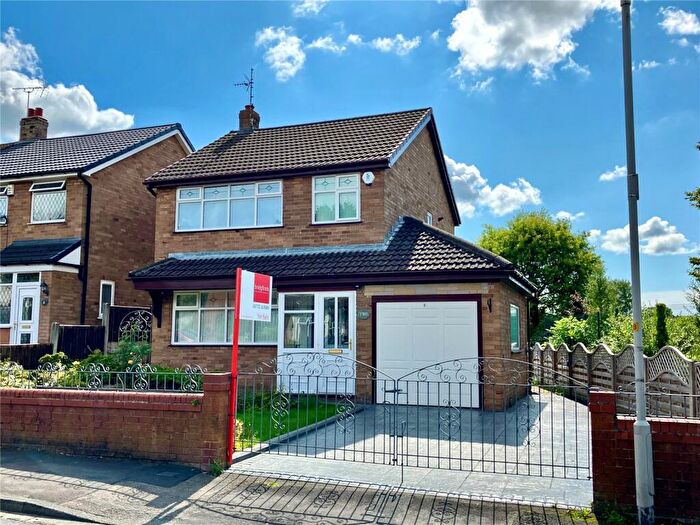
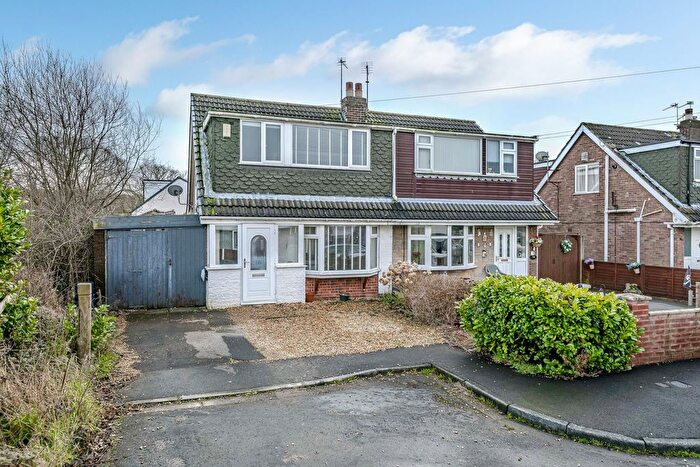
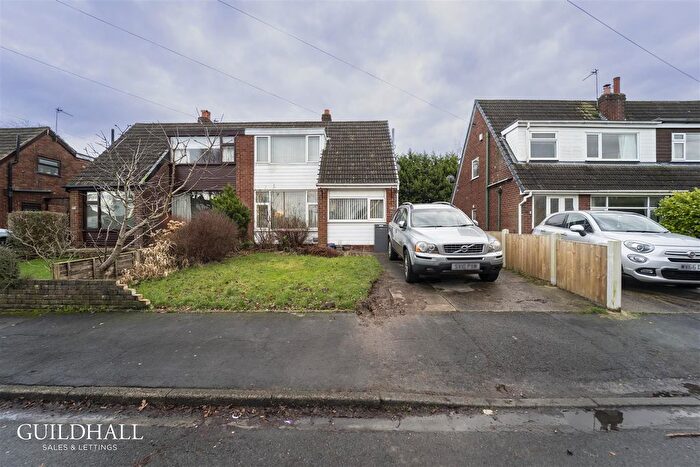
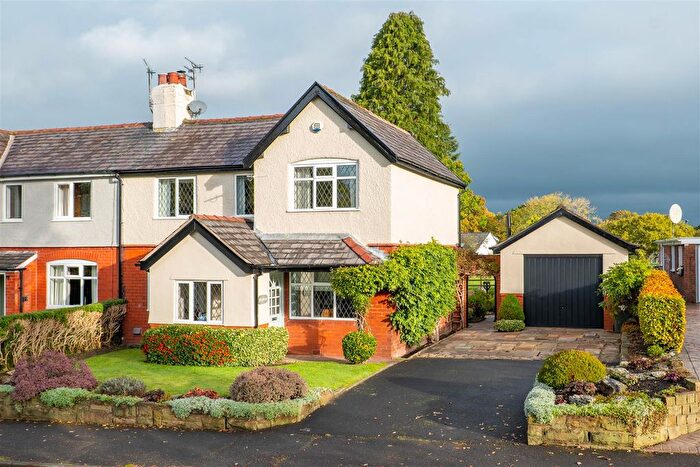
Properties for sale in Brindle And Hoghton
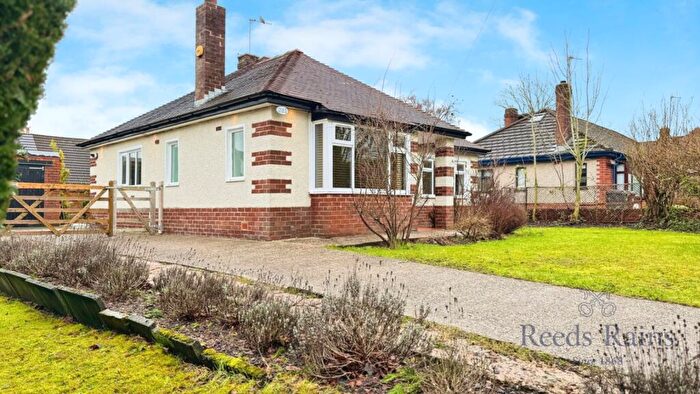
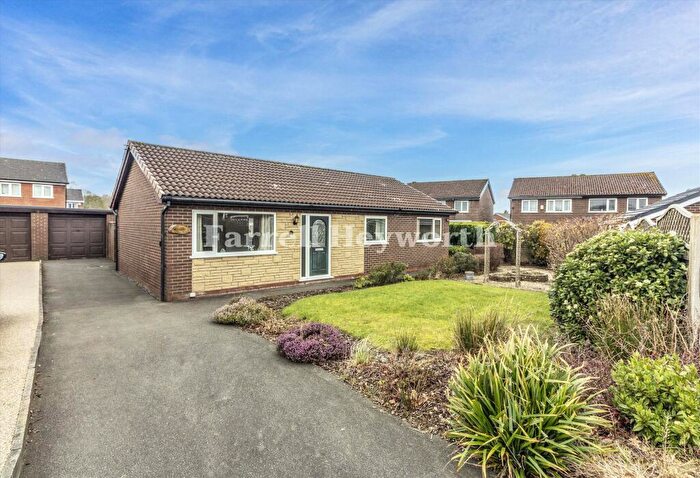
Previously listed properties in Brindle And Hoghton
Roads and Postcodes in Brindle And Hoghton
Navigate through our locations to find the location of your next house in Brindle And Hoghton, Preston for sale or to rent.
| Streets | Postcodes |
|---|---|
| Bell Villas | PR5 0RT |
| Blackburn Old Road | PR5 0SG PR5 0SJ |
| Bolton Road | PR5 0SP |
| Bournes Row | PR5 0DQ PR5 0DR |
| Bournesfield | PR5 0EH |
| Chapel Lane | PR5 0RY |
| Cripple Gate Lane | PR5 0RR |
| Fowler Close | PR5 0DS |
| Friths Court | PR5 0EF |
| Gib Lane | PR5 0RS PR5 0RU |
| Green Lane | PR5 0SN |
| Gregson Lane | PR5 0DL PR5 0ED |
| Hoghton Lane | PR5 0JD |
| Hollins Close | PR5 0RG |
| Long Barn Row | PR5 0SA |
| Private Road | PR5 0DE |
| Quaker Brook Lane | PR5 0JA |
| Riley Green | PR5 0SL |
| Rock Gardens | PR5 0DB |
| Sandy Lane | PR5 0SQ |
| Station Road | PR5 0DD |
| The Crossings | PR5 0DH |
| The Straits | PR5 0DA PR5 0JB |
| Valley Road | PR5 0SD |
| Viaduct Road | PR5 0SE |
| Willowfield Chase | PR5 0SW |
Transport near Brindle And Hoghton
-
Pleasington Station
-
Bamber Bridge Station
-
Cherry Tree Station
-
Mill Hill (Lancashire) Station
-
Lostock Hall Station
-
Leyland Station
-
Blackburn Station
-
Preston Station
- FAQ
- Price Paid By Year
- Property Type Price
Frequently asked questions about Brindle And Hoghton
What is the average price for a property for sale in Brindle And Hoghton?
The average price for a property for sale in Brindle And Hoghton is £326,828. This amount is 46% higher than the average price in Preston. There are 310 property listings for sale in Brindle And Hoghton.
What streets have the most expensive properties for sale in Brindle And Hoghton?
The streets with the most expensive properties for sale in Brindle And Hoghton are Bolton Road at an average of £715,000, Hollins Close at an average of £565,000 and Quaker Brook Lane at an average of £520,000.
What streets have the most affordable properties for sale in Brindle And Hoghton?
The streets with the most affordable properties for sale in Brindle And Hoghton are Bournes Row at an average of £173,880, Hoghton Lane at an average of £227,375 and Bournesfield at an average of £234,000.
Which train stations are available in or near Brindle And Hoghton?
Some of the train stations available in or near Brindle And Hoghton are Pleasington, Bamber Bridge and Cherry Tree.
Property Price Paid in Brindle And Hoghton by Year
The average sold property price by year was:
| Year | Average Sold Price | Price Change |
Sold Properties
|
|---|---|---|---|
| 2025 | £354,215 | 9% |
16 Properties |
| 2024 | £324,000 | 8% |
14 Properties |
| 2023 | £298,357 | -2% |
14 Properties |
| 2022 | £303,217 | 9% |
14 Properties |
| 2021 | £276,971 | -3% |
19 Properties |
| 2020 | £284,750 | 3% |
20 Properties |
| 2019 | £276,666 | -4% |
9 Properties |
| 2018 | £287,202 | 13% |
19 Properties |
| 2017 | £249,846 | -23% |
26 Properties |
| 2016 | £306,605 | 19% |
19 Properties |
| 2015 | £246,970 | -41% |
17 Properties |
| 2014 | £347,409 | 38% |
22 Properties |
| 2013 | £215,313 | 5% |
15 Properties |
| 2012 | £205,384 | -9% |
13 Properties |
| 2011 | £224,346 | -56% |
13 Properties |
| 2010 | £350,355 | 25% |
10 Properties |
| 2009 | £263,966 | -12% |
15 Properties |
| 2008 | £295,105 | 7% |
9 Properties |
| 2007 | £273,592 | 12% |
20 Properties |
| 2006 | £241,306 | 27% |
22 Properties |
| 2005 | £176,352 | -5% |
22 Properties |
| 2004 | £185,111 | 2% |
21 Properties |
| 2003 | £181,991 | 19% |
25 Properties |
| 2002 | £147,510 | 12% |
29 Properties |
| 2001 | £130,475 | 31% |
18 Properties |
| 2000 | £90,469 | 6% |
21 Properties |
| 1999 | £85,272 | -37% |
24 Properties |
| 1998 | £116,426 | 29% |
24 Properties |
| 1997 | £82,367 | -1% |
19 Properties |
| 1996 | £83,384 | 32% |
23 Properties |
| 1995 | £56,667 | - |
17 Properties |
Property Price per Property Type in Brindle And Hoghton
Here you can find historic sold price data in order to help with your property search.
The average Property Paid Price for specific property types in the last three years are:
| Property Type | Average Sold Price | Sold Properties |
|---|---|---|
| Semi Detached House | £261,130.00 | 15 Semi Detached Houses |
| Terraced House | £223,821.00 | 14 Terraced Houses |
| Detached House | £488,666.00 | 15 Detached Houses |

