
Houses for sale in Preston, Lancashire
House Prices in Preston
Properties in Preston have an average house price of £224k and had 12,842 Property Transactions within the last 3 years.¹
Preston is an area in Lancashire with 127,208 households², where the most expensive property was sold for £2.5M.
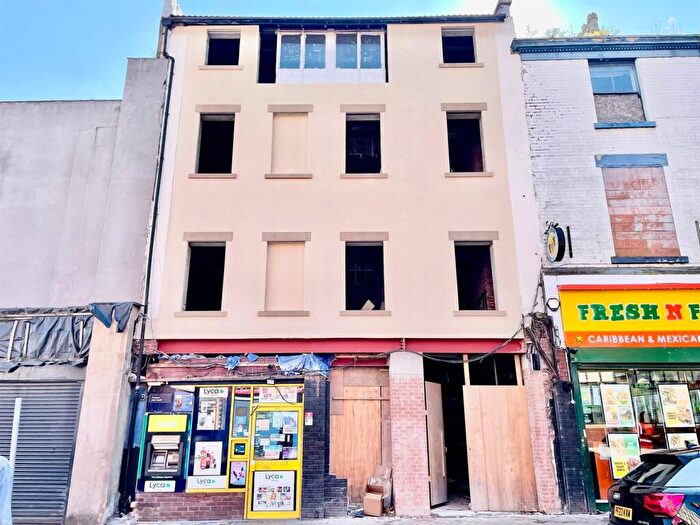
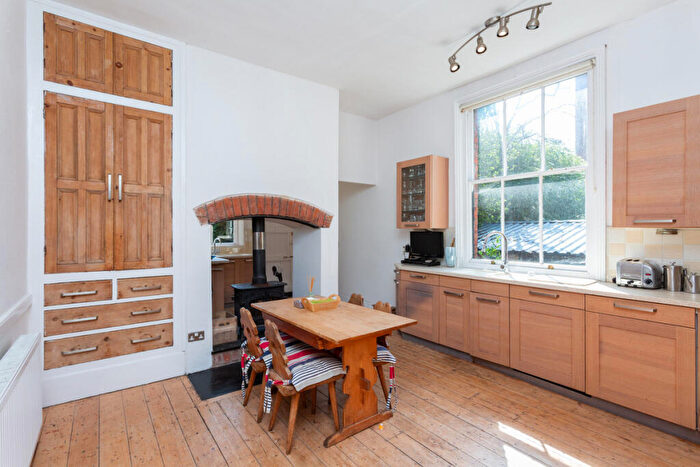
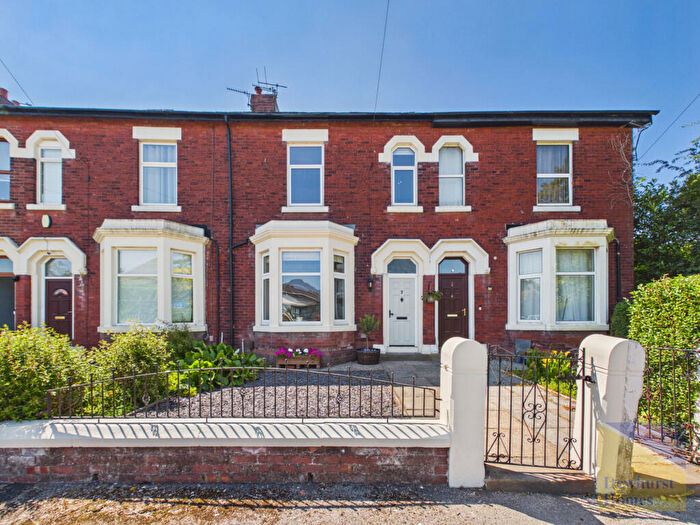
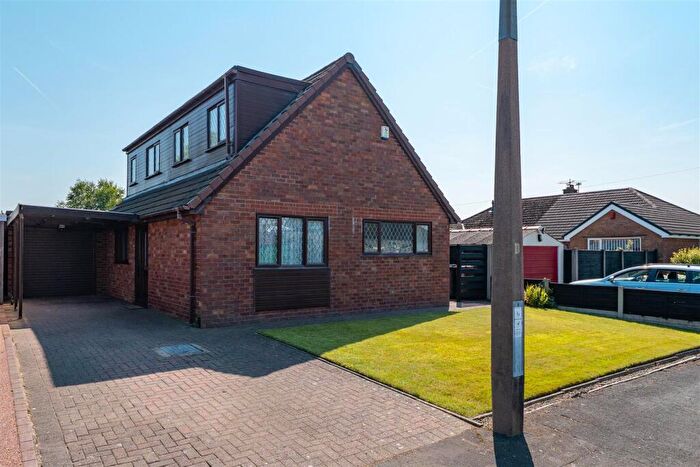
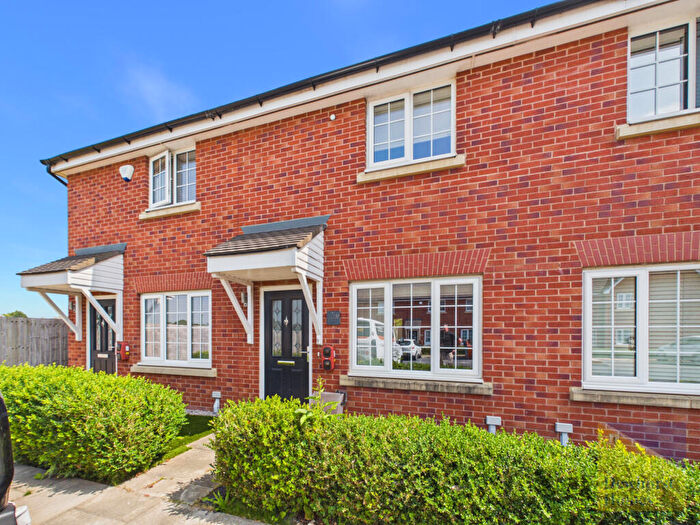
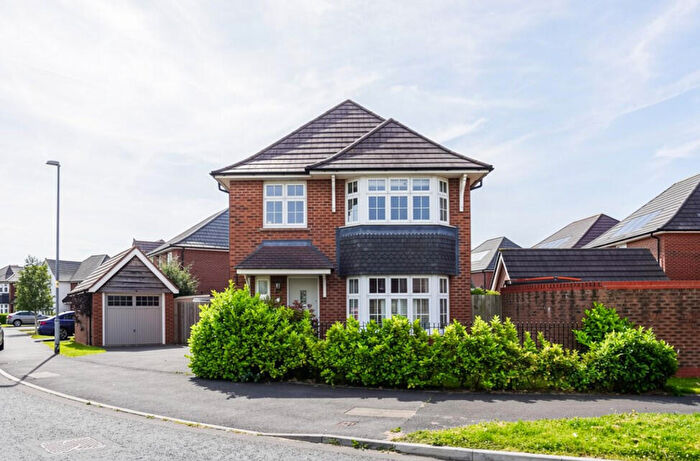
Properties for sale in Preston
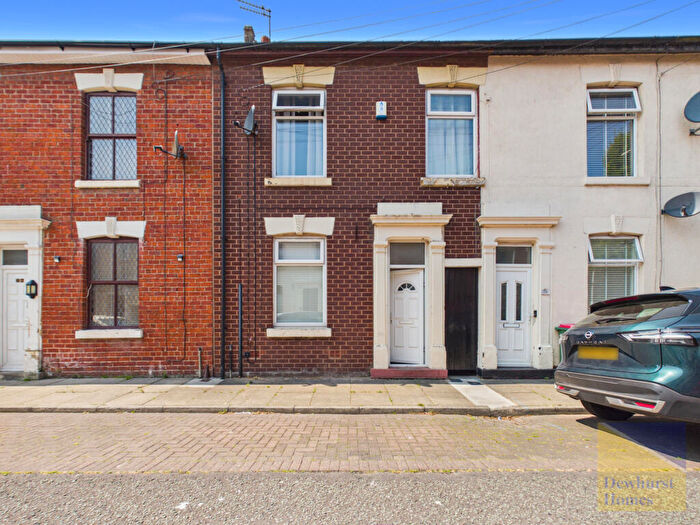
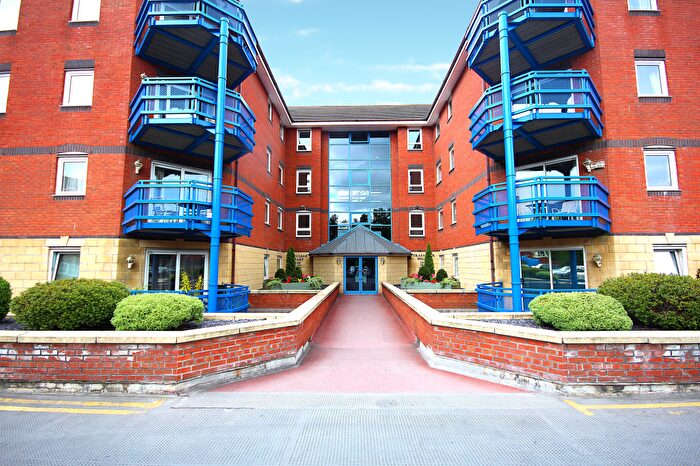
![]()
If you are looking to sell your house, let it out, or receive a property valuation, an expert can help you.
Click the button below to get started.

Neighbourhoods in Preston
Navigate through our locations to find the location of your next house in Preston, Lancashire for sale or to rent.
- Aighton, Bailey And Chaigley
- Alston And Hothersall
- Ashton
- Bamber Bridge East
- Bamber Bridge North
- Bamber Bridge West
- Brindle And Hoghton
- Broad Oak
- Brock
- Brookfield
- Cabus
- Cadley
- Calder
- Catterall
- Charnock
- Chipping
- Clayton-le-woods North
- Clayton-le-woods West And Cuerden
- College
- Coupe Green And Gregson Lane
- Deepdale
- Derby And Thornley
- Dilworth
- Ellel
- Elswick And Little Eccleston
- Farington East
- Farington West
- Fishwick
- Freckleton East
- Freckleton West
- Garrison
- Garstang
- Great Eccleston
- Greyfriars
- Hesketh-with-becconsall
- Howick And Priory
- Ingol
- Kingsfold
- Kirkham North
- Kirkham South
- Larches
- Lea
- Little Hoole And Much Hoole
- Longton And Hutton West
- Lostock
- Lostock Hall
- Medlar-with-wesham
- Middleforth
- Moor Park
- New Longton And Hutton East
- Newton And Treales
- Pilling
- Preesall
- Preston Rural East
- Preston Rural North
- Ribbleton
- Ribby-with-wrea
- Ribchester
- Riversway
- Samlesbury And Walton
- Sharoe Green
- Singleton And Greenhalgh
- St Georges
- St Matthews
- Staining And Weeton
- Tardy Gate
- Tarleton
- Town Centre
- Tulketh
- University
- Walton-le-dale
- Warton And Westby
- Whitefield
- Wyresdale
- Fishwick & Frenchwood
- Howick & Priory
- Plungington
- Walton-le-Dale West
- Lea & Larches
- Ingol & Cottam
- Brock with Catterall
- Derby & Thornley
- Alston & Hothersall
- Hurst Green & Whitewell
- Clayton-le-Dale & Salesbury
- New Longton & Hutton East
- Longton & Hutton West
- Samlesbury & Walton
- Clayton East, Brindle & Hoghton
- Walton-le-Dale East
- Clayton West & Cuerden
- Coupe Green & Gregson Lane
- City Centre
- Hoole
- Rural East Fylde
- Warton
- Wrea Green With Westby
- Kirkham
- Rural North Fylde
- Tarleton Village
- North Meols & Hesketh Bank
- Burscough Bridge & Rufford
Property price trends in Preston
According to the latest Land Registry data, the average home in Preston sold for £237,947 in 2026. That figure comes from a substantial record of 152,594 sales logged over the past 31 years.
Prices have continued to climb over the last three years. Compared with 2023, when the typical sale came in around £218,937, that's a rise of roughly 8.7%.
Looking back five years, average prices are up about 11.7% since 2021, a gain of around £24,922 in cash terms.
Zoom out to the past decade for the fuller picture. Back in 2016, homes here averaged £177,234, so the typical sold price has climbed about 34.3% since then, roughly 3% a year. Stretch the view to fifteen years and that annual pace eases back to about 2.8%.
Frequently asked questions about Preston
What is the average price for a property for sale in Preston?
The average price for a property for sale in Preston is £224,317. This amount is 7% higher than the average price in Lancashire. There are more than 10,000 property listings for sale in Preston.
What locations have the most expensive properties for sale in Preston?
The locations with the most expensive properties for sale in Preston are Clayton West & Cuerden at an average of £776,000, Aighton, Bailey And Chaigley at an average of £660,714 and New Longton & Hutton East at an average of £558,111.
What locations have the most affordable properties for sale in Preston?
The locations with the most affordable properties for sale in Preston are St Matthews at an average of £90,900, Fishwick at an average of £103,840 and Fishwick & Frenchwood at an average of £106,333.
Which train stations are available in or near Preston?
Some of the train stations available in or near Preston are Preston, Salwick and Lostock Hall.
Property Price Paid in Preston by Year
The average sold property price by year was:
| Year | Average Sold Price | Price Change |
Sold Properties
|
|---|---|---|---|
| 2026 | £237,947 | 4% |
289 Properties |
| 2025 | £228,598 | 2% |
4,156 Properties |
| 2024 | £224,276 | 2% |
4,392 Properties |
| 2023 | £218,937 | 1% |
4,005 Properties |
| 2022 | £216,064 | 1% |
5,160 Properties |
| 2021 | £213,025 | 5% |
6,095 Properties |
| 2020 | £202,327 | 6% |
4,747 Properties |
| 2019 | £190,788 | 1% |
5,265 Properties |
| 2018 | £189,637 | 4% |
5,223 Properties |
| 2017 | £181,756 | 2% |
5,139 Properties |
Property Price per Property Type in Preston
Here you can find historic sold price data in order to help with your property search.
The average Property Paid Price for specific property types in the last three years are:
| Property Type | Average Sold Price | Sold Properties |
|---|---|---|
| Semi Detached House | £210,339.00 | 4,773 Semi Detached Houses |
| Terraced House | £142,641.00 | 3,693 Terraced Houses |
| Detached House | £364,843.00 | 3,453 Detached Houses |
| Flat | £97,680.00 | 923 Flats |
Transport in Preston
Please see below transportation links in this area:
