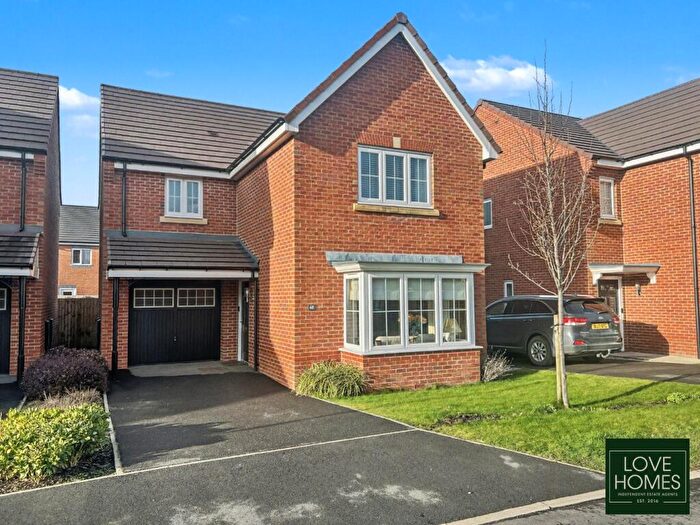
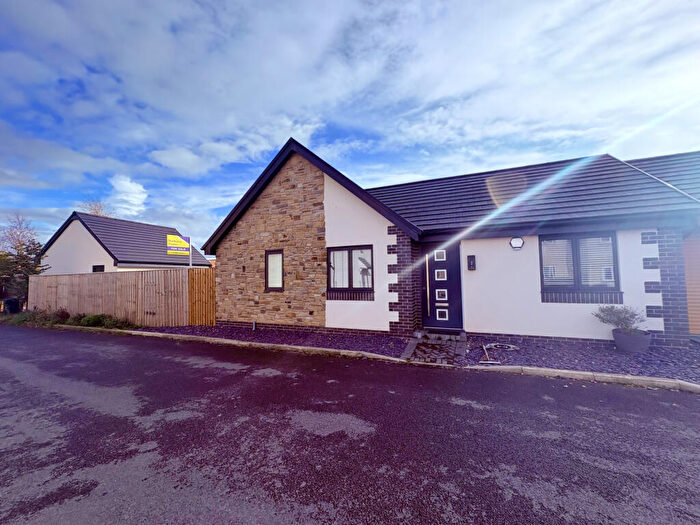
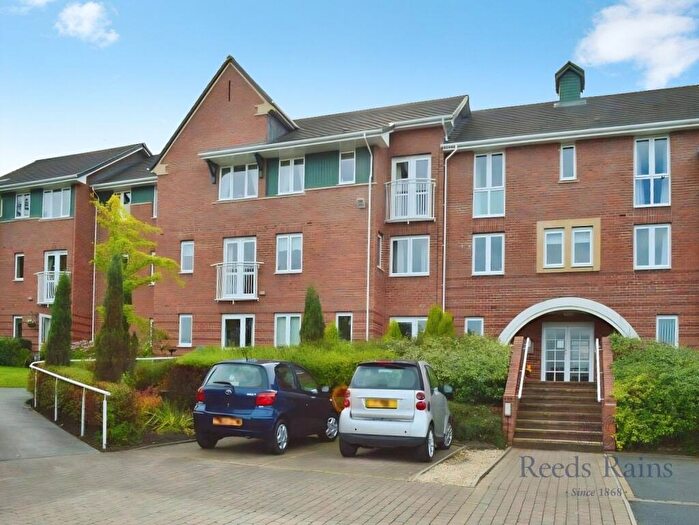
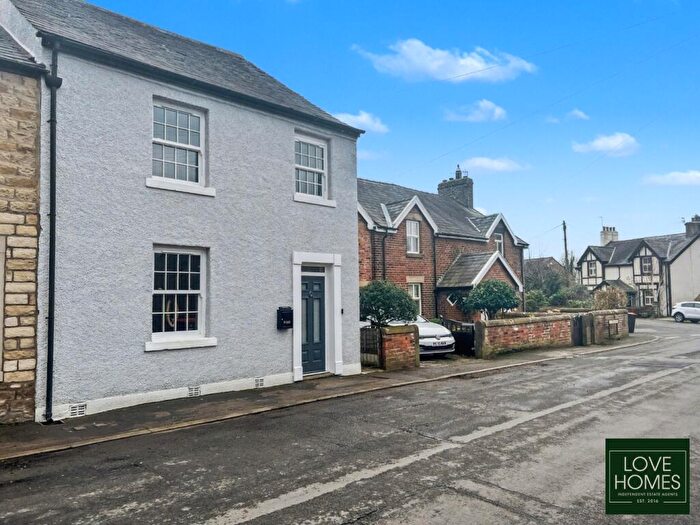
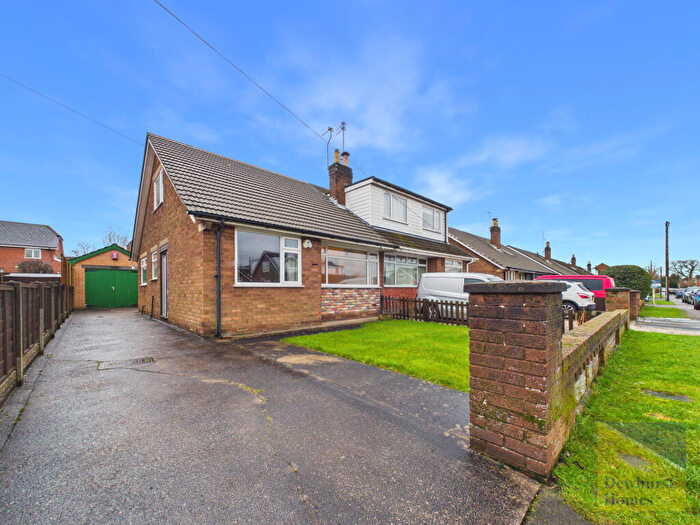
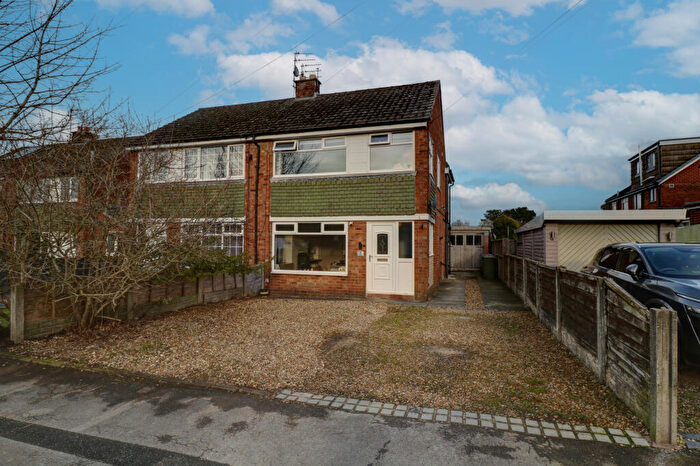
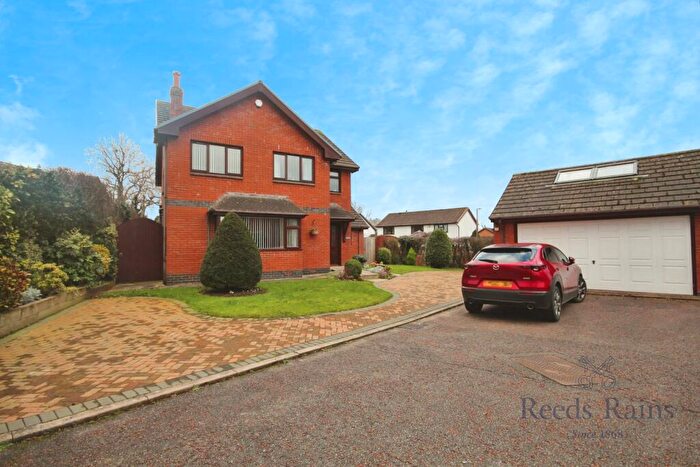
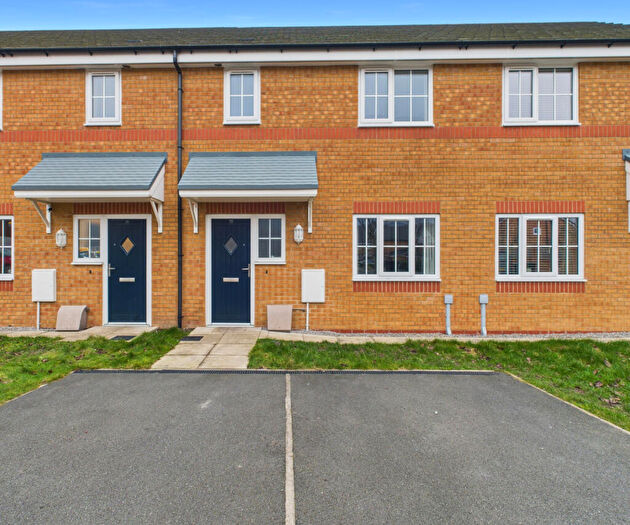
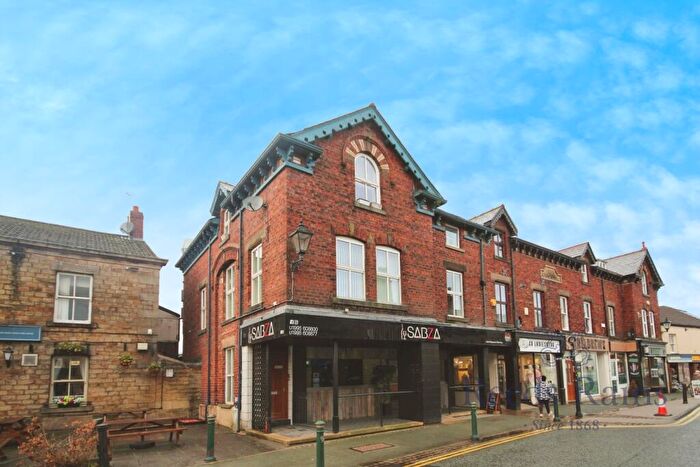
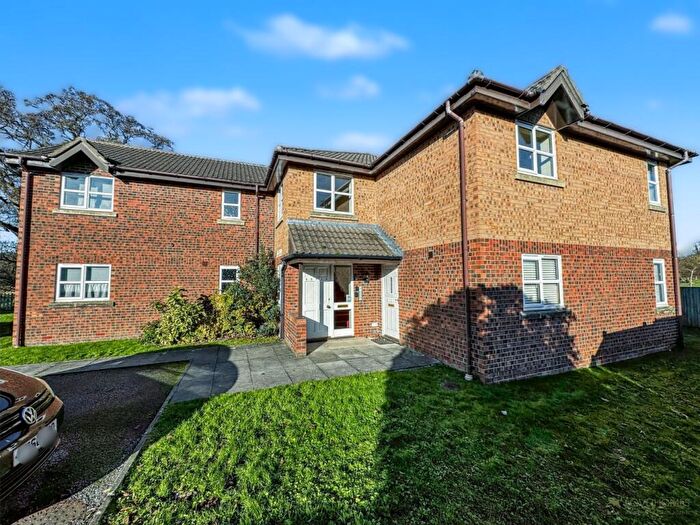
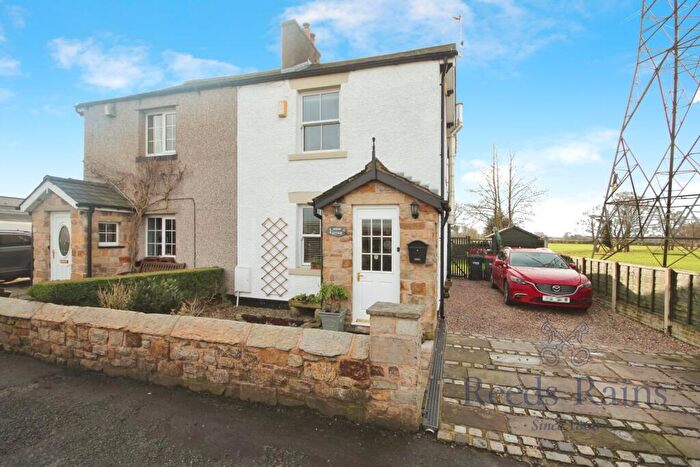
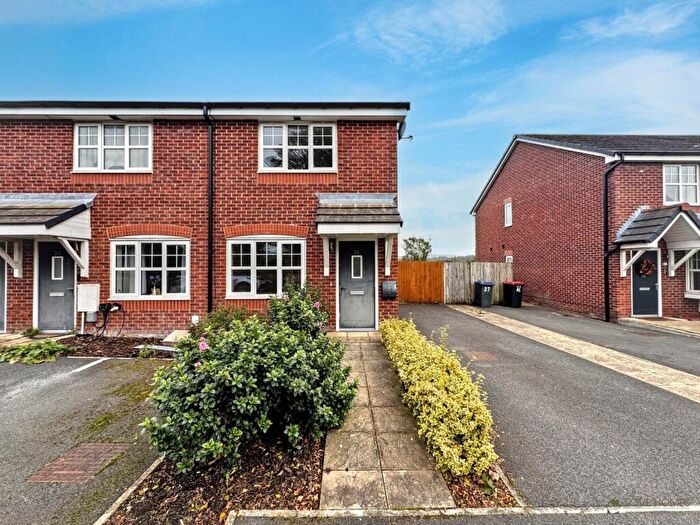
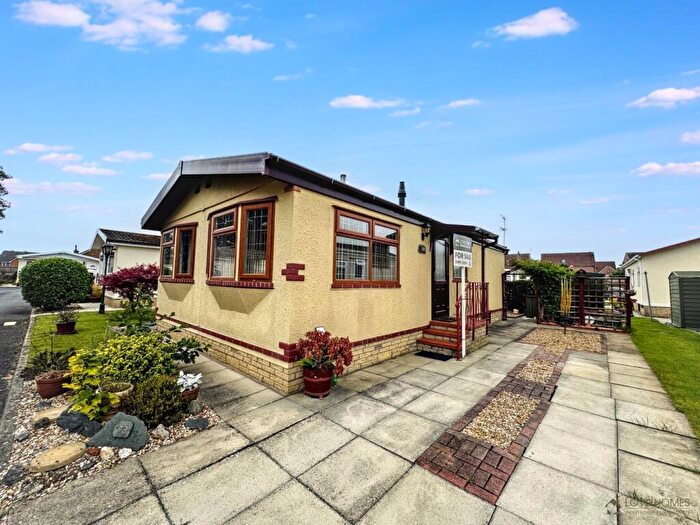
Houses for sale & to rent in Catterall, Preston
House Prices in Catterall
Properties in Catterall have an average house price of £252,904.00 and had 99 Property Transactions within the last 3 years¹.
Catterall is an area in Preston, Lancashire with 963 households², where the most expensive property was sold for £1,125,000.00.
Properties for sale in Catterall
Roads and Postcodes in Catterall
Navigate through our locations to find the location of your next house in Catterall, Preston for sale or to rent.
| Streets | Postcodes |
|---|---|
| Ainspool Lane | PR3 0HU PR3 0TA |
| Baylton Court | PR3 0FA |
| Baylton Drive | PR3 0EA |
| Boyes Avenue | PR3 0HB |
| Calder Drive | PR3 1ZL |
| Catterall Gates Lane | PR3 1YH |
| Catterall Lane | PR3 0PA PR3 0PJ PR3 0PS |
| Chapel Gardens | PR3 0HF |
| Chapelside Close | PR3 0HJ |
| Church Street | PR3 0HT |
| Cock Robin Lane | PR3 0HH PR3 1YL |
| Conway Close | PR3 0QE |
| Daniel Fold Lane | PR3 0JZ |
| Duckworth Close | PR3 1YR |
| Duckworth Drive | PR3 1YS |
| Flowerfields | PR3 1YU |
| Garstang By Pass Road | PR3 0HL PR3 0HQ PR3 0QA |
| Garstang Road | PR3 0HD PR3 1XN |
| Goldfinch Drive | PR3 1NW PR3 1TR |
| Greenways | PR3 0QP |
| Greenwood | PR3 0LF |
| Hamers Wood Drive | PR3 1YN PR3 1ZN |
| Higher Moorfield | PR3 0LG |
| Hollies Close | PR3 0LR |
| Humblescough Lane | PR3 0LL |
| Keepers Wood Way | PR3 1TP |
| Kinsacre | PR3 0LQ |
| Meadowcroft Avenue | PR3 1ZH |
| Milford Close | PR3 0GE |
| Mill Brook | PR3 1XR |
| Newhaven Drive | PR3 0GD |
| Nightingale Way | PR3 1PZ PR3 1TQ |
| Nook Lane | PR3 0HZ |
| Old Lancaster Road | PR3 0HN |
| Parkers Fold | PR3 0JW |
| Pincroft Close | PR3 1NX PR3 1NY |
| Prospect Court | PR3 0QW |
| St Helens Close | PR3 0HY |
| Stone Cross Gardens | PR3 1YQ |
| Stones Lane | PR3 0HA |
| Tarnacre Lane | PR3 0TB |
| The Avenue | PR3 0HR PR3 0HX |
| The Green | PR3 0HS |
| The Parklands | PR3 1YT |
| Thornbank Drive | PR3 1YP |
| Toulmin Close | PR3 0EX |
| Vicarage Lane | PR3 0HW |
| Westfield Court | PR3 1FG |
| Whitewell Close | PR3 1XQ |
Transport near Catterall
- FAQ
- Price Paid By Year
- Property Type Price
Frequently asked questions about Catterall
What is the average price for a property for sale in Catterall?
The average price for a property for sale in Catterall is £252,904. This amount is 13% higher than the average price in Preston. There are 724 property listings for sale in Catterall.
What streets have the most expensive properties for sale in Catterall?
The streets with the most expensive properties for sale in Catterall are The Avenue at an average of £546,666, Catterall Lane at an average of £532,500 and Church Street at an average of £522,500.
What streets have the most affordable properties for sale in Catterall?
The streets with the most affordable properties for sale in Catterall are Mill Brook at an average of £112,500, Chapelside Close at an average of £132,000 and Hollies Close at an average of £145,000.
Which train stations are available in or near Catterall?
Some of the train stations available in or near Catterall are Salwick, Kirkham and Wesham and Preston.
Property Price Paid in Catterall by Year
The average sold property price by year was:
| Year | Average Sold Price | Price Change |
Sold Properties
|
|---|---|---|---|
| 2025 | £268,406 | 4% |
32 Properties |
| 2024 | £258,816 | 12% |
38 Properties |
| 2023 | £228,051 | -22% |
29 Properties |
| 2022 | £278,858 | 12% |
46 Properties |
| 2021 | £244,935 | 15% |
65 Properties |
| 2020 | £208,767 | -1% |
40 Properties |
| 2019 | £210,261 | -12% |
64 Properties |
| 2018 | £235,881 | 10% |
40 Properties |
| 2017 | £213,112 | 7% |
33 Properties |
| 2016 | £198,985 | -10% |
50 Properties |
| 2015 | £219,551 | 12% |
34 Properties |
| 2014 | £193,625 | -11% |
71 Properties |
| 2013 | £214,694 | 7% |
35 Properties |
| 2012 | £200,483 | 11% |
37 Properties |
| 2011 | £179,043 | -17% |
31 Properties |
| 2010 | £209,135 | 7% |
35 Properties |
| 2009 | £195,528 | -40% |
71 Properties |
| 2008 | £274,362 | 19% |
29 Properties |
| 2007 | £222,855 | 6% |
61 Properties |
| 2006 | £210,123 | 8% |
69 Properties |
| 2005 | £194,071 | 12% |
56 Properties |
| 2004 | £171,611 | 19% |
30 Properties |
| 2003 | £139,712 | 3% |
39 Properties |
| 2002 | £135,611 | 30% |
52 Properties |
| 2001 | £94,800 | 2% |
46 Properties |
| 2000 | £93,368 | -6% |
47 Properties |
| 1999 | £99,393 | 28% |
67 Properties |
| 1998 | £71,207 | -2% |
50 Properties |
| 1997 | £72,378 | -8% |
53 Properties |
| 1996 | £77,839 | 16% |
52 Properties |
| 1995 | £65,079 | - |
64 Properties |
Property Price per Property Type in Catterall
Here you can find historic sold price data in order to help with your property search.
The average Property Paid Price for specific property types in the last three years are:
| Property Type | Average Sold Price | Sold Properties |
|---|---|---|
| Semi Detached House | £235,358.00 | 39 Semi Detached Houses |
| Detached House | £342,677.00 | 31 Detached Houses |
| Terraced House | £210,546.00 | 21 Terraced Houses |
| Flat | £101,756.00 | 8 Flats |

