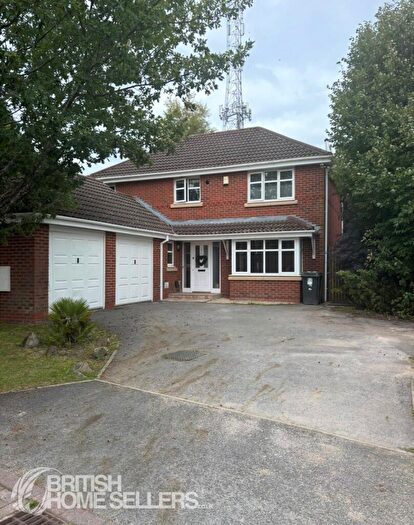
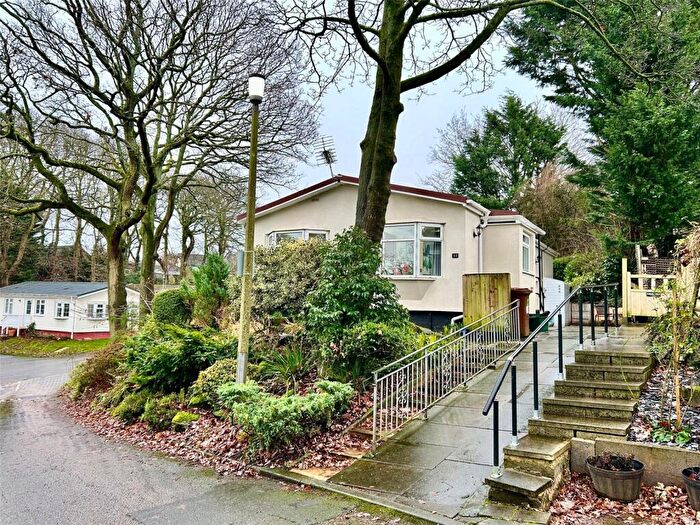
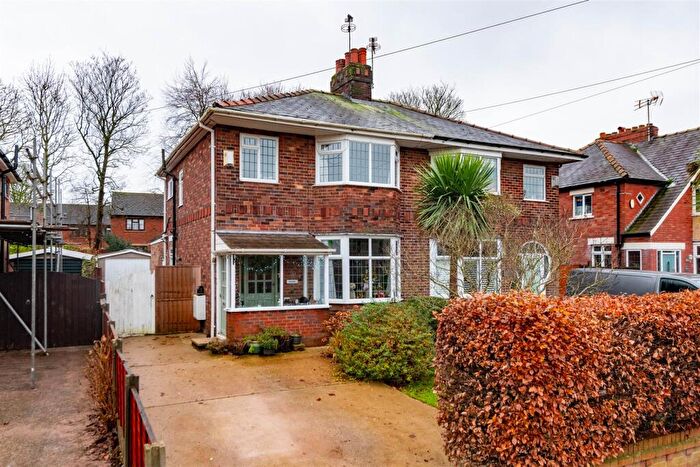
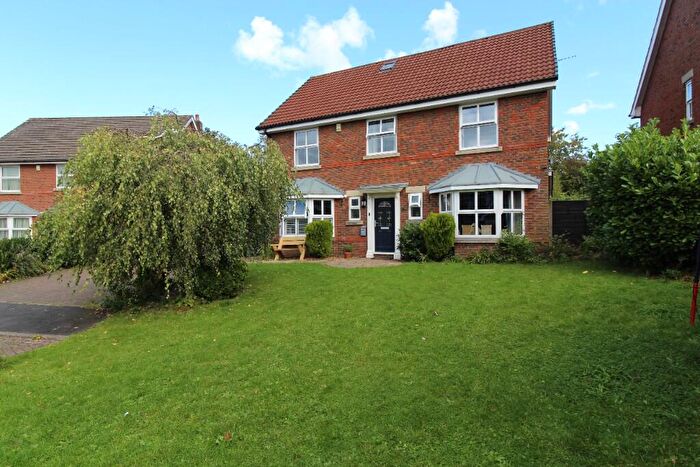
Houses for sale & to rent in Charnock, Preston
House Prices in Charnock
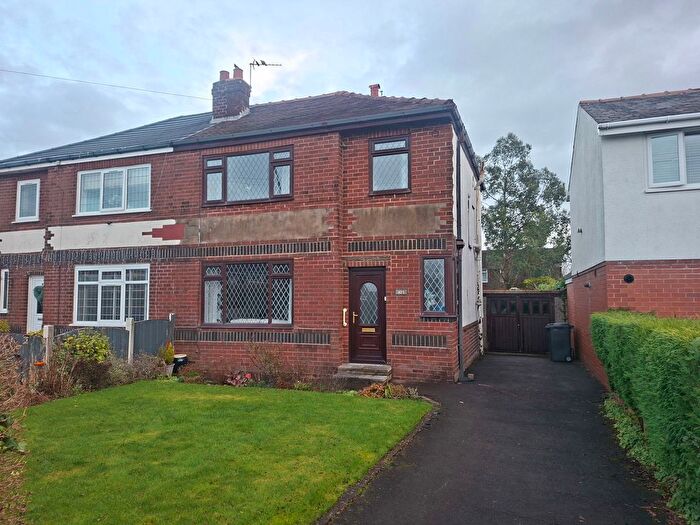
Properties in Charnock have an average house price of £182,038.00 and had 172 Property Transactions within the last 3 years¹.
Charnock is an area in Preston, Lancashire with 1,539 households², where the most expensive property was sold for £600,000.00.
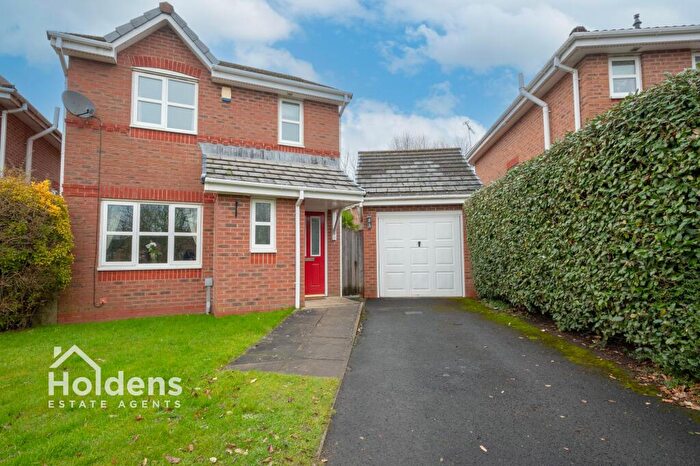
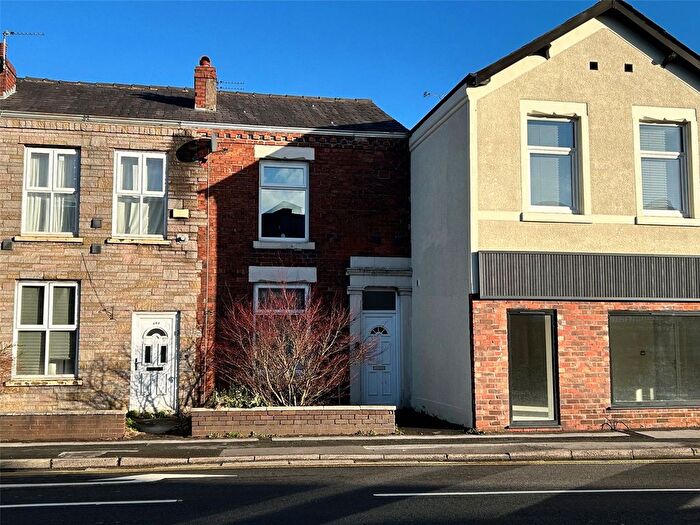
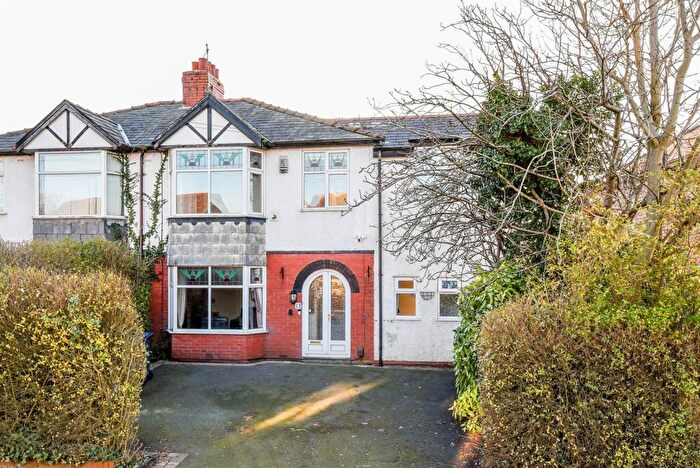
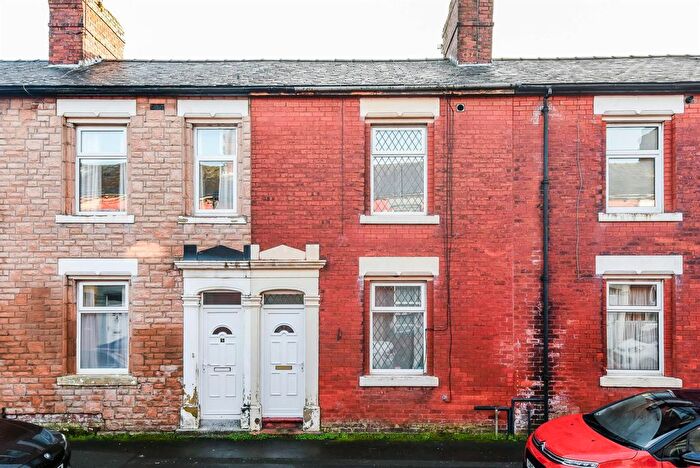
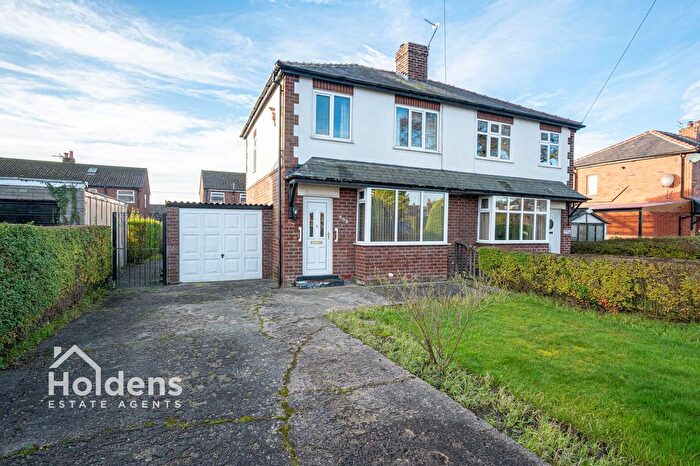
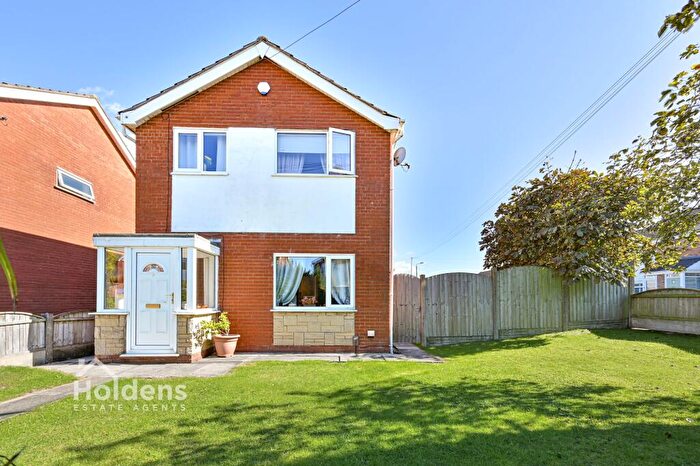
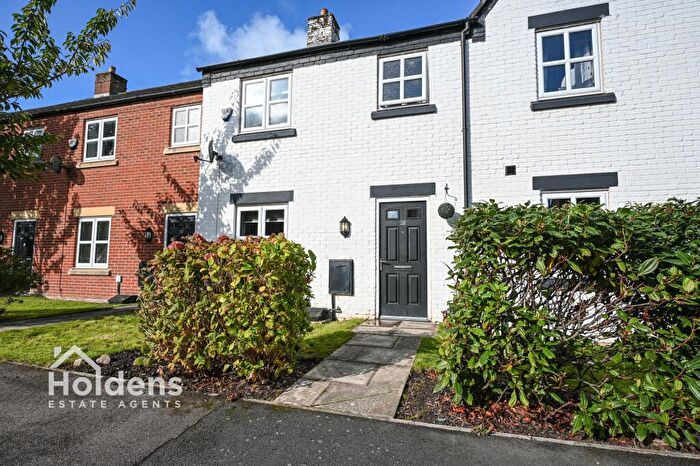
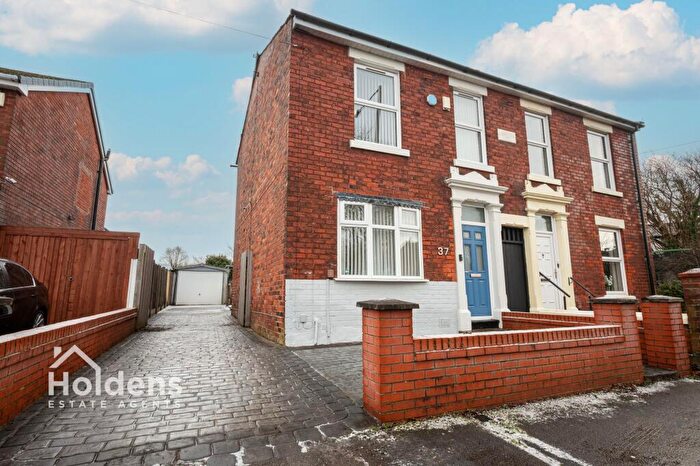
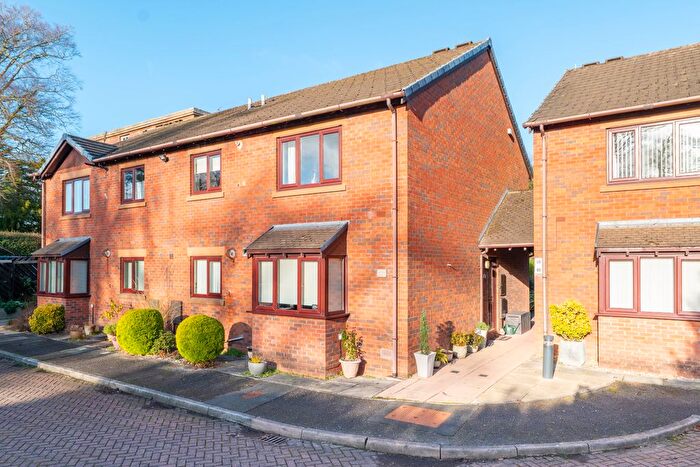
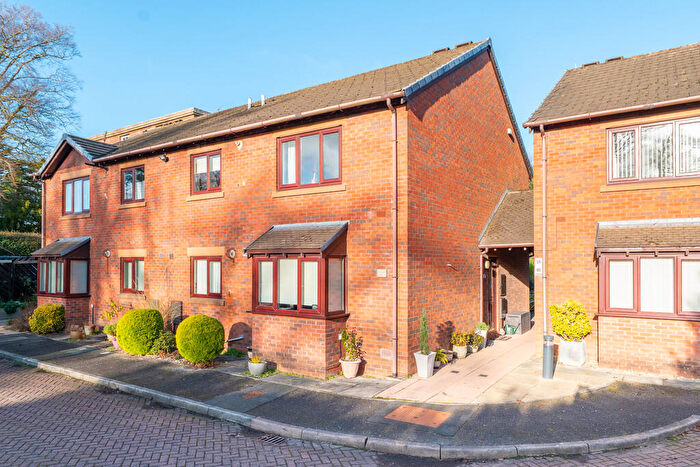
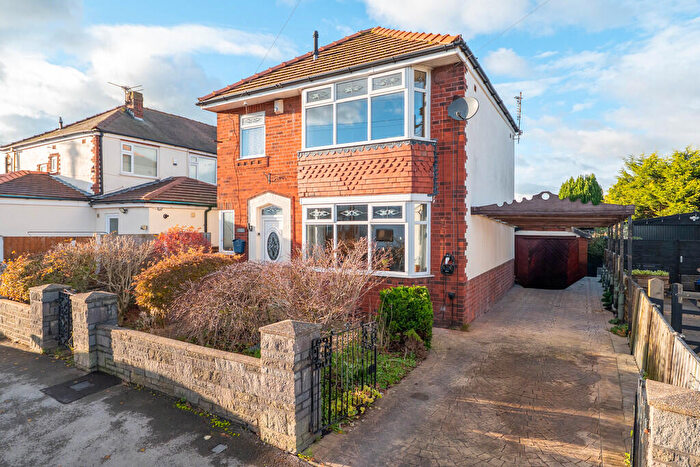
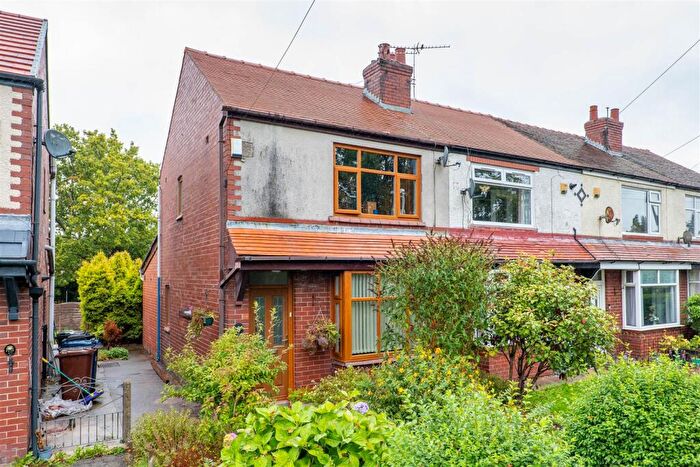
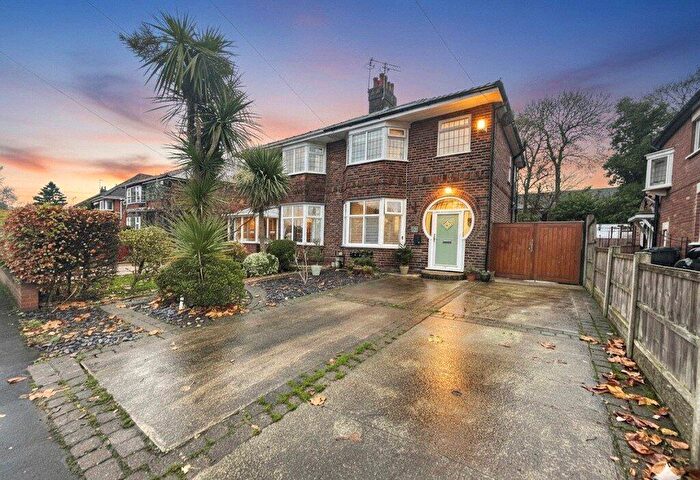
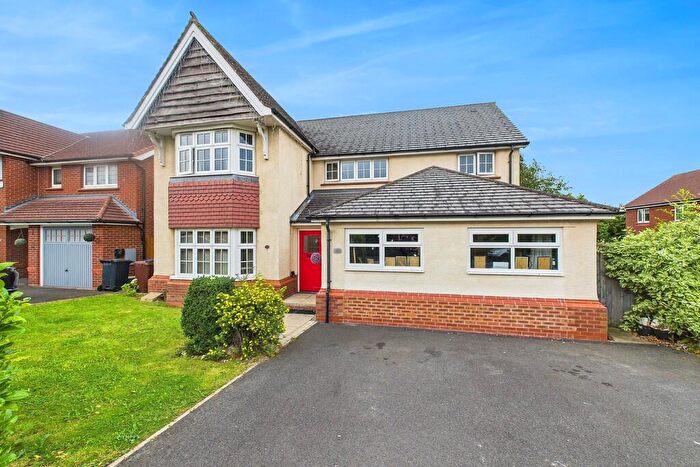
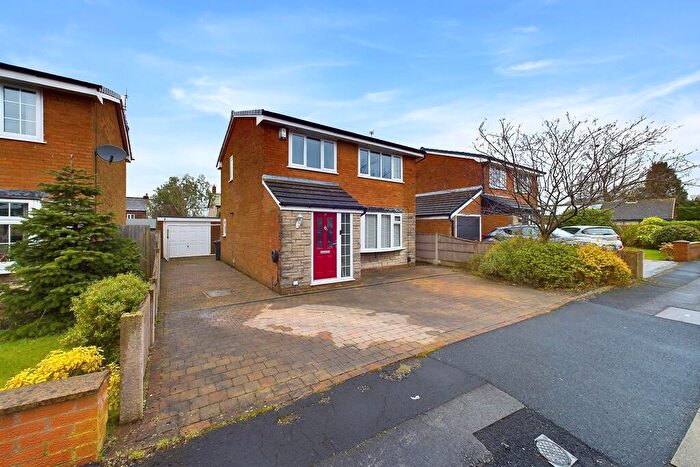
Properties for sale in Charnock
Roads and Postcodes in Charnock
Navigate through our locations to find the location of your next house in Charnock, Preston for sale or to rent.
| Streets | Postcodes |
|---|---|
| Aldwyn Court | PR1 9RZ |
| Bee Lane | PR1 9TT PR1 9TU |
| Belle Field Close | PR1 9SD |
| Bilsborough Hey | PR1 9UQ |
| Braintree Avenue | PR1 9UN |
| Bramble Court | PR1 9EW |
| Bridge Close | PR5 5UB |
| Broadmeadow | PR5 5SF |
| Burwood Close | PR1 9LE |
| Castle Fold | PR1 9TL |
| Charnock Court | PR1 9WD |
| Charnock Gardens | PR1 9PG |
| Chelford Close | PR1 9LH |
| Conway Avenue | PR1 9TR |
| Coote Lane | PR5 5JB |
| Cromwell Way | PR1 9SB |
| Dickensons Field | PR1 9ES |
| Eavesham Close | PR1 9SF |
| Far Croft | PR5 5SS |
| Fir Trees Avenue | PR5 5SH PR5 5SJ PR5 5SY |
| Fir Trees Court | PR5 5SW |
| Fir Trees Crescent | PR5 5SL |
| Fir Trees Road | PR5 5SN |
| Fitchfield | PR1 9UE |
| Flag Lane | PR1 9TQ PR1 9TP |
| Garden Lane | PR1 9AF |
| Giller Close | PR1 9NA |
| Giller Drive | PR1 9LT |
| Giller Fold | PR1 9LS |
| Greaves Meadow | PR1 9UL |
| Green Meadow Close | PR1 9LW |
| Half Acre | PR5 5SG |
| Hambleton Drive | PR1 9US |
| Handshaw Drive | PR1 9SG |
| Harold Terrace | PR5 5SE |
| Kingsbridge Close | PR1 9UR |
| Kingsfold Drive | PR1 9EQ PR1 9PE |
| Kingshaven Drive | PR1 9BS |
| Leyland Road | PR1 9SR PR1 9SS PR1 9ST PR1 9SU PR1 9SX PR1 9SY PR1 9TA PR5 5RY PR5 5SA PR5 5SB PR5 5SD |
| Lilac Avenue | PR1 9PB |
| Lords Lane | PR1 9UA |
| Marina Close | PR5 5ST |
| Marina Grove | PR5 5SQ PR5 5SR PR1 9TN |
| Mark Close | PR1 9YR |
| Meadowfield | PR1 9ER |
| Moss Lane | PR1 9TX |
| Nib Lane | PR1 9TW |
| Northleach Avenue | PR1 9UF |
| Orchard Croft | PR5 5SP |
| Queenscourt Avenue | PR1 9BT |
| Rookery Close | PR1 9LX |
| Rookery Drive | PR1 9LU |
| Round Acre | PR1 9UB |
| Saxon Place | PR1 9RW |
| Sibley Drive | PR1 9RY |
| Spring Gardens | PR1 9LY |
| Studholme Close | PR1 9NB |
| Studholme Crescent | PR1 9NE PR1 9NH |
| Sturminster Close | PR1 9UP |
| Sumpter Croft | PR1 9UJ |
| The Cawsey | PR1 9RG |
| The Paddock | PR1 9EP |
| Werneth Close | PR1 9TS |
| Winslow Close | PR1 9UH |
Transport near Charnock
- FAQ
- Price Paid By Year
- Property Type Price
Frequently asked questions about Charnock
What is the average price for a property for sale in Charnock?
The average price for a property for sale in Charnock is £182,038. This amount is 18% lower than the average price in Preston. There are 866 property listings for sale in Charnock.
What streets have the most expensive properties for sale in Charnock?
The streets with the most expensive properties for sale in Charnock are The Cawsey at an average of £600,000, Bee Lane at an average of £392,000 and Cromwell Way at an average of £388,333.
What streets have the most affordable properties for sale in Charnock?
The streets with the most affordable properties for sale in Charnock are Handshaw Drive at an average of £94,000, Harold Terrace at an average of £102,500 and Queenscourt Avenue at an average of £107,000.
Which train stations are available in or near Charnock?
Some of the train stations available in or near Charnock are Lostock Hall, Bamber Bridge and Preston.
Property Price Paid in Charnock by Year
The average sold property price by year was:
| Year | Average Sold Price | Price Change |
Sold Properties
|
|---|---|---|---|
| 2025 | £187,494 | 4% |
42 Properties |
| 2024 | £179,257 | -1% |
58 Properties |
| 2023 | £181,095 | 0,3% |
72 Properties |
| 2022 | £180,487 | 9% |
60 Properties |
| 2021 | £164,627 | 9% |
74 Properties |
| 2020 | £149,111 | 2% |
45 Properties |
| 2019 | £145,544 | -13% |
52 Properties |
| 2018 | £164,054 | 9% |
67 Properties |
| 2017 | £149,383 | -13% |
56 Properties |
| 2016 | £168,144 | -1% |
82 Properties |
| 2015 | £169,950 | 20% |
77 Properties |
| 2014 | £135,645 | 11% |
68 Properties |
| 2013 | £120,957 | -3% |
38 Properties |
| 2012 | £124,658 | -5% |
42 Properties |
| 2011 | £130,770 | -6% |
38 Properties |
| 2010 | £137,979 | -3% |
42 Properties |
| 2009 | £142,317 | 3% |
40 Properties |
| 2008 | £138,619 | -4% |
39 Properties |
| 2007 | £144,692 | 6% |
90 Properties |
| 2006 | £135,810 | -11% |
81 Properties |
| 2005 | £151,180 | 10% |
91 Properties |
| 2004 | £136,591 | 36% |
134 Properties |
| 2003 | £87,118 | 7% |
80 Properties |
| 2002 | £80,948 | 27% |
95 Properties |
| 2001 | £58,737 | -2% |
67 Properties |
| 2000 | £59,924 | 17% |
68 Properties |
| 1999 | £49,823 | -0,3% |
69 Properties |
| 1998 | £49,966 | 3% |
60 Properties |
| 1997 | £48,708 | 6% |
79 Properties |
| 1996 | £46,002 | 2% |
44 Properties |
| 1995 | £45,156 | - |
76 Properties |
Property Price per Property Type in Charnock
Here you can find historic sold price data in order to help with your property search.
The average Property Paid Price for specific property types in the last three years are:
| Property Type | Average Sold Price | Sold Properties |
|---|---|---|
| Semi Detached House | £174,346.00 | 109 Semi Detached Houses |
| Detached House | £307,436.00 | 22 Detached Houses |
| Terraced House | £140,727.00 | 36 Terraced Houses |
| Flat | £95,400.00 | 5 Flats |

