
Houses for sale in Ingol, Preston
House Prices in Ingol
Properties in Ingol have an average house price of £156k and had 307 Property Transactions within the last 3 years¹.
Ingol is an area in Preston, Lancashire with 3,332 households², where the most expensive property was sold for £395k.
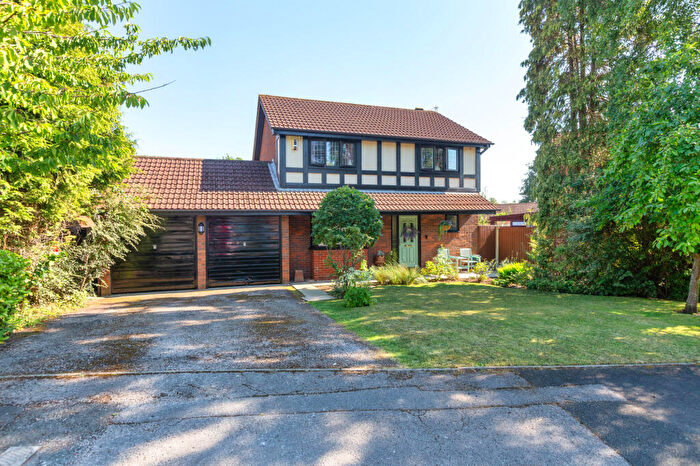
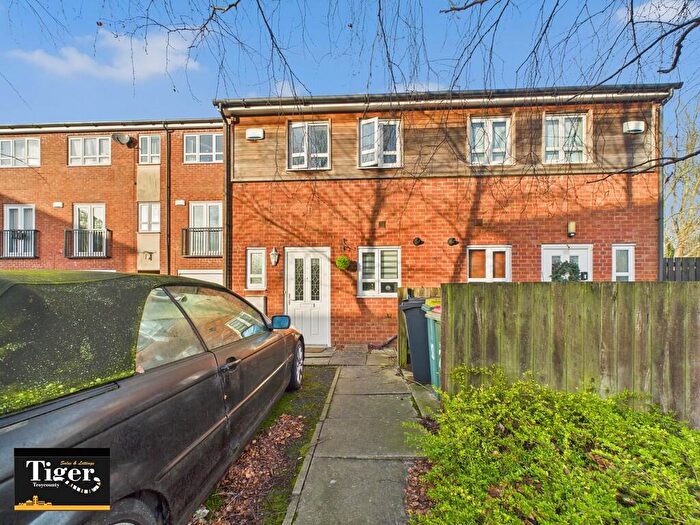
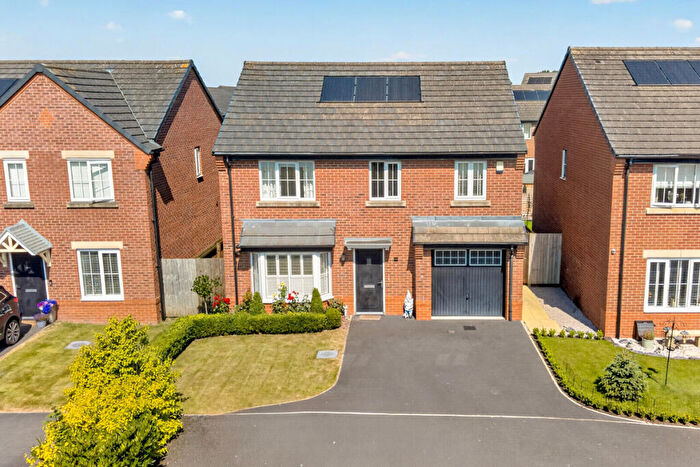
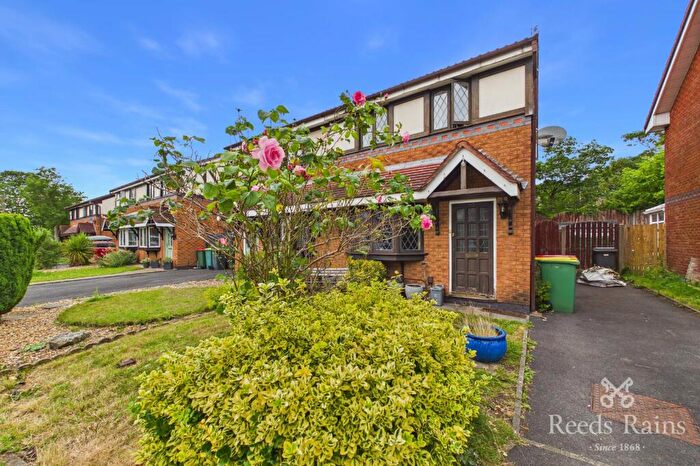
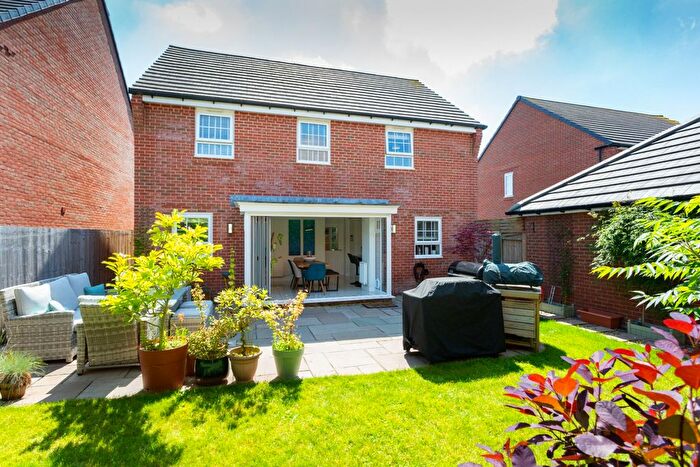
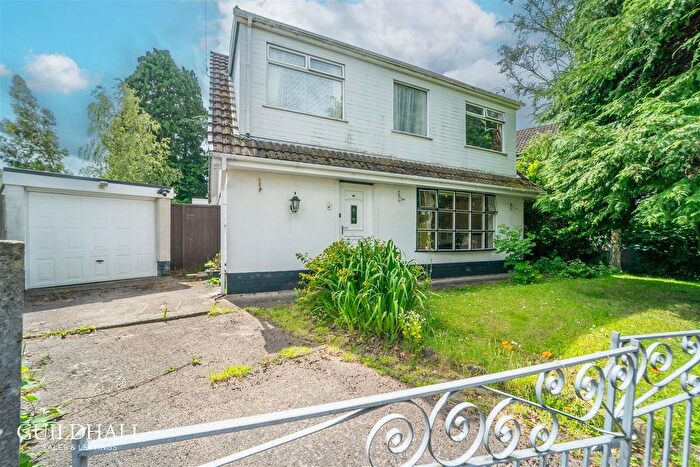
Properties for sale in Ingol
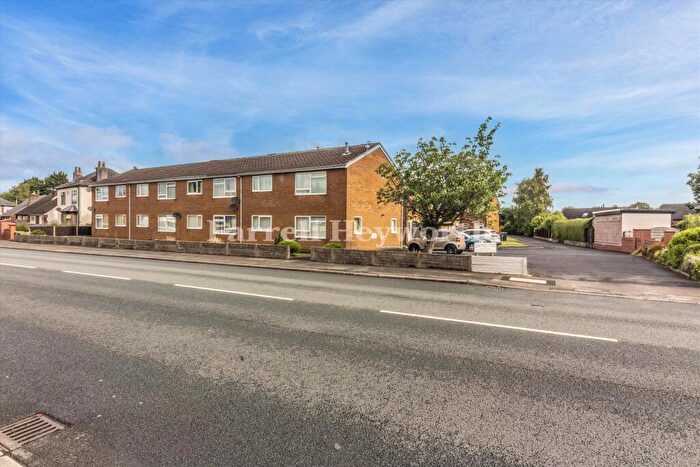
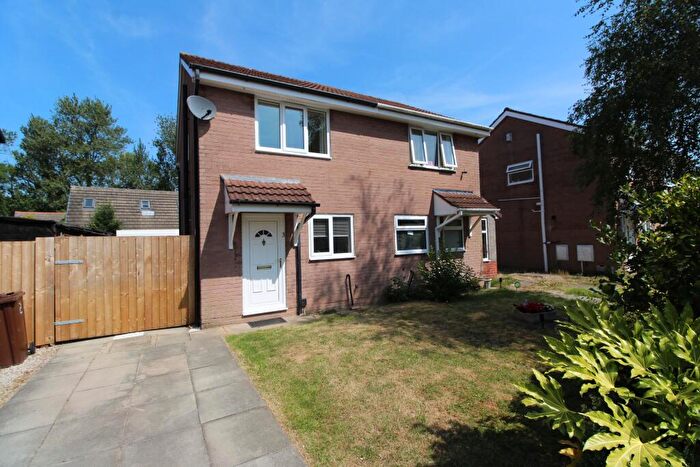
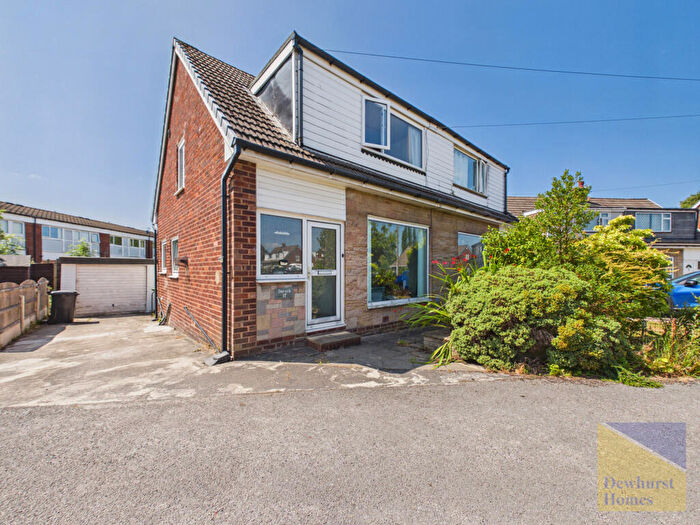
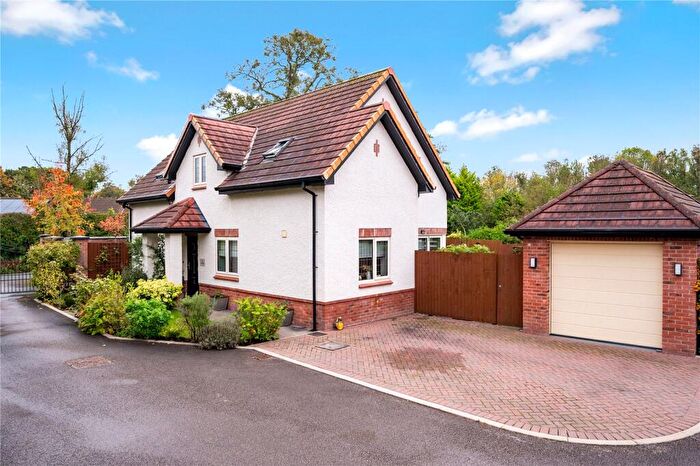
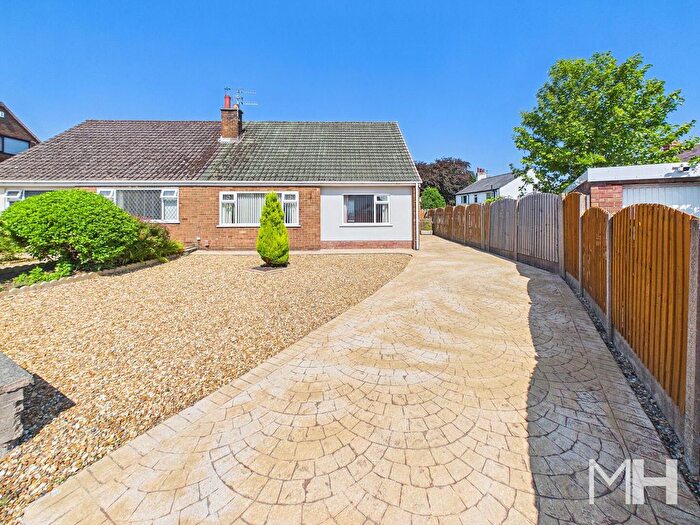

![]()
If you are looking to sell your house, let it out, or receive a property valuation, an expert can help you.
Click the button below to get started.

Roads and Postcodes in Ingol
Navigate through our locations to find the location of your next house in Ingol, Preston for sale or to rent.
| Streets | Postcodes |
|---|---|
| Alder Grove | PR2 7DW |
| Ambergate | PR2 7DG |
| Ashbourne Crescent | PR2 3ZJ PR2 3ZQ |
| Ashfield Court | PR2 7HE |
| Bardsea Place | PR2 3YH |
| Barry Avenue | PR2 3XL PR2 3XN PR2 3XP PR2 3XQ |
| Beachley Road | PR2 3YJ |
| Bexhill Road | PR2 3SY PR2 3TA PR2 3UA |
| Bowlingfield | PR2 7DD PR2 7DE |
| Briar Grove | PR2 3UR |
| Brighton Crescent | PR2 3XT |
| Brook Croft | PR2 3TW |
| Cantsfield Avenue | PR2 3UD |
| Clevedon Road | PR2 3YL |
| Colwyn Place | PR2 3YD |
| Cottam Avenue | PR2 3XD PR2 3XE PR2 3XH |
| Cottam Hall Lane | PR2 3XB |
| Cottam Lane | PR2 3XW |
| Creswell Avenue | PR2 3XX PR2 3XY PR2 3YA |
| Cromer Place | PR2 3XR |
| Crosby Place | PR2 3XS |
| Dalmore Road | PR2 3XU |
| Dawlish Place | PR2 3YB |
| Dovedale Avenue | PR2 3WQ |
| Dovedale Close | PR2 3WR |
| Dukes Meadow | PR2 7AR PR2 7AS PR2 7AT PR2 7AU |
| Dunoon Close | PR2 3ZR PR2 3ZS |
| Eastbourne Close | PR2 3YR |
| Filey Place | PR2 3XJ |
| Goldburn Close | PR2 7AD PR2 7AE |
| Golf View | PR2 7EH PR2 7EJ PR2 7EL PR2 7EN |
| Greenfield Way | PR2 3GD PR2 3GE PR2 3GG |
| Hanover Court | PR2 7EQ |
| Higher Greenfield | PR2 3ZX |
| Hillcrest Avenue | PR2 3UN PR2 3UP |
| Hollinhead Crescent | PR2 3UB |
| Hollybank Close | PR2 3XG |
| Kidsgrove | PR2 7BX |
| Lower Greenfield | PR2 3ZT |
| Maple Leaf Close | PR2 7DZ |
| Margate Road | PR2 3TB |
| Marlfield Close | PR2 7AL |
| Marshall Grove | PR2 3YN |
| Mason House Crescent | PR2 7DY |
| Matlock Place | PR2 3ZN |
| Mayfield Avenue | PR2 3PL PR2 3UE PR2 3UH |
| New Links Avenue | PR2 7EX |
| New Rough Hey | PR2 7BA PR2 7BB PR2 7BD |
| Newlyn Place | PR2 3ZA |
| Oaktree Avenue | PR2 3UJ |
| Oaktree Close | PR2 3UZ |
| Orchard Close | PR2 3TG |
| Pool House Court | PR2 7DT |
| Pool House Lane | PR2 7DQ |
| Redcar Avenue | PR2 3YY |
| Sheraton Park | PR2 7AZ |
| St Davids Gardens | PR2 3YE |
| St Ives Crescent | PR2 3ZD |
| St Leonards Close | PR2 3TE |
| St Margarets Close | PR2 3ZU |
| Sylvancroft | PR2 7BL PR2 7BN PR2 7BP |
| Tag Croft | PR2 7AH PR2 7AJ PR2 7AQ |
| Tag Farm Court | PR2 3GJ |
| Tag Lane | PR2 7AA PR2 3TX PR2 3TY PR2 3UY PR2 3XA PR2 7AB |
| The Avenue | PR2 7AX PR2 7AY |
| The Coppice | PR2 3UL |
| Thistlecroft | PR2 7BS PR2 7BT |
| Threefields | PR2 7BE PR2 7BH PR2 7BJ PR2 7BQ |
| Turnfield | PR2 7DH PR2 7DJ PR2 7DL |
| Village Green Lane | PR2 7DS |
| Waters Edge | PR2 3XZ |
| West Avenue | PR2 7EP |
| Westbrook Crescent | PR2 3TD |
| Whitby Avenue | PR2 3GA PR2 3GB PR2 3YP PR2 3ZP |
| Whitefriar Close | PR2 3XF |
| Worthing Road | PR2 3UQ |
Property price trends in Ingol
According to the latest Land Registry data, the average home in Ingol sold for £112,714 in 2026. That figure comes from 3,415 sales logged over the past 31 years.
Prices have fallen back over the last three years. Compared with 2023, when the typical sale came in around £153,437, that's a fall of roughly 26.5%.
Looking back five years, average prices are down about 16% since 2021, a drop of around £21,485 in cash terms.
Zoom out to the past decade for the fuller picture. Back in 2016, homes here averaged £107,752, so the typical sold price has climbed about 4.6% since then, roughly 0.5% a year. Stretch the view to fifteen years and that annual pace eases back to about 0%.
Frequently asked questions about Ingol
What is the average price for a property for sale in Ingol?
The average price for a property for sale in Ingol is £156,380. This amount is 30% lower than the average price in Preston. There are 1,303 property listings for sale in Ingol.
What streets have the most expensive properties for sale in Ingol?
The streets with the most expensive properties for sale in Ingol are Cottam Lane at an average of £321,250, Higher Greenfield at an average of £301,900 and Oaktree Close at an average of £235,500.
What streets have the most affordable properties for sale in Ingol?
The streets with the most affordable properties for sale in Ingol are Cromer Place at an average of £32,000, Hanover Court at an average of £59,100 and Golf View at an average of £63,312.
Which train stations are available in or near Ingol?
Some of the train stations available in or near Ingol are Preston, Salwick and Lostock Hall.
Property Price Paid in Ingol by Year
The average sold property price by year was:
| Year | Average Sold Price | Price Change |
Sold Properties
|
|---|---|---|---|
| 2026 | £112,714 | -41% |
7 Properties |
| 2025 | £158,909 | -1% |
95 Properties |
| 2024 | £159,804 | 4% |
105 Properties |
| 2023 | £153,437 | 9% |
100 Properties |
| 2022 | £139,454 | 4% |
108 Properties |
| 2021 | £134,199 | 3% |
121 Properties |
| 2020 | £129,660 | 15% |
71 Properties |
| 2019 | £110,563 | -14% |
86 Properties |
| 2018 | £126,530 | 5% |
112 Properties |
| 2017 | £120,534 | 11% |
114 Properties |
Property Price per Property Type in Ingol
Here you can find historic sold price data in order to help with your property search.
The average Property Paid Price for specific property types in the last three years are:
| Property Type | Average Sold Price | Sold Properties |
|---|---|---|
| Semi Detached House | £175,805.00 | 120 Semi Detached Houses |
| Detached House | £245,563.00 | 57 Detached Houses |
| Terraced House | £120,030.00 | 80 Terraced Houses |
| Flat | £66,250.00 | 50 Flats |
