Houses for sale & to rent in Bourne, Thornton-cleveleys
House Prices in Bourne
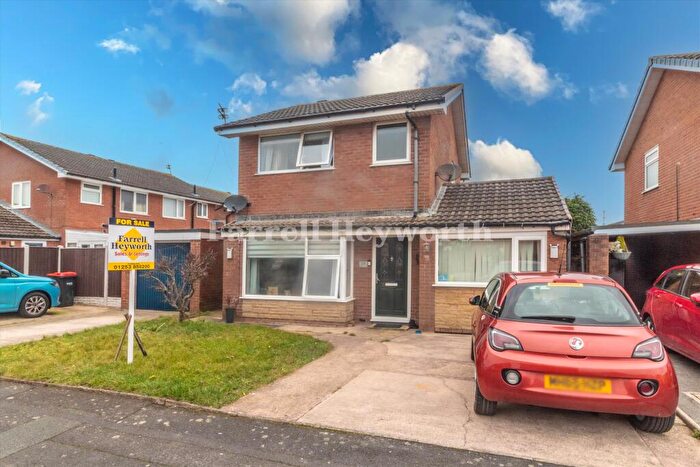
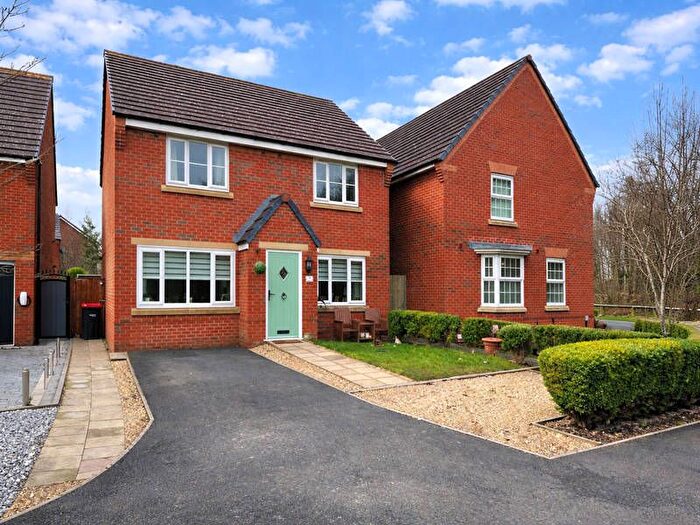
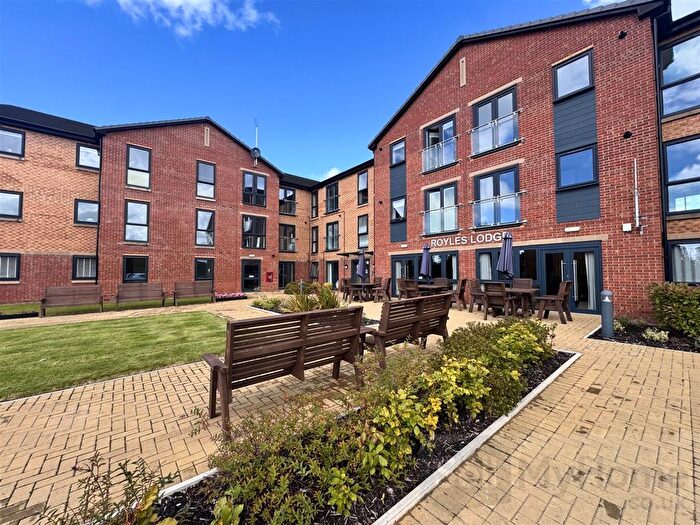
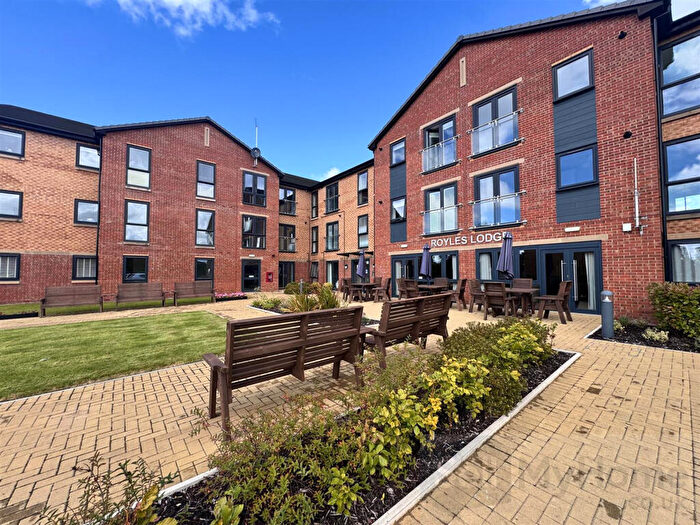
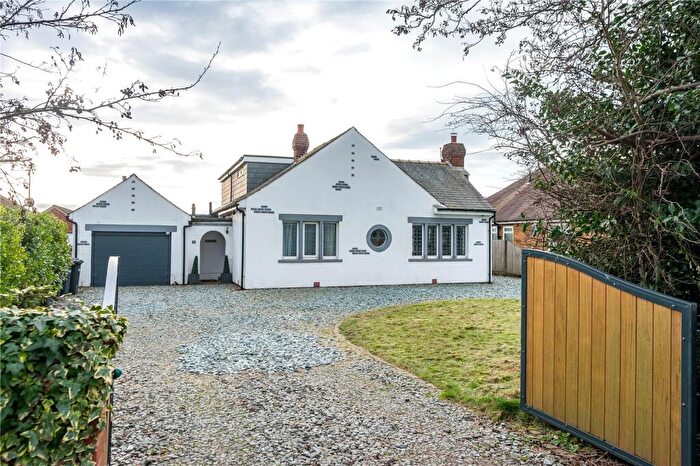
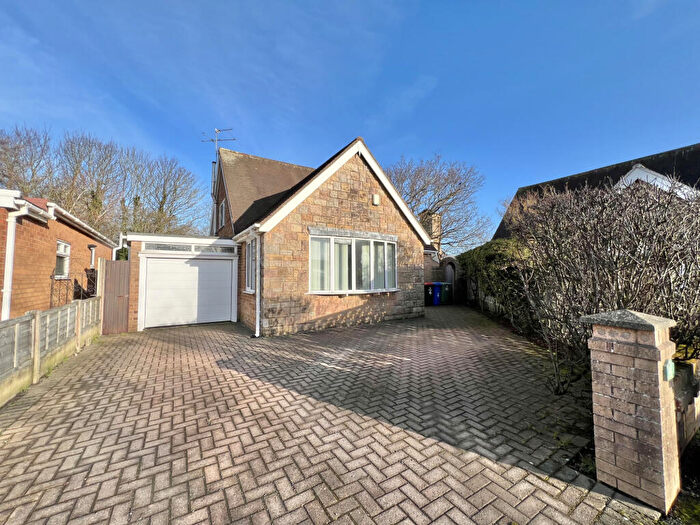
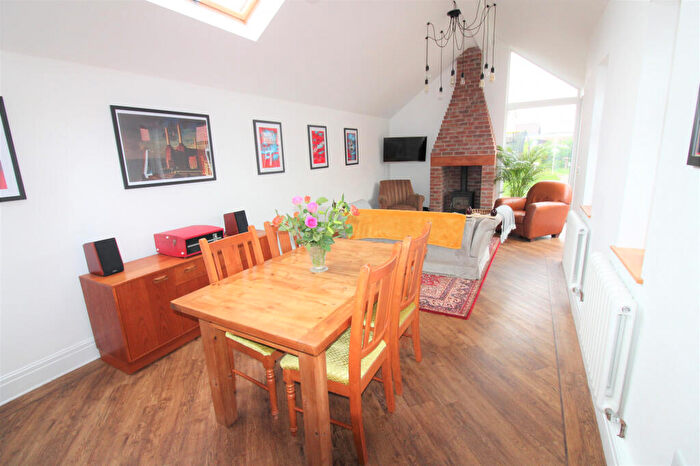
Properties in Bourne have an average house price of £164,350.00 and had 397 Property Transactions within the last 3 years¹.
Bourne is an area in Thornton-cleveleys, Lancashire with 2,866 households², where the most expensive property was sold for £365,000.00.
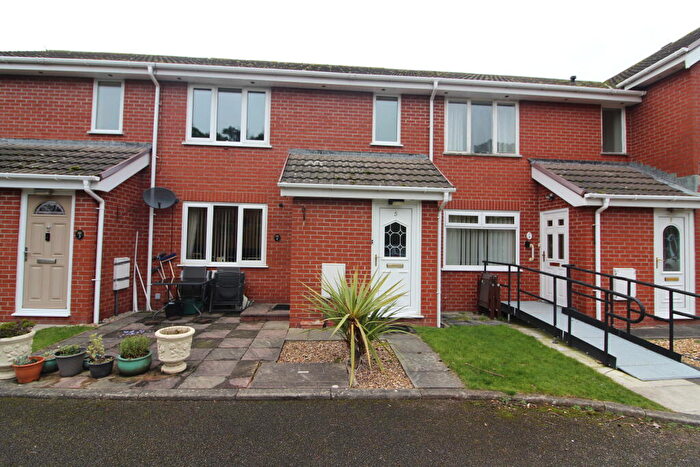
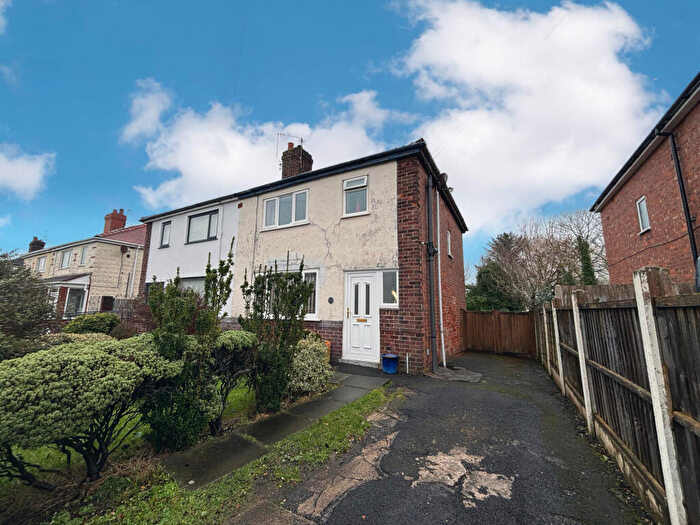
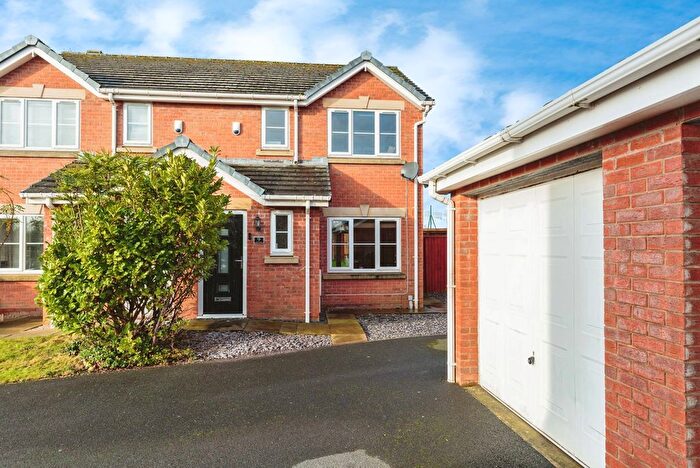
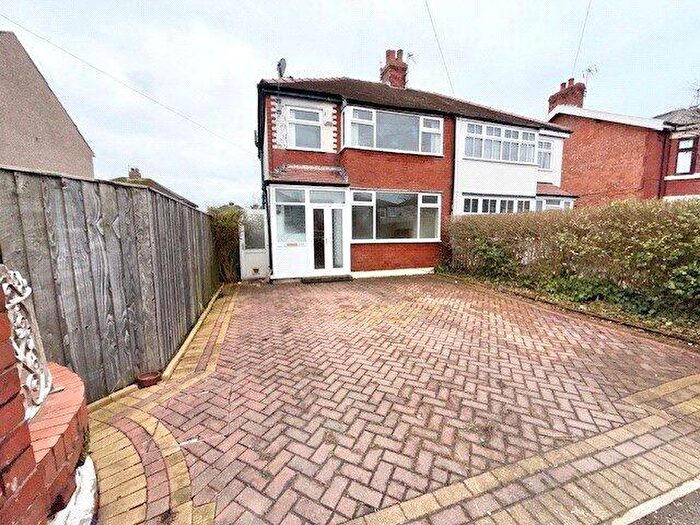
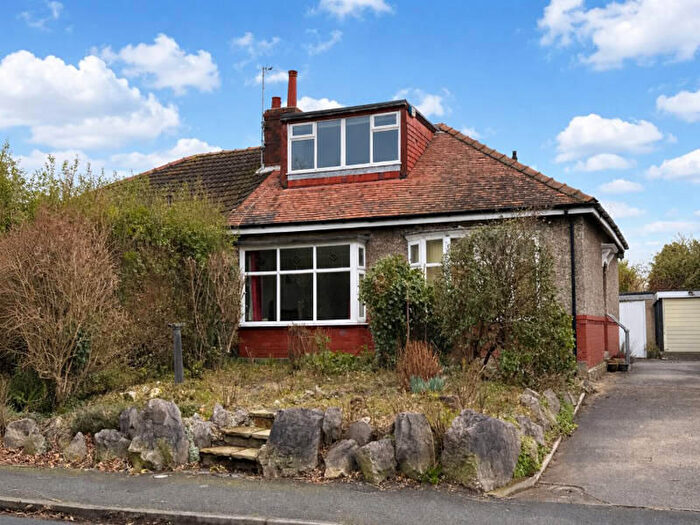
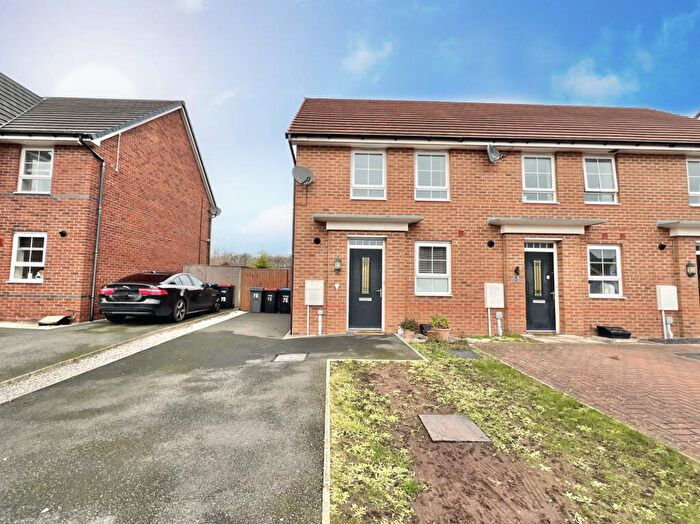
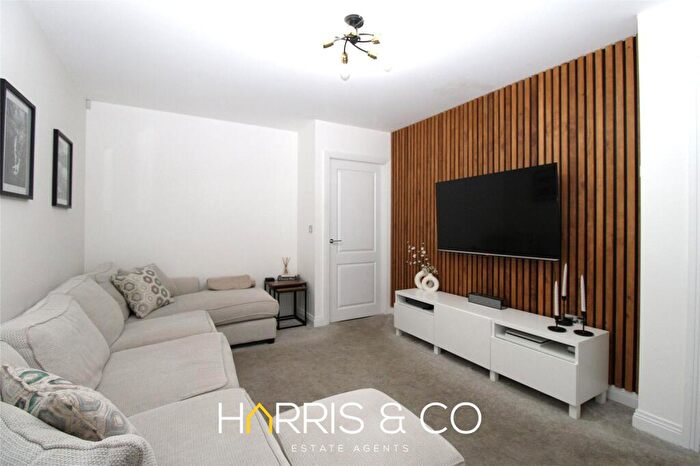
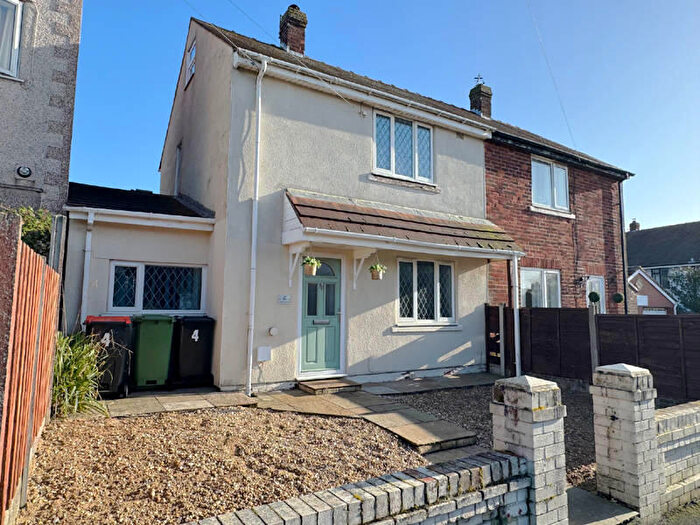
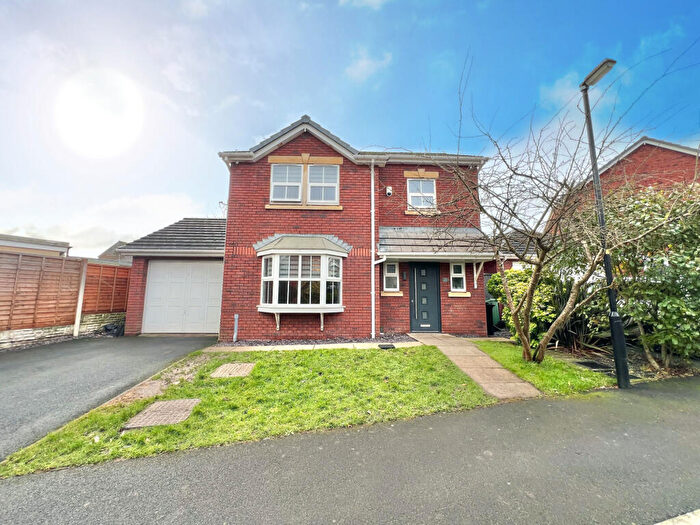
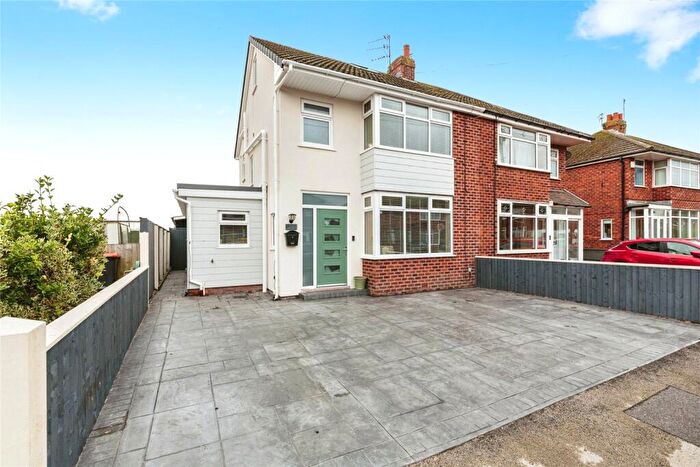
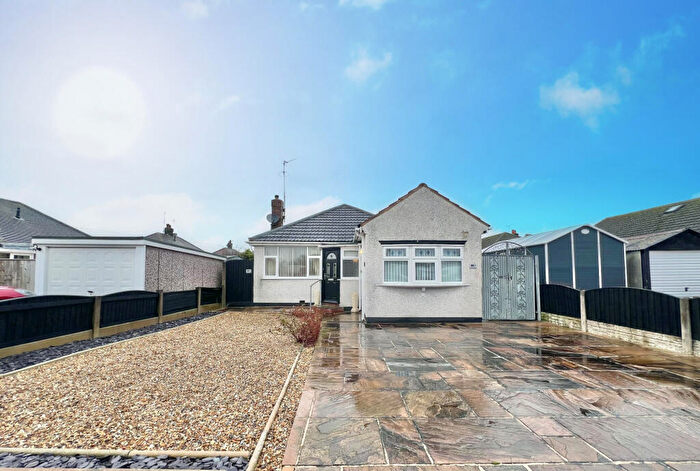
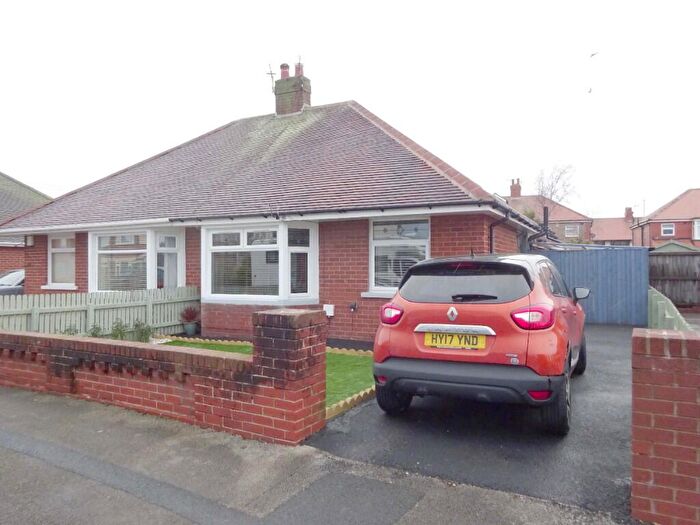
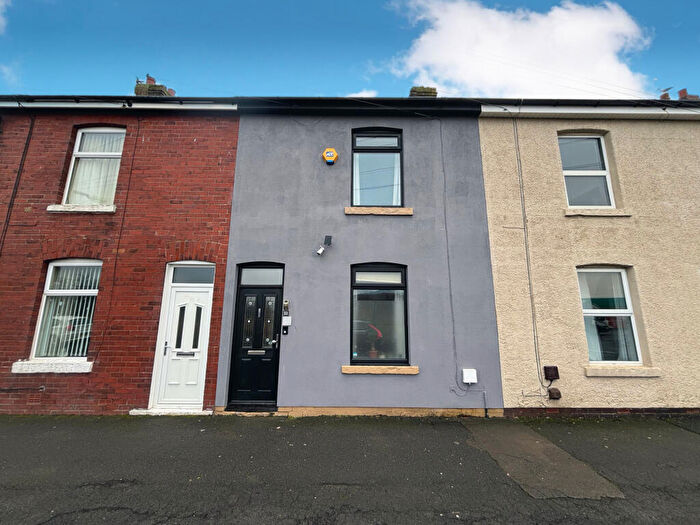
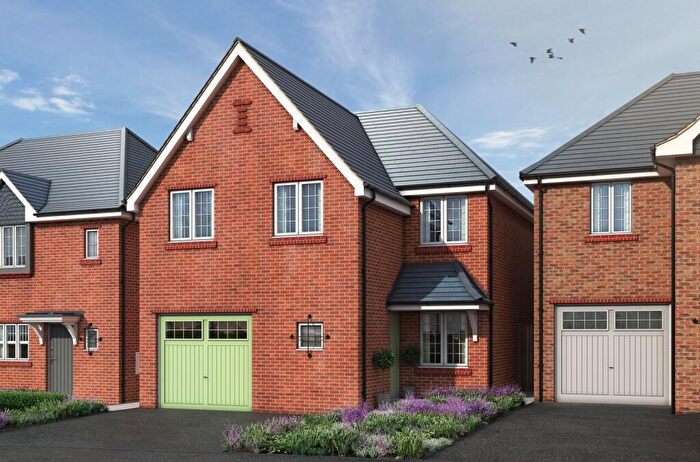
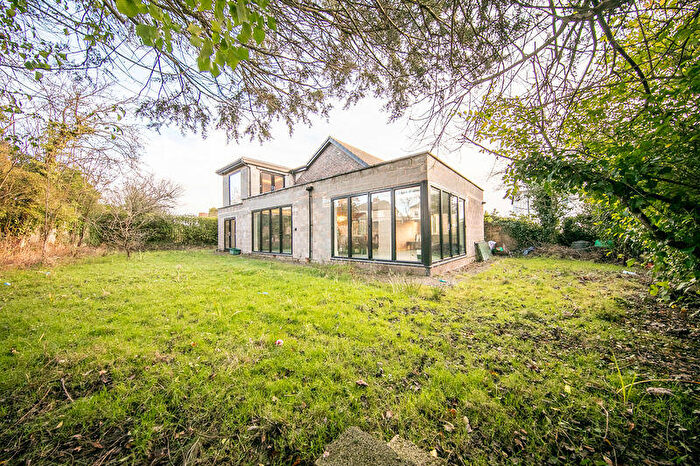
Properties for sale in Bourne
Roads and Postcodes in Bourne
Navigate through our locations to find the location of your next house in Bourne, Thornton-cleveleys for sale or to rent.
| Streets | Postcodes |
|---|---|
| Alder Lane | FY5 4GT |
| Ash Road | FY5 4GP |
| Avonside Avenue | FY5 2SN |
| Bardsway | FY5 2HB FY5 2HD |
| Beech Drive | FY5 4GN |
| Bennett Road | FY5 2RR |
| Birch Lane | FY5 4GS |
| Blenheim Drive | FY5 4PH |
| Bonney Street | FY5 4HQ |
| Bourne Road | FY5 4QA |
| Bowness Avenue | FY5 4AX |
| Breeze Close | FY5 2WH |
| Brookside | FY5 4HD FY5 4BG FY5 4EZ |
| Brown Street | FY5 4HG |
| Butts Close | FY5 4HT |
| Butts Road | FY5 4HX |
| Byron Avenue | FY5 2HA |
| Carlisle Grove | FY5 4BY |
| Chequers Way | FY5 4FS |
| Cherry Lane | FY5 4FZ |
| Chestnut Gardens | FY5 4HS |
| Church Road | FY5 2TZ |
| Churchill Close | FY5 4BQ |
| Coniston Avenue | FY5 4BB |
| Connaught Drive | FY5 4FT |
| Cookson Road | FY5 2RL |
| Counsell Court | FY5 4BF |
| Crabtree Orchard | FY5 4JU |
| Crabtree Road | FY5 4HW |
| Croft Court | FY5 4JX |
| Crowder Avenue | FY5 4NU |
| Crystal Road | FY5 4JL |
| Dallam Dell | FY5 4PX |
| Devonshire Avenue | FY5 4AP |
| Devonshire Mews | FY5 4EU |
| Dovedale Avenue | FY5 2SR |
| Dunlop Drive | FY5 4GX |
| Eagle Brow Close | FY5 4PY |
| Edward Street | FY5 4JE |
| Fairclough Road | FY5 2RN FY5 2RW |
| Fairholmes Close | FY5 2SL |
| Fairholmes Way | FY5 2SB FY5 2SJ |
| Farm Close | FY5 4HZ |
| Ferndale Close | FY5 4PD |
| Fleetwood Road North | FY5 4AE FY5 4AF FY5 4BH FY5 4BJ FY5 4BL FY5 4BZ FY5 4LA FY5 4LB FY5 4LD FY5 4LE FY5 4LF FY5 4LQ FY5 4LH FY5 4QD |
| Gamble Road | FY5 4JG FY5 4JH FY5 4JF |
| Gaskell Crescent | FY5 2TB |
| Glenmore Avenue | FY5 4NY |
| Gordon Avenue | FY5 4BU |
| Grange Avenue | FY5 4PA |
| Grasmere Avenue | FY5 4AZ |
| Greengate | FY5 4FR |
| Hapton Street | FY5 4JD |
| Hargate Road | FY5 4PG FY5 4PQ |
| Hargreaves Street | FY5 4HJ |
| Harrison Avenue | FY5 4NX |
| Hatfield Close | FY5 4PF |
| Hawthorn Drive | FY5 4GQ FY5 4GU |
| Heys Street | FY5 4HN FY5 4HL FY5 4JP FY5 4JS |
| Hillberry Close | FY5 4FU |
| Holly Close | FY5 4LR |
| Holly Road | FY5 4HH |
| Holmes Road | FY5 2SG FY5 2SH |
| Honey Moor Drive | FY5 4NL |
| Hope Close | FY5 4LT |
| Ivy Gardens | FY5 4NZ |
| John Street | FY5 4JA |
| Keepers Hey | FY5 2HL |
| Kildare Avenue | FY5 2RZ |
| Langdale Close | FY5 4BW |
| Lawsons Road | FY5 4PJ FY5 4PL FY5 4PW FY5 4DL |
| Leslie Avenue | FY5 4PE |
| Lindadale Avenue | FY5 4BA |
| Long Meadow Lane | FY5 4JT |
| Longton Avenue | FY5 4BX |
| Lowesway | FY5 2TJ |
| Mallowdale | FY5 4LP |
| Marsh Road | FY5 2SE FY5 2SF FY5 2TY |
| Mayfield Avenue | FY5 2HE FY5 2HH |
| Mildred Close | FY5 2RP |
| Milford Terrace | FY5 4JR |
| Occupation Road | FY5 4PR |
| Orchard Close | FY5 4LW |
| Ormerod Street | FY5 4HU |
| Osier Court | FY5 4QS |
| Parkside View | FY5 2WL |
| Partridge Avenue | FY5 2HJ |
| Patten Place | FY5 4FA |
| Patterdale Avenue | FY5 2SD |
| Peace Place | FY5 4LS |
| Penny Farthing Lane | FY5 2ED |
| Pickmere Close | FY5 2HP |
| Pleasant Grove | FY5 4AG |
| Poachers Way | FY5 2WF |
| Poplar Drive | FY5 4QG FY5 4QP |
| Prescot Place | FY5 4NP |
| Red Marsh Drive | FY5 4GW FY5 4HP FY5 4HR |
| Reta Drive | FY5 2RU |
| Rixton Grove | FY5 4PU |
| Rock Street | FY5 4JB |
| Roscoe Avenue | FY5 4FW |
| Rose Fold | FY5 4NQ |
| Rossendale Avenue North | FY5 4NT |
| Royles Brook Close | FY5 4PS |
| Royles Court | FY5 4ET |
| Ruskin Avenue | FY5 2RS |
| Saltash Road | FY5 4JJ |
| Sandyforth Avenue | FY5 4BP FY5 4BS |
| Shore Green | FY5 2LT |
| Springbank Avenue | FY5 4PB |
| Springfield Drive | FY5 4LL FY5 4LN |
| Sycamore Drive | FY5 4QR |
| Tarnbrook Avenue | FY5 4FY |
| Taywood Road | FY5 2RT |
| Tennyson Avenue | FY5 2EU FY5 2EX |
| The Chase | FY5 2JW |
| The Covert | FY5 2HW |
| The Lilacs | FY5 2WU |
| The Maltings | FY5 2LU |
| The Stables | FY5 4GY |
| Thornton Centre | FY5 5DX |
| Thornton Place | FY5 2WJ |
| Torentum Court | FY5 4BE |
| Tower Close | FY5 2WG |
| Trinity Gardens | FY5 2UA |
| Trunnah Gardens | FY5 4BT |
| Trunnah Road | FY5 4HE FY5 4HF |
| Ullswater Avenue | FY5 4AU |
| Walker Way | FY5 4LG |
| Waring Drive | FY5 2SP FY5 2SW |
| Wembley Road | FY5 4JN |
| West Drive | FY5 2EH FY5 2EL FY5 2EQ FY5 2RX FY5 2RY |
| Wharfedale Avenue | FY5 2SS |
| Whimbrel Drive | FY5 2LR |
| Widgeon Close | FY5 2HN |
| Willow Road | FY5 4GR |
| Windsor Avenue | FY5 4AY |
| Woodland Avenue | FY5 4HA FY5 4HB |
| Yorke Place | FY5 4GZ |
Transport near Bourne
- FAQ
- Price Paid By Year
- Property Type Price
Frequently asked questions about Bourne
What is the average price for a property for sale in Bourne?
The average price for a property for sale in Bourne is £164,350. This amount is 10% lower than the average price in Thornton-cleveleys. There are 2,019 property listings for sale in Bourne.
What streets have the most expensive properties for sale in Bourne?
The streets with the most expensive properties for sale in Bourne are Trinity Gardens at an average of £312,500, Connaught Drive at an average of £278,666 and The Stables at an average of £255,000.
What streets have the most affordable properties for sale in Bourne?
The streets with the most affordable properties for sale in Bourne are Walker Way at an average of £57,612, Lowesway at an average of £79,687 and Butts Road at an average of £85,000.
Which train stations are available in or near Bourne?
Some of the train stations available in or near Bourne are Poulton-Le-Fylde, Layton and Blackpool North.
Property Price Paid in Bourne by Year
The average sold property price by year was:
| Year | Average Sold Price | Price Change |
Sold Properties
|
|---|---|---|---|
| 2025 | £169,025 | 3% |
130 Properties |
| 2024 | £163,969 | 3% |
145 Properties |
| 2023 | £159,821 | -6% |
122 Properties |
| 2022 | £169,594 | 12% |
155 Properties |
| 2021 | £149,977 | 9% |
229 Properties |
| 2020 | £135,738 | -7% |
135 Properties |
| 2019 | £145,189 | 8% |
167 Properties |
| 2018 | £133,177 | -3% |
178 Properties |
| 2017 | £136,775 | 6% |
164 Properties |
| 2016 | £128,464 | -2% |
138 Properties |
| 2015 | £130,670 | -1% |
153 Properties |
| 2014 | £132,188 | -2% |
147 Properties |
| 2013 | £134,859 | -2% |
118 Properties |
| 2012 | £137,095 | 5% |
117 Properties |
| 2011 | £130,534 | 8% |
98 Properties |
| 2010 | £120,292 | -3% |
64 Properties |
| 2009 | £124,220 | -2% |
73 Properties |
| 2008 | £127,115 | -11% |
78 Properties |
| 2007 | £141,457 | 9% |
193 Properties |
| 2006 | £128,289 | 8% |
189 Properties |
| 2005 | £117,728 | -1% |
129 Properties |
| 2004 | £118,919 | 18% |
233 Properties |
| 2003 | £97,490 | 25% |
248 Properties |
| 2002 | £72,950 | 13% |
302 Properties |
| 2001 | £63,538 | 9% |
261 Properties |
| 2000 | £57,618 | 4% |
190 Properties |
| 1999 | £55,556 | 8% |
147 Properties |
| 1998 | £51,081 | 4% |
180 Properties |
| 1997 | £49,126 | 13% |
161 Properties |
| 1996 | £42,861 | -19% |
135 Properties |
| 1995 | £50,988 | - |
109 Properties |
Property Price per Property Type in Bourne
Here you can find historic sold price data in order to help with your property search.
The average Property Paid Price for specific property types in the last three years are:
| Property Type | Average Sold Price | Sold Properties |
|---|---|---|
| Flat | £74,179.00 | 12 Flats |
| Semi Detached House | £165,701.00 | 217 Semi Detached Houses |
| Detached House | £249,809.00 | 55 Detached Houses |
| Terraced House | £129,736.00 | 113 Terraced Houses |

