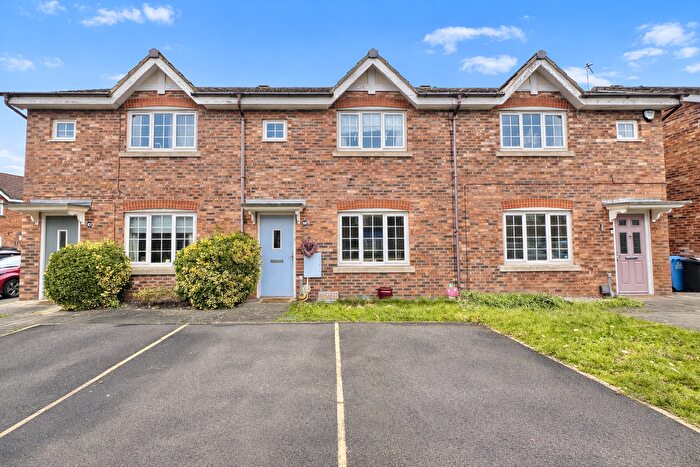
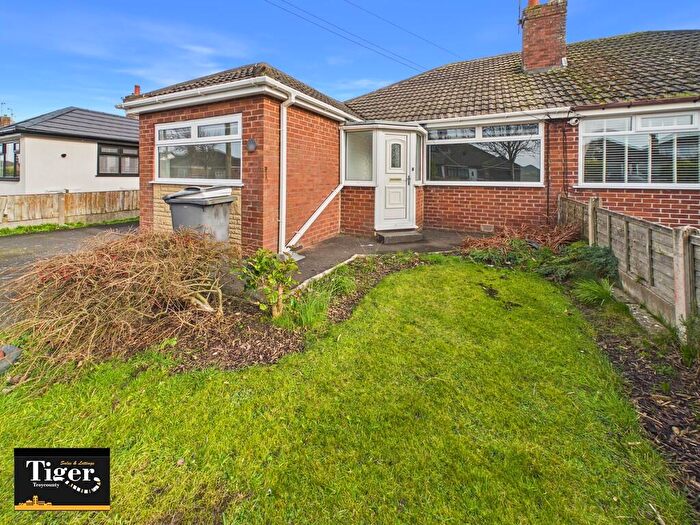
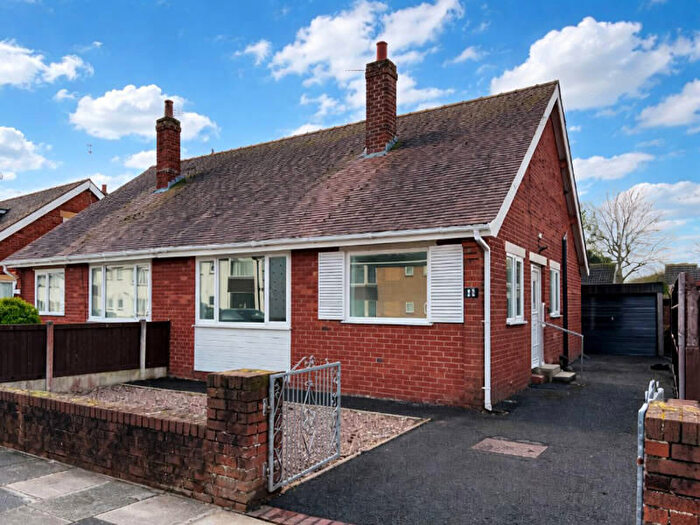
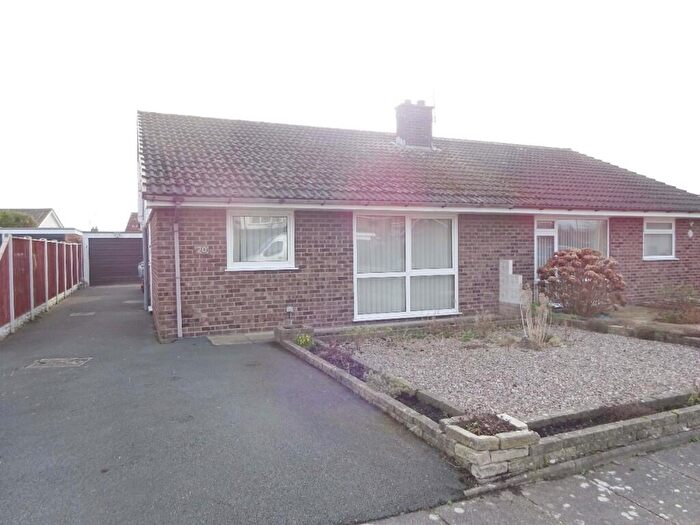
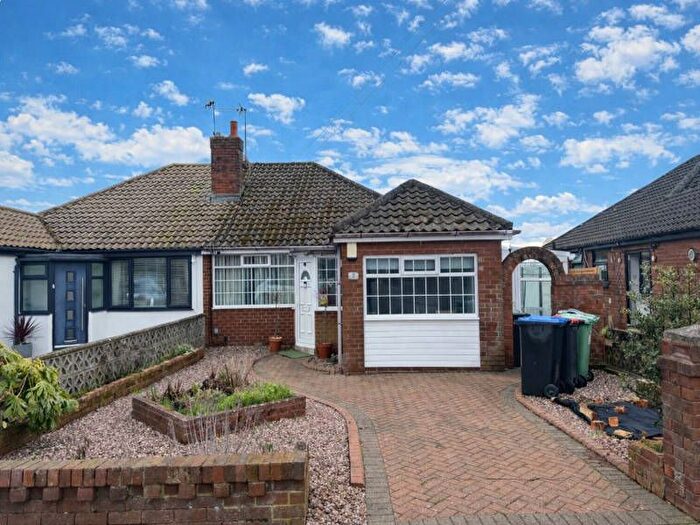
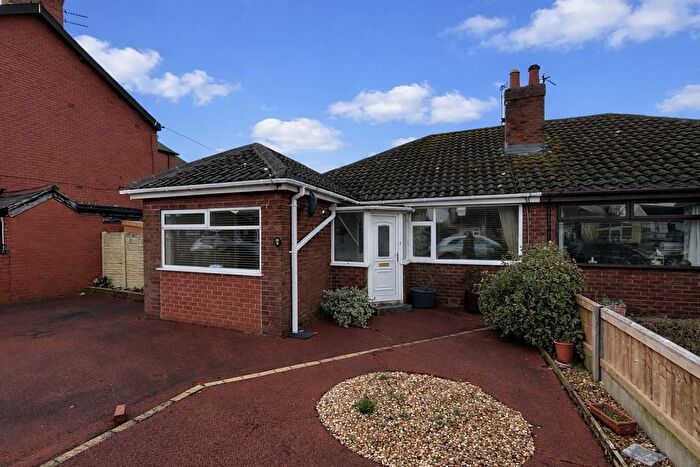
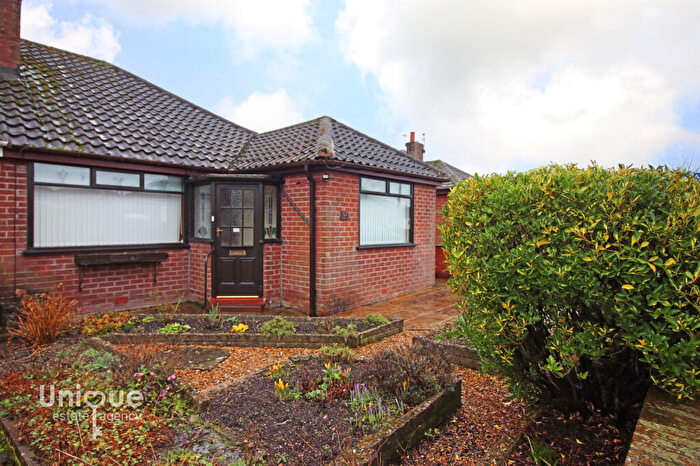
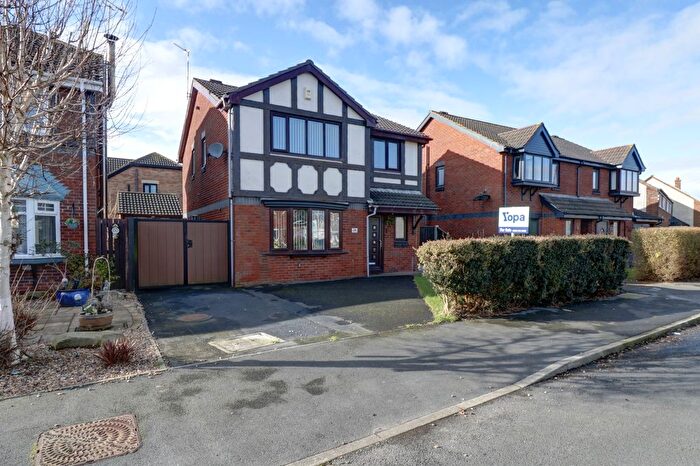
Houses for sale & to rent in Norcross, Thornton-cleveleys
House Prices in Norcross
Properties in Norcross have an average house price of £165,775.00 and had 225 Property Transactions within the last 3 years¹.
Norcross is an area in Thornton-cleveleys, Lancashire with 1,662 households², where the most expensive property was sold for £850,000.00.
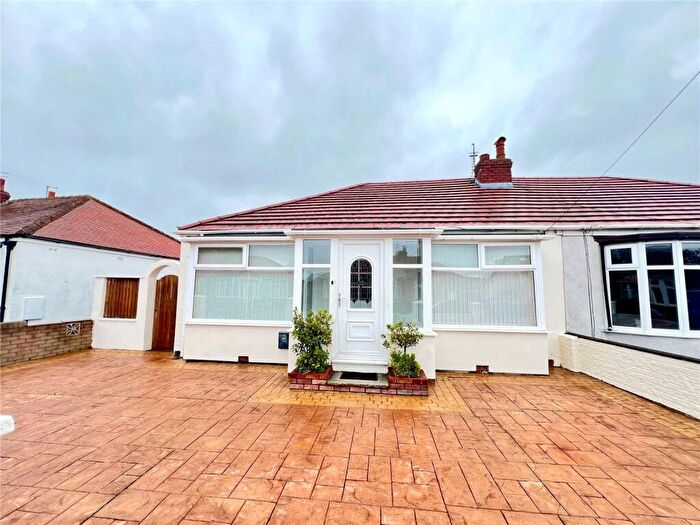
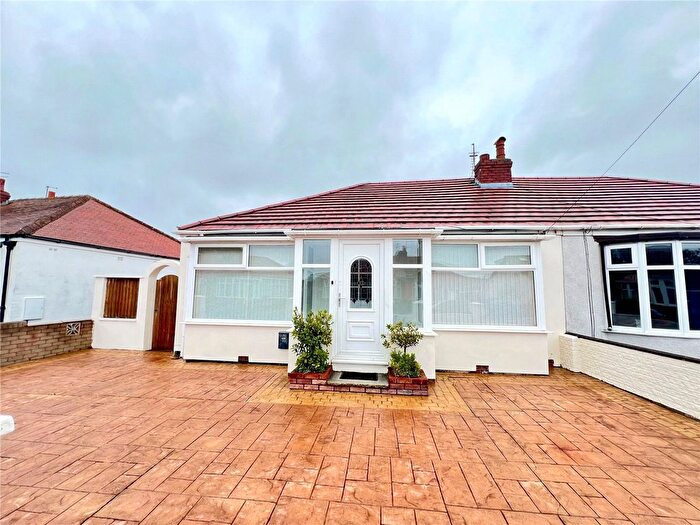
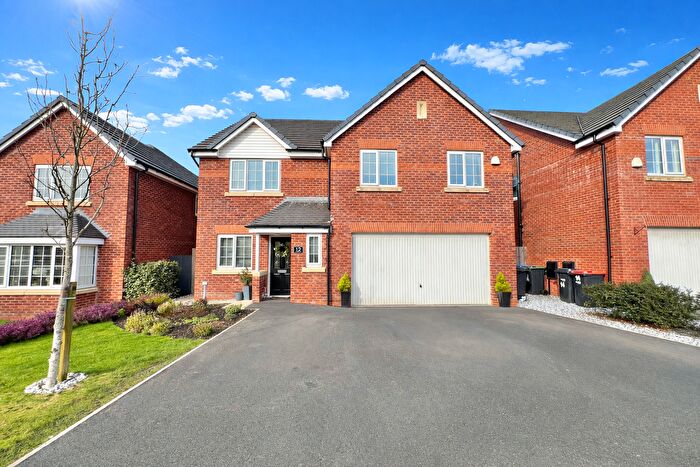
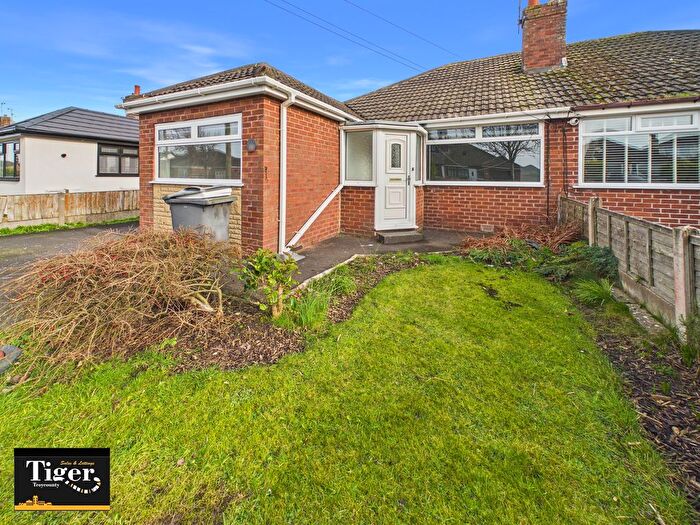
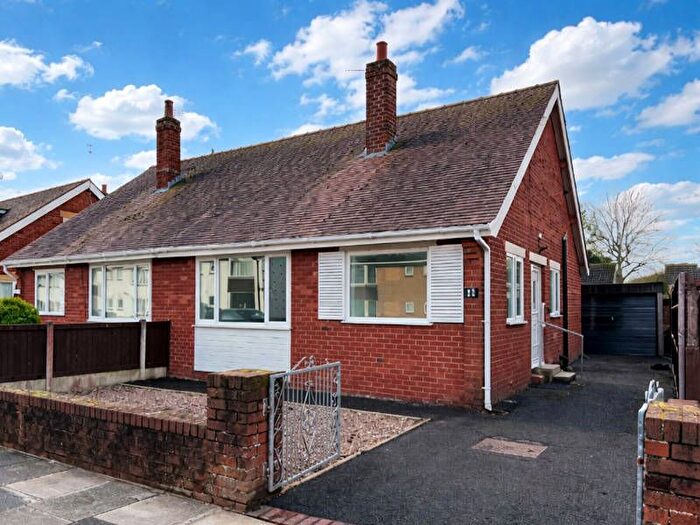
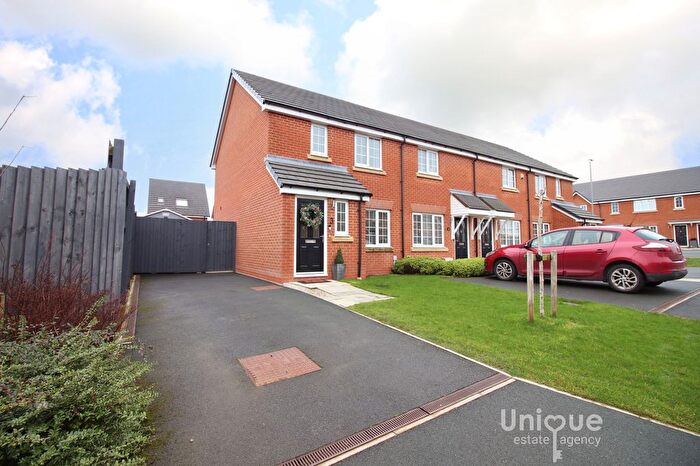
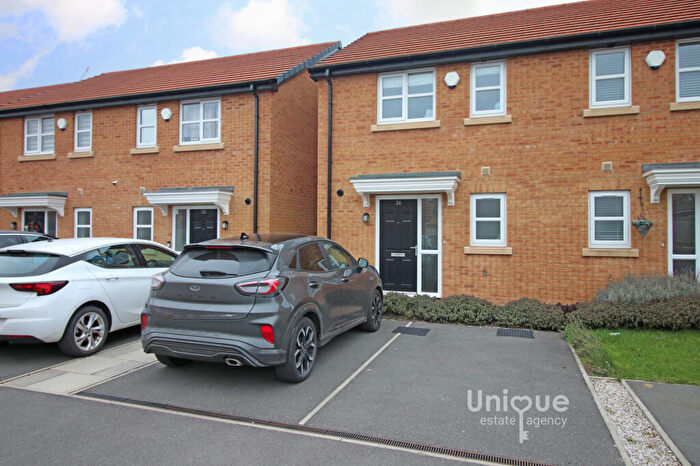
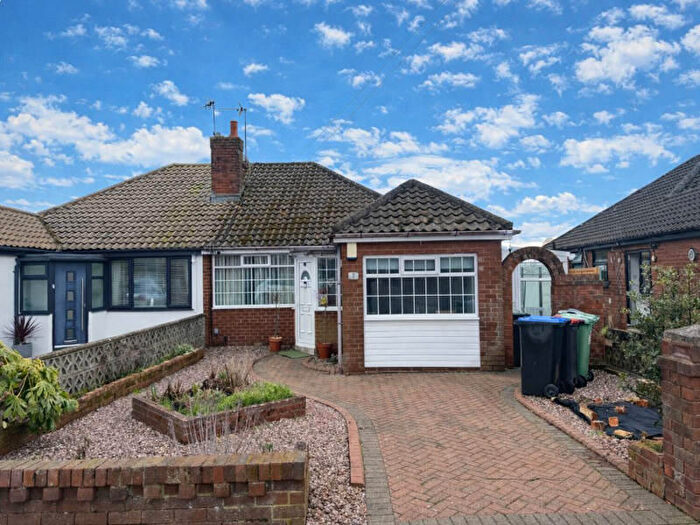
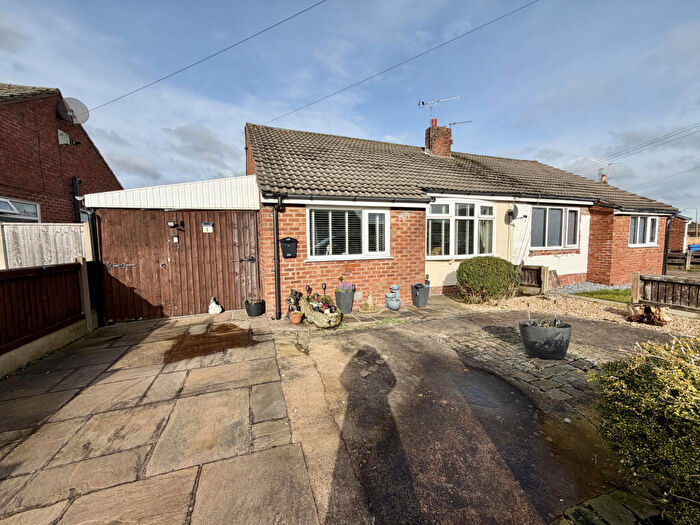
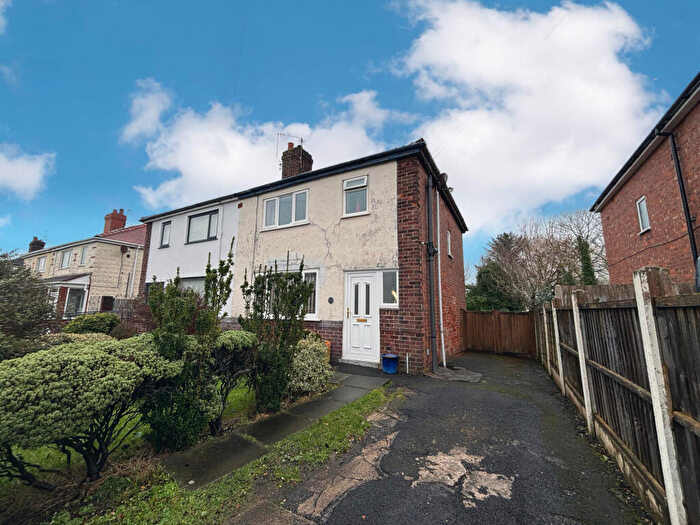
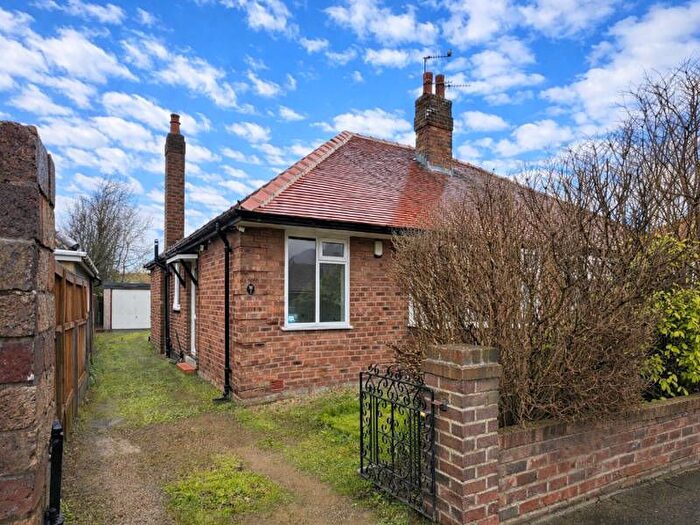
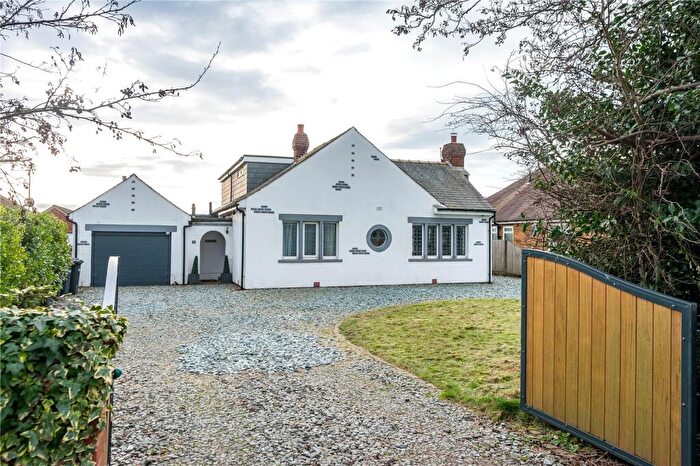
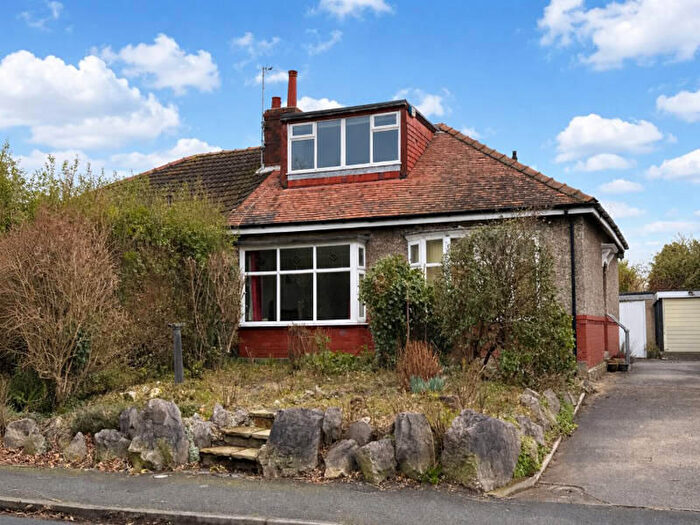
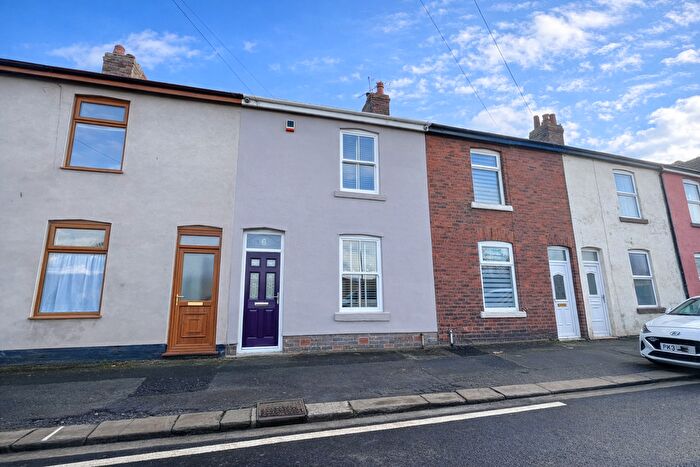
Properties for sale in Norcross
Roads and Postcodes in Norcross
Navigate through our locations to find the location of your next house in Norcross, Thornton-cleveleys for sale or to rent.
| Streets | Postcodes |
|---|---|
| Aintree Road | FY5 5HP FY5 5HW |
| Alder Close | FY5 4NF |
| Ascot Road | FY5 5HL FY5 5HN |
| Ash Drive | FY5 4DF |
| Aston Avenue | FY5 2UY |
| Bancroft Avenue | FY5 4NW |
| Bankfield Court | FY5 5HF |
| Beeches Court | FY5 4PZ |
| Beechwood Drive | FY5 5EJ |
| Benenden Place | FY5 2UF |
| Beverly Close | FY5 5DR |
| Brays Heys | FY5 4BD |
| Briar Mews | FY5 4NH |
| Briar Road | FY5 4NA FY5 4NB |
| Cheryl Drive | FY5 5DP |
| Chethams Close | FY5 2WD |
| Chichester Close | FY5 2WE |
| Church Road | FY5 2FN |
| Clifton Close | FY5 4NG |
| Colesville Avenue | FY5 4ND |
| Coniston Avenue | FY5 4AQ |
| Coniston Crescent | FY5 4AH |
| Devonshire Avenue | FY5 4AR FY5 4AS FY5 4AT |
| Edgeway Place | FY5 4DH |
| Elmwood Drive | FY5 4NE |
| Exeter Drive | FY5 2UU |
| Firshill Close | FY5 5HA |
| Fleetwood Road North | FY5 4AB FY5 4AD |
| Fleetwood Road South | FY5 5EA FY5 5ED FY5 5EE FY5 5EF |
| Gordonstoun Place | FY5 2UD |
| Hawthorne Road | FY5 5DH FY5 5EL |
| Heather Close | FY5 3NF |
| Keele Close | FY5 2US |
| Knowsley Crescent | FY5 4NR |
| Lancaster Avenue | FY5 4NN |
| Laurel Drive | FY5 5EX |
| Lawsons Road | FY5 4DA FY5 4DB FY5 4DD FY5 4DJ FY5 4PN FY5 4PP |
| Lime Grove | FY5 4DE |
| Marsh Mill Village | FY5 4JZ |
| Mayfair Gardens | FY5 5BW |
| Mill View | FY5 3SP |
| Neville Drive | FY5 5EY FY5 5EZ |
| Park Road | FY5 5HG |
| Roedean Close | FY5 2UZ |
| Roehampton Close | FY5 2WA |
| Rossendale Avenue North | FY5 4NS |
| Rossendale Avenue South | FY5 4LY FY5 4LZ |
| Rydal Avenue | FY5 4AJ |
| Sandown Road | FY5 5HJ |
| Sandringham Avenue | FY5 4LU FY5 4LX |
| Saxon Close | FY5 5DU |
| Shrewsbury Drive | FY5 2UE |
| Thornleigh Close | FY5 2WB |
| Ullswater Avenue | FY5 4AL FY5 4AW |
| Ullswater Crescent | FY5 4AN |
| Victoria Road East | FY5 3ST FY5 5BS FY5 5BT FY5 5HH FY5 5HQ |
| Wells Close | FY5 2UX |
| Westlands Court | FY5 5NU |
| Whitethorne Mews | FY5 5DT |
Transport near Norcross
- FAQ
- Price Paid By Year
- Property Type Price
Frequently asked questions about Norcross
What is the average price for a property for sale in Norcross?
The average price for a property for sale in Norcross is £165,775. This amount is 10% lower than the average price in Thornton-cleveleys. There are 2,120 property listings for sale in Norcross.
What streets have the most expensive properties for sale in Norcross?
The streets with the most expensive properties for sale in Norcross are Lime Grove at an average of £542,500, Park Road at an average of £378,500 and Thornleigh Close at an average of £290,500.
What streets have the most affordable properties for sale in Norcross?
The streets with the most affordable properties for sale in Norcross are Westlands Court at an average of £50,000, Brays Heys at an average of £65,000 and Bankfield Court at an average of £79,580.
Which train stations are available in or near Norcross?
Some of the train stations available in or near Norcross are Poulton-Le-Fylde, Layton and Blackpool North.
Property Price Paid in Norcross by Year
The average sold property price by year was:
| Year | Average Sold Price | Price Change |
Sold Properties
|
|---|---|---|---|
| 2025 | £164,459 | 6% |
72 Properties |
| 2024 | £154,141 | -16% |
78 Properties |
| 2023 | £179,139 | 10% |
75 Properties |
| 2022 | £160,506 | 3% |
75 Properties |
| 2021 | £156,115 | 3% |
95 Properties |
| 2020 | £151,945 | 6% |
57 Properties |
| 2019 | £142,575 | 9% |
74 Properties |
| 2018 | £129,605 | 3% |
51 Properties |
| 2017 | £125,527 | -10% |
72 Properties |
| 2016 | £138,414 | 11% |
79 Properties |
| 2015 | £123,824 | -13% |
82 Properties |
| 2014 | £139,880 | 11% |
68 Properties |
| 2013 | £123,889 | 10% |
50 Properties |
| 2012 | £111,214 | -30% |
56 Properties |
| 2011 | £144,315 | 7% |
55 Properties |
| 2010 | £134,777 | -1% |
41 Properties |
| 2009 | £136,253 | -10% |
44 Properties |
| 2008 | £149,989 | -3% |
61 Properties |
| 2007 | £154,742 | 11% |
114 Properties |
| 2006 | £137,468 | 1% |
124 Properties |
| 2005 | £135,558 | 14% |
88 Properties |
| 2004 | £116,557 | 18% |
105 Properties |
| 2003 | £95,467 | 24% |
115 Properties |
| 2002 | £72,364 | 15% |
140 Properties |
| 2001 | £61,573 | 6% |
121 Properties |
| 2000 | £57,775 | -5% |
107 Properties |
| 1999 | £60,568 | 3% |
99 Properties |
| 1998 | £58,475 | -7% |
92 Properties |
| 1997 | £62,778 | 10% |
114 Properties |
| 1996 | £56,742 | -6% |
126 Properties |
| 1995 | £60,087 | - |
114 Properties |
Property Price per Property Type in Norcross
Here you can find historic sold price data in order to help with your property search.
The average Property Paid Price for specific property types in the last three years are:
| Property Type | Average Sold Price | Sold Properties |
|---|---|---|
| Semi Detached House | £166,978.00 | 137 Semi Detached Houses |
| Detached House | £323,454.00 | 22 Detached Houses |
| Terraced House | £138,147.00 | 34 Terraced Houses |
| Flat | £81,579.00 | 32 Flats |

