Houses for sale & to rent in Wrightington, Wigan
House Prices in Wrightington
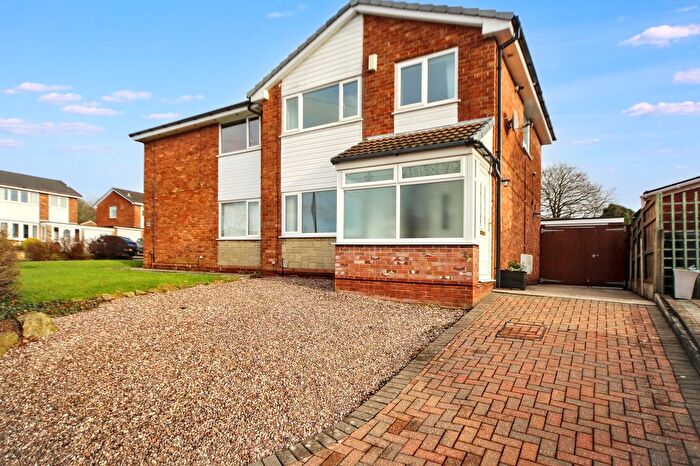
Properties in Wrightington have an average house price of £334,058.00 and had 94 Property Transactions within the last 3 years¹.
Wrightington is an area in Wigan, Lancashire with 1,207 households², where the most expensive property was sold for £999,999.00.
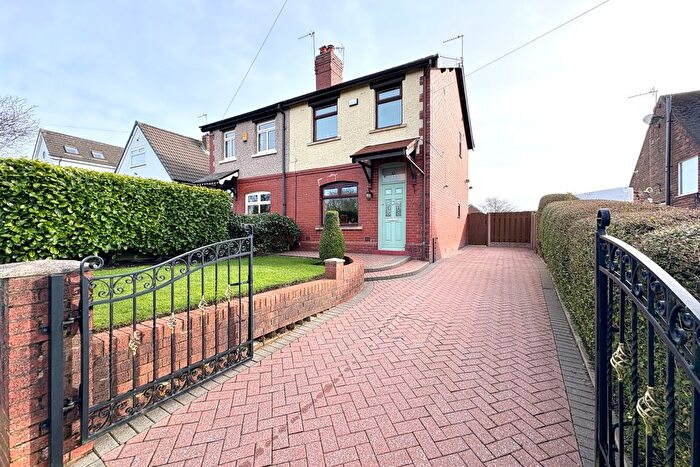
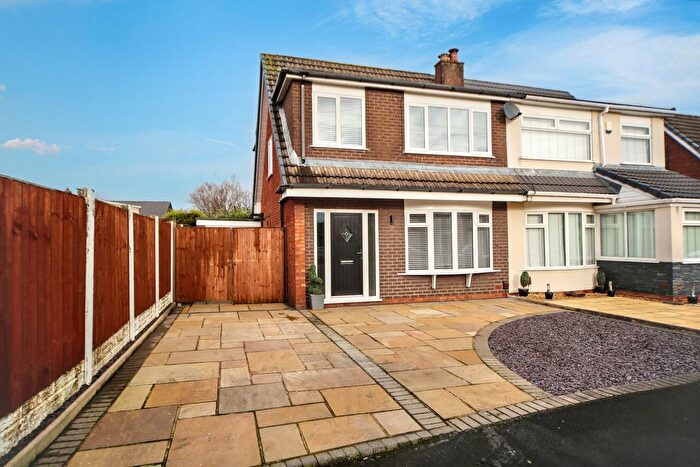
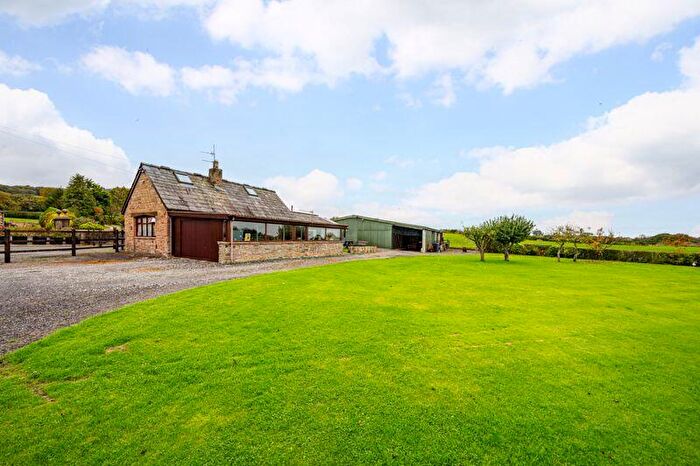
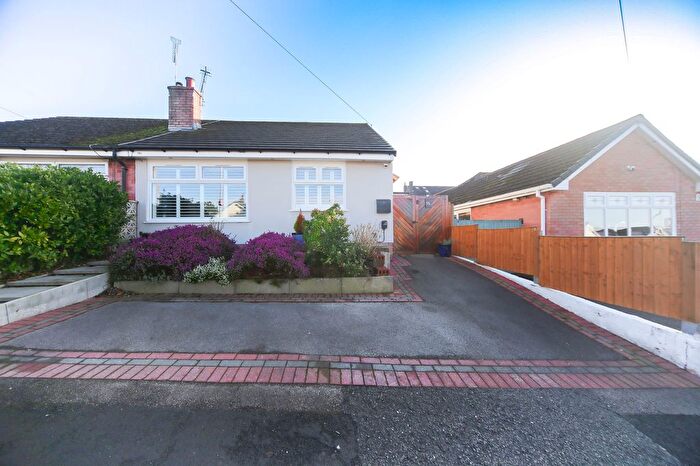
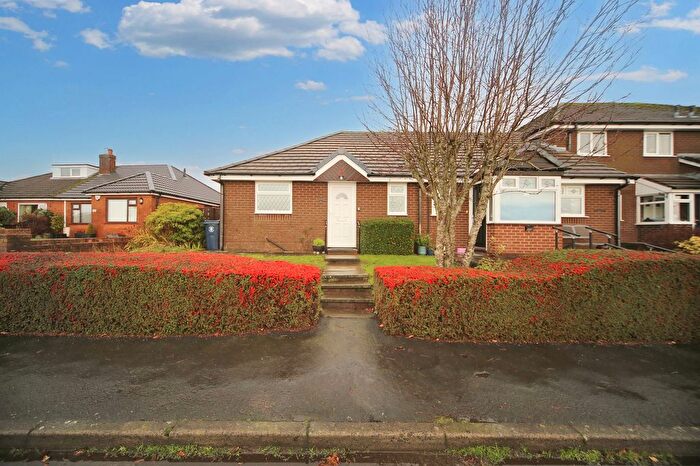
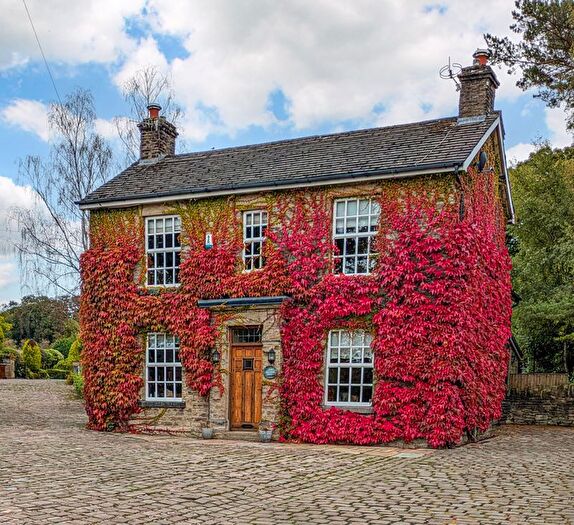
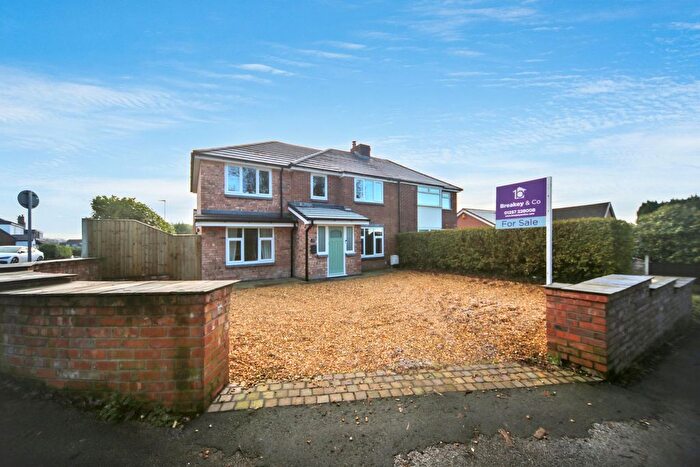
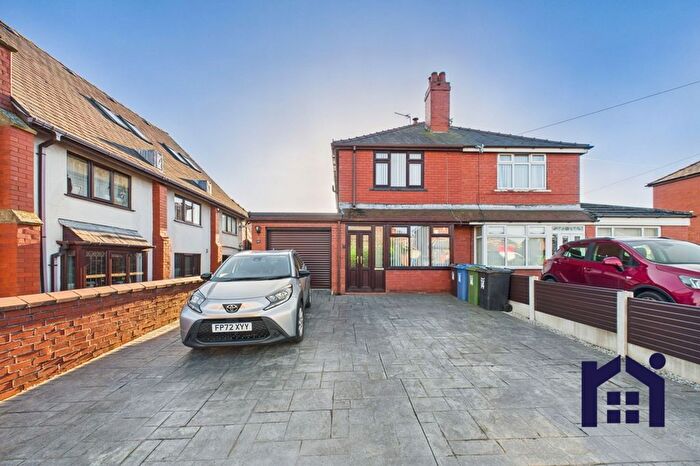
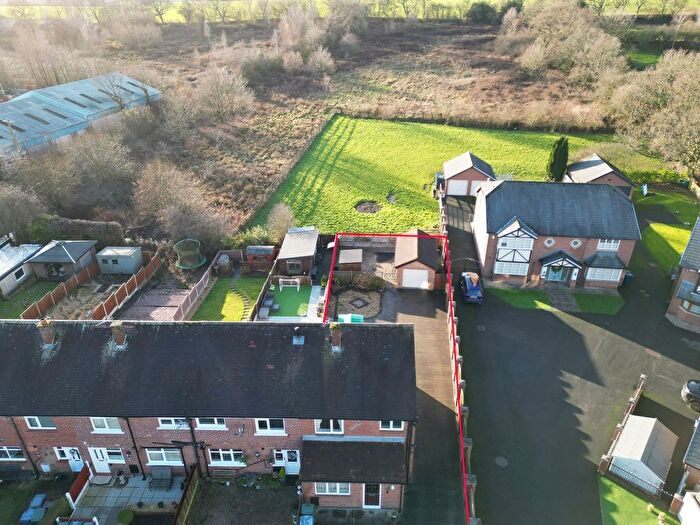
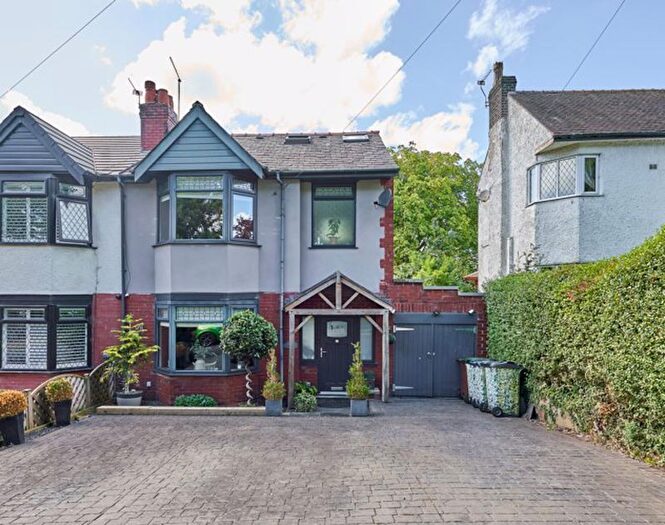
Properties for sale in Wrightington
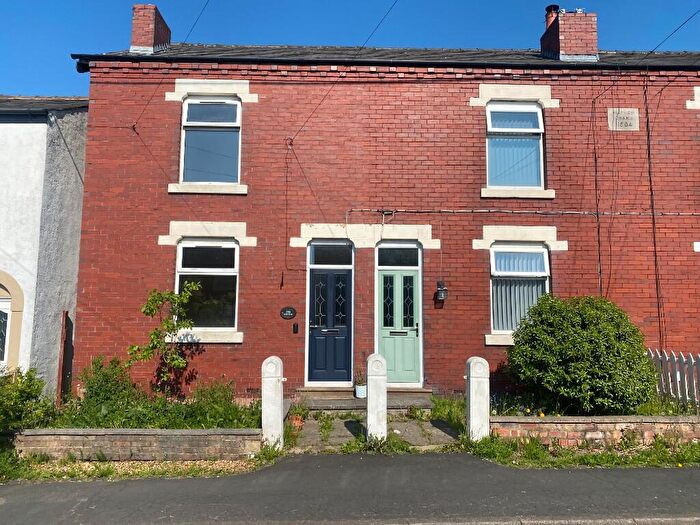
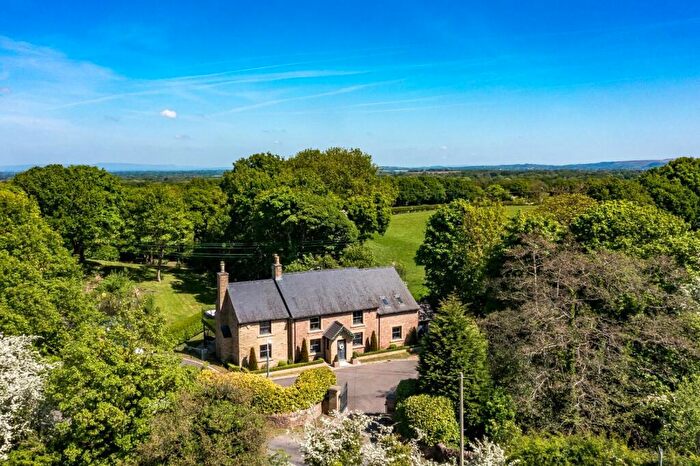
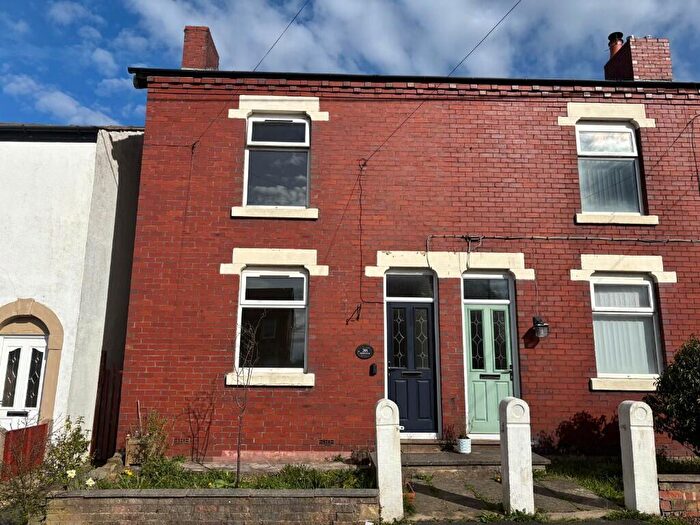
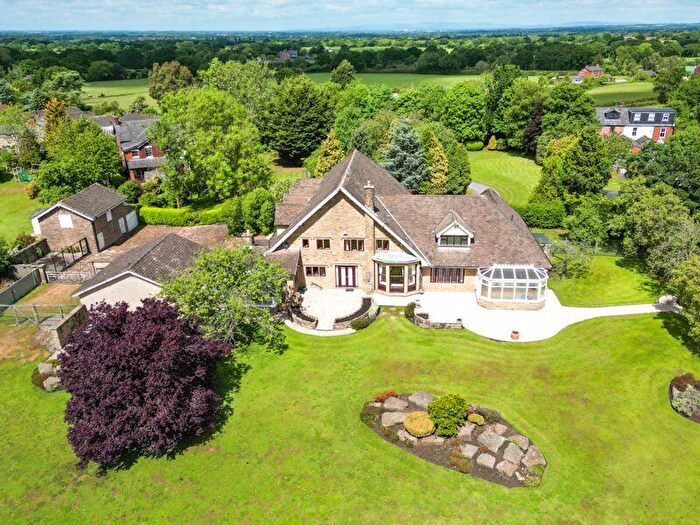
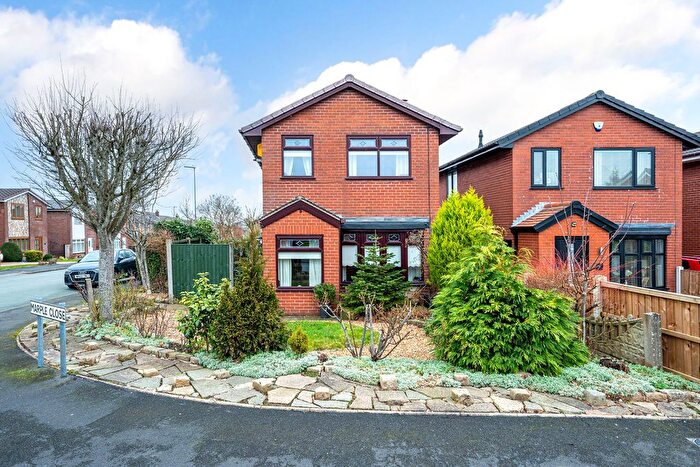
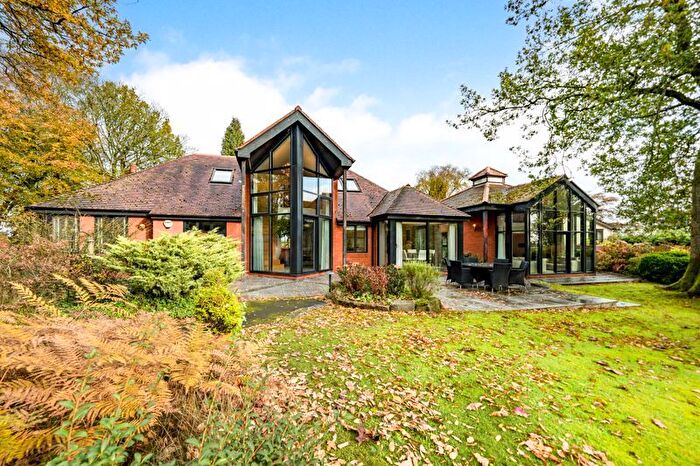
Previously listed properties in Wrightington
Roads and Postcodes in Wrightington
Navigate through our locations to find the location of your next house in Wrightington, Wigan for sale or to rent.
| Streets | Postcodes |
|---|---|
| Ainscough Business Park | WN6 9RS |
| Apple Hey | WN6 9HF |
| Apple Lane | WN6 9BE |
| Appley Close | WN6 9HA |
| Appley Lane North | WN6 9AD WN6 9AN WN6 9AP WN6 9AQ WN6 9DS WN6 9DX WN6 9DY WN6 9AB WN6 9AE |
| Appley Lane South | WN6 9AR |
| Ashfield Terrace | WN6 9AG |
| Back Skull House Lane | WN6 9DP |
| Beacon View | WN6 9AJ |
| Broadhurst Lane | WN6 9RX WN6 9RY |
| Canal Bank | WN6 9AW |
| Carr House Lane | WN6 9SH WN6 9SJ |
| Chisnall Avenue | WN6 9RR |
| Church Lane | WN6 9SL WN6 9SN WN6 9SP |
| Coronet Close | WN6 9AY |
| Courage Low Lane | WN6 9PJ |
| Dawber Delph | WN6 9LN |
| Dobson Close | WN6 9ES |
| Farrier Way | WN6 9AZ |
| Finch Lane | WN6 9DT WN6 9DU |
| Glenside | WN6 9EF WN6 9EG |
| Graham Avenue | WN6 9EA |
| Hall Lane | WN6 9EL WN6 9EN WN6 9EQ WN6 9EW WN6 9EJ WN6 9EP |
| Heyes Street | WN6 9AS |
| High Moor | WN6 9PA |
| High Moor Lane | WN6 9PS WN6 9PX WN6 9QA |
| Hill House Fold Lane | WN6 9PR |
| Hinds Head Avenue | WN6 9RT |
| Hunters Hill | WN6 9QD |
| Lowther Terrace | WN6 9AL |
| Manse Avenue | WN6 9RP |
| Mill Lane | WN6 9DA WN8 7RZ |
| Millbank | WN6 9LJ |
| Moss Lane | WN6 9PB WN6 9PE WN6 9PF WN6 9PD |
| Mossfields | WN6 9RU |
| Mossy Lea Road | WN6 9RD WN6 9RE WN6 9RL WN6 9RN WN6 9RW WN6 9RZ WN6 9SA WN6 9SB WN6 9RB WN6 9RF |
| North Drive | WN6 9DZ |
| Orchard Gardens | WN6 9SR |
| Robin Hood Lane | WN6 9PY WN6 9PZ WN6 9QG WN6 9QQ |
| Rookery Fold | WN6 9SS |
| Skull House Lane | WN6 9DJ WN6 9DR WN6 9DB WN6 9DW WN6 9EU |
| Skull House Mews | WN6 9DN |
| Smithy Brow | WN6 9PW WN6 9PP |
| South Drive | WN6 9EB |
| Speakmans Drive | WN6 9AT |
| Spring Bank | WN6 9AH |
| Sprodley Drive | WN6 9EE |
| Stonemill Rise | WN6 9BH |
| Stoneygate Lane | WN6 9ED |
| The Grove | WN6 9HB |
| The Vale | WN6 9HD |
| Toogood Lane | WN6 9PL WN6 9PN |
| Tunley Lane | WN6 9RG WN6 9RH WN6 9RJ |
| Tunley Moss | WN6 9RQ |
| Wood Lane | WN6 9SQ |
| Wrightington Bar | WN6 9SD WN6 9SF |
| WN6 9DL WN6 9SE |
Transport near Wrightington
- FAQ
- Price Paid By Year
- Property Type Price
Frequently asked questions about Wrightington
What is the average price for a property for sale in Wrightington?
The average price for a property for sale in Wrightington is £334,058. This amount is 7% lower than the average price in Wigan. There are 661 property listings for sale in Wrightington.
What streets have the most expensive properties for sale in Wrightington?
The streets with the most expensive properties for sale in Wrightington are Carr House Lane at an average of £850,000, Finch Lane at an average of £722,833 and Orchard Gardens at an average of £690,000.
What streets have the most affordable properties for sale in Wrightington?
The streets with the most affordable properties for sale in Wrightington are Mossfields at an average of £113,500, Heyes Street at an average of £150,000 and Broadhurst Lane at an average of £160,000.
Which train stations are available in or near Wrightington?
Some of the train stations available in or near Wrightington are Appley Bridge, Parbold and Gathurst.
Property Price Paid in Wrightington by Year
The average sold property price by year was:
| Year | Average Sold Price | Price Change |
Sold Properties
|
|---|---|---|---|
| 2025 | £344,562 | -1% |
24 Properties |
| 2024 | £346,777 | 13% |
44 Properties |
| 2023 | £302,838 | -5% |
26 Properties |
| 2022 | £317,376 | 7% |
38 Properties |
| 2021 | £296,322 | -9% |
53 Properties |
| 2020 | £322,945 | 12% |
33 Properties |
| 2019 | £283,132 | 12% |
45 Properties |
| 2018 | £249,616 | -15% |
34 Properties |
| 2017 | £287,278 | 13% |
39 Properties |
| 2016 | £248,934 | 4% |
35 Properties |
| 2015 | £237,890 | -11% |
38 Properties |
| 2014 | £263,761 | 6% |
58 Properties |
| 2013 | £248,629 | 19% |
42 Properties |
| 2012 | £201,955 | -9% |
35 Properties |
| 2011 | £219,525 | -26% |
36 Properties |
| 2010 | £276,568 | -32% |
49 Properties |
| 2009 | £366,045 | 32% |
20 Properties |
| 2008 | £248,242 | 0,3% |
26 Properties |
| 2007 | £247,577 | -1% |
48 Properties |
| 2006 | £249,879 | 8% |
45 Properties |
| 2005 | £230,386 | 3% |
41 Properties |
| 2004 | £223,403 | 26% |
44 Properties |
| 2003 | £165,851 | 9% |
57 Properties |
| 2002 | £150,175 | 30% |
50 Properties |
| 2001 | £104,679 | 9% |
44 Properties |
| 2000 | £95,596 | 6% |
51 Properties |
| 1999 | £90,037 | 9% |
44 Properties |
| 1998 | £81,924 | -12% |
38 Properties |
| 1997 | £91,957 | 12% |
52 Properties |
| 1996 | £80,800 | 1% |
28 Properties |
| 1995 | £79,640 | - |
28 Properties |
Property Price per Property Type in Wrightington
Here you can find historic sold price data in order to help with your property search.
The average Property Paid Price for specific property types in the last three years are:
| Property Type | Average Sold Price | Sold Properties |
|---|---|---|
| Semi Detached House | £240,980.00 | 35 Semi Detached Houses |
| Detached House | £520,159.00 | 36 Detached Houses |
| Terraced House | £191,165.00 | 21 Terraced Houses |
| Flat | £113,500.00 | 2 Flats |

