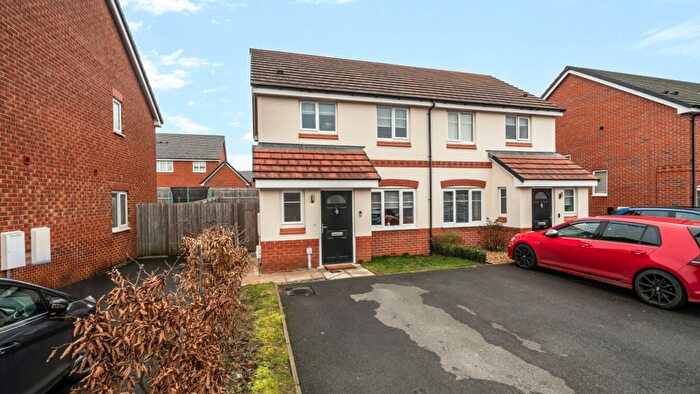
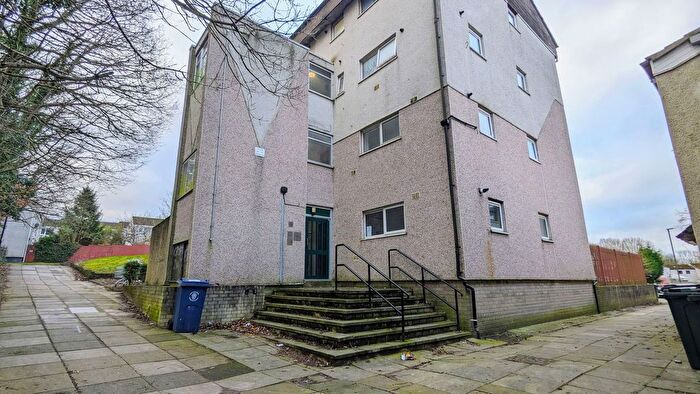
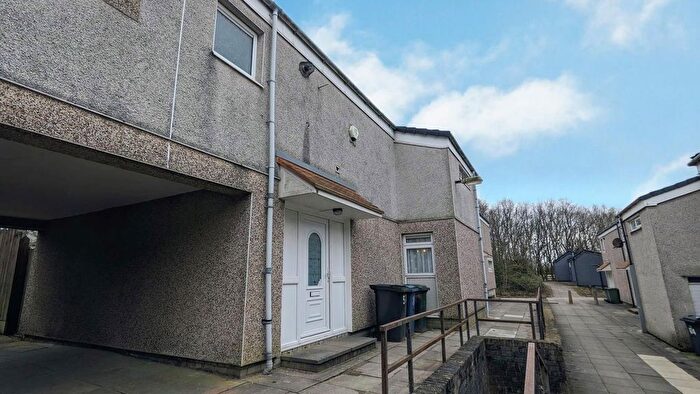
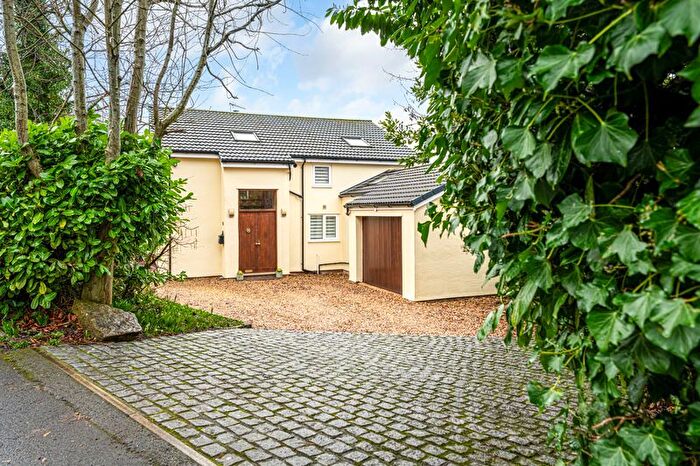
Houses for sale & to rent in Parbold, Wigan
House Prices in Parbold
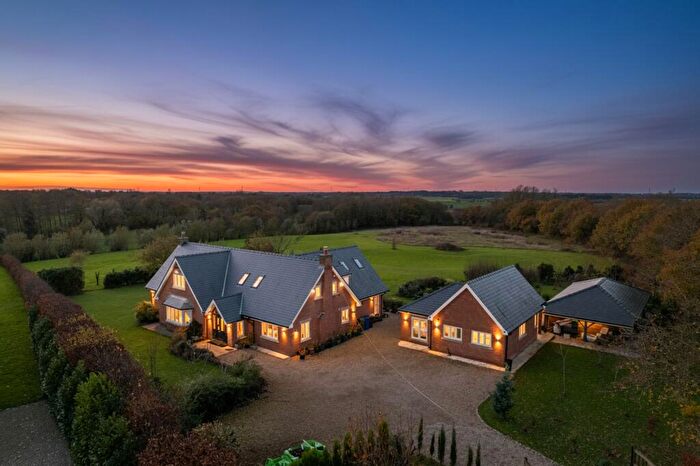
Properties in Parbold have an average house price of £402,569.00 and had 121 Property Transactions within the last 3 years¹.
Parbold is an area in Wigan, Lancashire with 1,415 households², where the most expensive property was sold for £2,700,000.00.
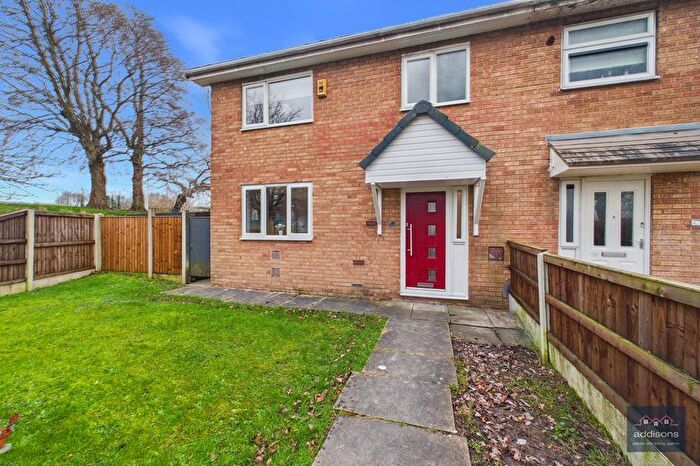
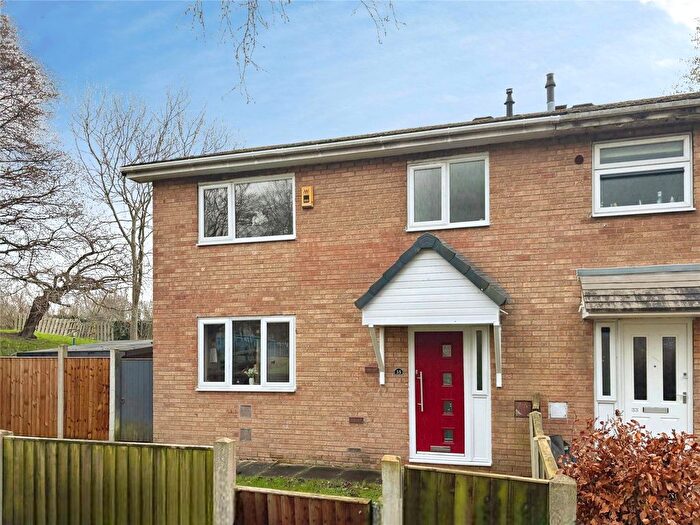
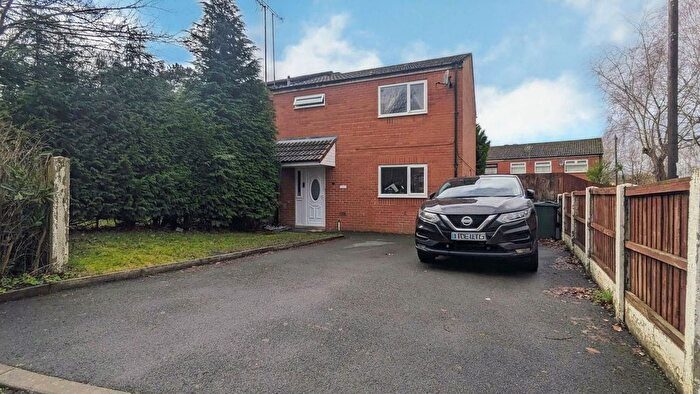
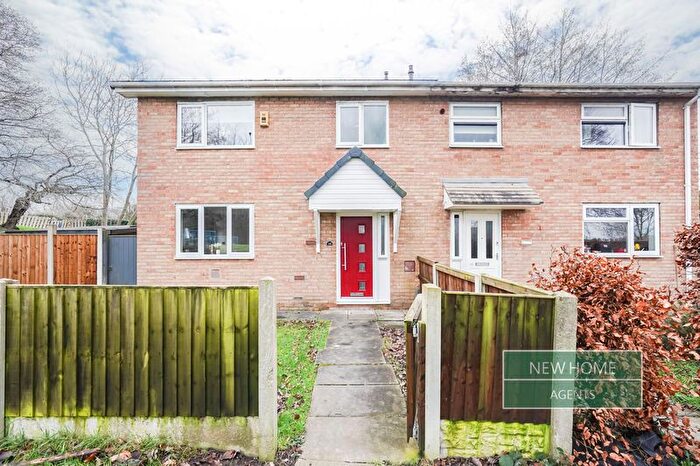
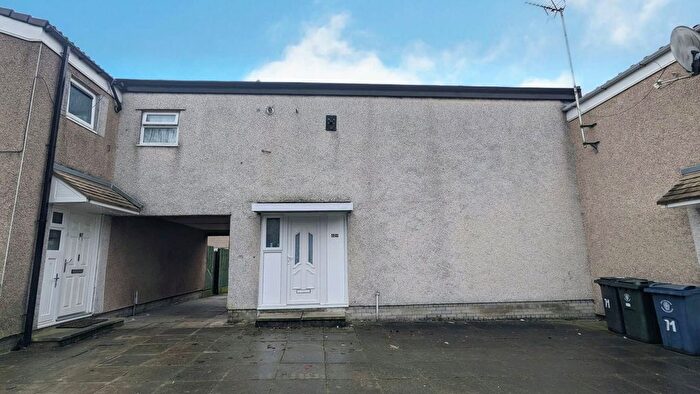
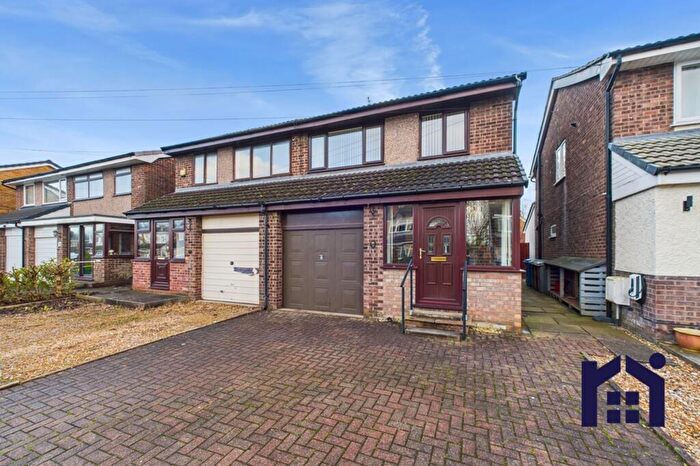
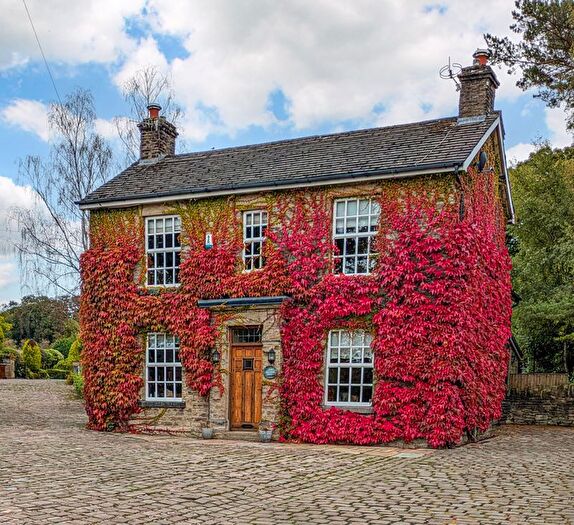
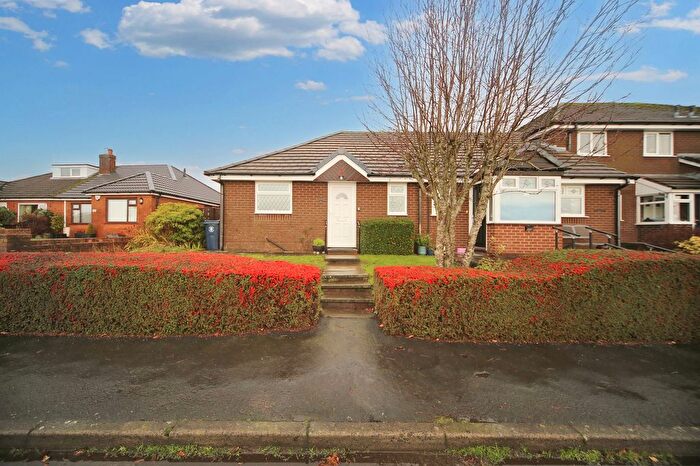
Properties for sale in Parbold
Roads and Postcodes in Parbold
Navigate through our locations to find the location of your next house in Parbold, Wigan for sale or to rent.
| Streets | Postcodes |
|---|---|
| Alder Lane | WN8 7HY WN8 7JH WN8 7NL WN8 7NN |
| Alderbrook Drive | WN8 7HF |
| Bankside | WN8 7PJ |
| Beacon Crossing | WN8 7DR |
| Beacon Lane | WN8 7RR WN8 7RU |
| Beech Avenue | WN8 7NS |
| Beechfield | WN8 7AR |
| Bradshaw Lane | WN8 7NQ |
| Bramble Way | WN8 7HZ |
| Brandreth Delph | WN8 7AQ |
| Brandreth Drive | WN8 7HB WN8 7HD |
| Brandreth Park | WN8 7AG |
| Broadhey Lane | WN6 9BD |
| Broadmead | WN8 7PB |
| Brookfield | WN8 7JJ |
| Burnside | WN8 7PD WN8 7PE |
| Chapel Lane | WN8 7TN |
| Chorley Road | WN8 7AL WN8 7AN WN8 7AS |
| Convent Grove | WN8 7JA |
| Croasdale Drive | WN8 7HR |
| Crow Lane | WN8 7RX WN8 7RY |
| Dale Close | WN8 7DL |
| Dungeon Lane | WN8 7RH |
| Eastdene | WN8 7PF |
| Fairhurst Drive | WN8 7DJ WN8 7DP |
| Greenfield Avenue | WN8 7DH |
| Grimshaw Green Lane | WN8 7BB |
| Hall Lane | WN6 9EH WN8 7BD |
| High Moor Lane | WN6 9PT |
| Higher Lane | WN8 7RA WN8 7RP WN8 7TW |
| Hillock Lane | WN8 7RJ |
| Hillside Avenue | WN8 7AW |
| Lancaster Lane | WN8 7AA WN8 7HQ WN8 7HS WN8 7AB WN8 7HT |
| Lathom Avenue | WN8 7DT |
| Lees Lane | WN8 7RB WN8 7RD WN8 7RE WN8 7RF |
| Lindley Drive | WN8 7ED |
| Long Heys Lane | WN8 7RS WN8 7RT |
| Mill Lane | WN8 7NW |
| Mill Leat Close | WN8 7NJ |
| Mill Leat Mews | WN8 7NH |
| Millfield | WN8 7NP |
| Miry Lane | WN8 7TA |
| Northdene | WN8 7PH |
| Parbold Hill | WN8 7TG WN8 7TQ |
| Park Close | WN8 7HP |
| Robin Lane | WN8 7BE |
| Scarisbrick Avenue | WN8 7HE |
| Southdene | WN8 7PQ |
| Springmount Drive | WN8 7AP |
| Station Road | WN8 7NU |
| Stoney Lane | WN6 9QE WN8 7AF WN6 9QF |
| Tan House Close | WN8 7HH |
| Tan House Lane | WN8 7HG |
| Tanfield Nook | WN8 7DQ |
| The Bungalows | WN8 7BA |
| The Common | WN8 7AE WN8 7DA WN8 7DS WN8 7EA WN8 7EB WN8 7HA WN8 7DB |
| The Delph | WN8 7AD |
| The Green | WN8 7DN |
| The Heys | WN8 7DU |
| West View | WN8 7NT |
| Westdene | WN8 7PG |
| Whittle Lane | WN6 9QB |
| Wood Lane | WN8 7TH |
Transport near Parbold
- FAQ
- Price Paid By Year
- Property Type Price
Frequently asked questions about Parbold
What is the average price for a property for sale in Parbold?
The average price for a property for sale in Parbold is £402,569. This amount is 13% higher than the average price in Wigan. There are 722 property listings for sale in Parbold.
What streets have the most expensive properties for sale in Parbold?
The streets with the most expensive properties for sale in Parbold are Higher Lane at an average of £1,643,750, Stoney Lane at an average of £1,550,000 and Hillock Lane at an average of £807,500.
What streets have the most affordable properties for sale in Parbold?
The streets with the most affordable properties for sale in Parbold are Beacon Crossing at an average of £120,000, Westdene at an average of £190,000 and Hillside Avenue at an average of £200,000.
Which train stations are available in or near Parbold?
Some of the train stations available in or near Parbold are Parbold, Hoscar and Appley Bridge.
Property Price Paid in Parbold by Year
The average sold property price by year was:
| Year | Average Sold Price | Price Change |
Sold Properties
|
|---|---|---|---|
| 2025 | £376,460 | -4% |
25 Properties |
| 2024 | £390,616 | -9% |
47 Properties |
| 2023 | £427,354 | 1% |
49 Properties |
| 2022 | £423,376 | 16% |
48 Properties |
| 2021 | £357,126 | 9% |
62 Properties |
| 2020 | £323,318 | -8% |
48 Properties |
| 2019 | £349,342 | 1% |
47 Properties |
| 2018 | £344,666 | 8% |
72 Properties |
| 2017 | £317,097 | 3% |
55 Properties |
| 2016 | £306,214 | - |
46 Properties |
| 2015 | £306,325 | 16% |
50 Properties |
| 2014 | £256,156 | -14% |
57 Properties |
| 2013 | £292,019 | 11% |
57 Properties |
| 2012 | £259,434 | -29% |
46 Properties |
| 2011 | £334,023 | 18% |
30 Properties |
| 2010 | £274,795 | -14% |
37 Properties |
| 2009 | £314,398 | -8% |
25 Properties |
| 2008 | £338,702 | -1% |
33 Properties |
| 2007 | £341,753 | 16% |
57 Properties |
| 2006 | £286,844 | 19% |
79 Properties |
| 2005 | £231,012 | 8% |
50 Properties |
| 2004 | £212,608 | 4% |
63 Properties |
| 2003 | £203,197 | 24% |
65 Properties |
| 2002 | £153,895 | 19% |
79 Properties |
| 2001 | £124,591 | 8% |
74 Properties |
| 2000 | £114,941 | 18% |
69 Properties |
| 1999 | £94,628 | -21% |
67 Properties |
| 1998 | £114,303 | 17% |
71 Properties |
| 1997 | £94,605 | -1% |
69 Properties |
| 1996 | £95,927 | 20% |
61 Properties |
| 1995 | £77,180 | - |
55 Properties |
Property Price per Property Type in Parbold
Here you can find historic sold price data in order to help with your property search.
The average Property Paid Price for specific property types in the last three years are:
| Property Type | Average Sold Price | Sold Properties |
|---|---|---|
| Semi Detached House | £288,462.00 | 56 Semi Detached Houses |
| Detached House | £600,084.00 | 47 Detached Houses |
| Terraced House | £252,613.00 | 13 Terraced Houses |
| Flat | £213,799.00 | 5 Flats |

