
Houses for sale & to rent in Calverley And Farsley, Leeds
House Prices in Calverley And Farsley
Properties in Calverley And Farsley have an average house price of £243,219.00 and had 121 Property Transactions within the last 3 years¹.
Calverley And Farsley is an area in Leeds, Leeds with 673 households², where the most expensive property was sold for £477,129.00.
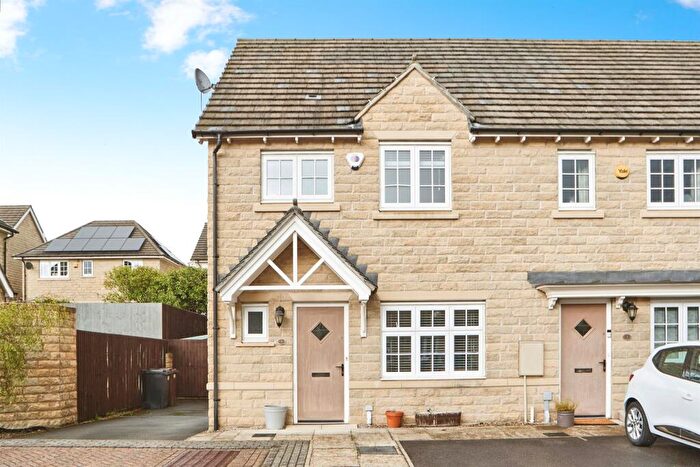
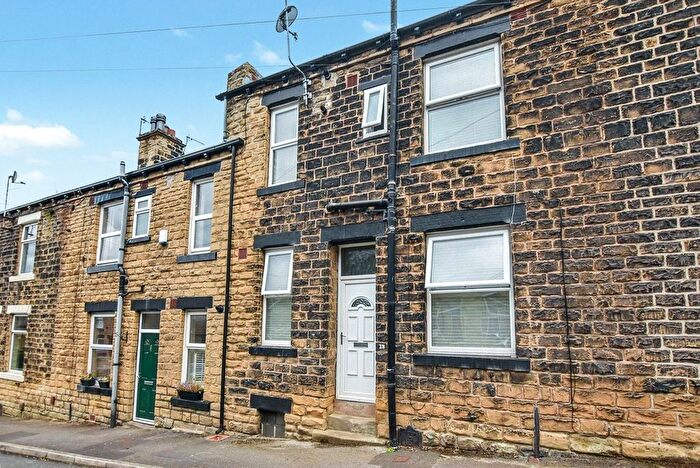
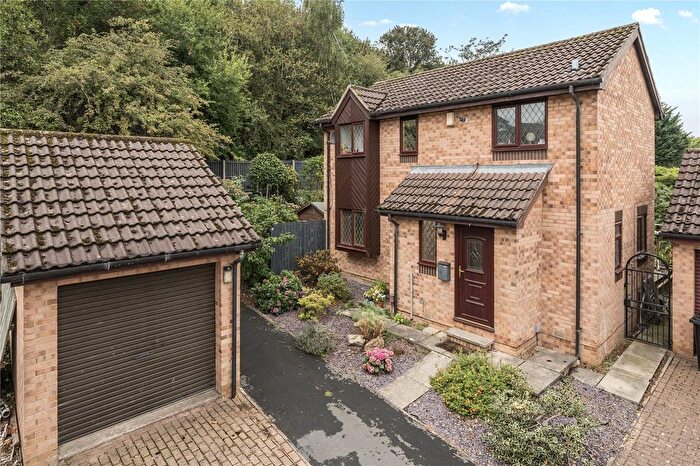
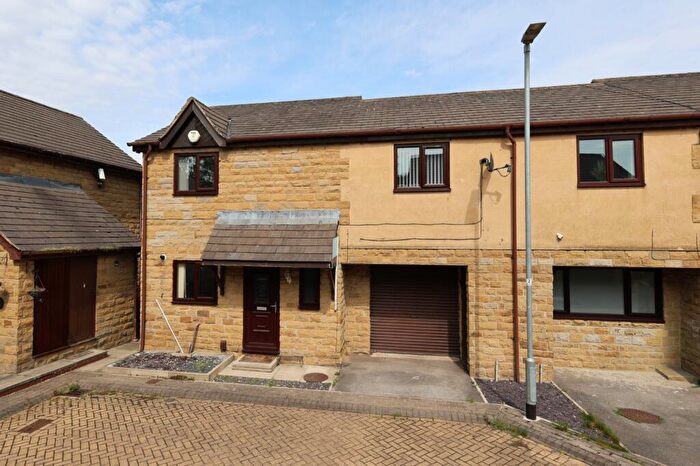
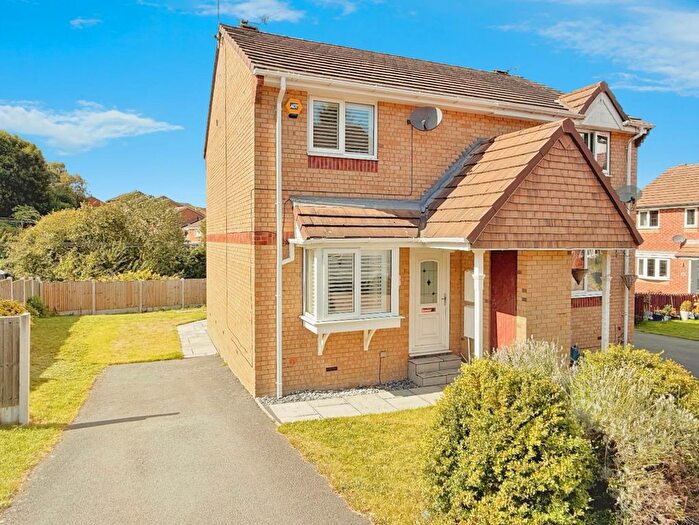
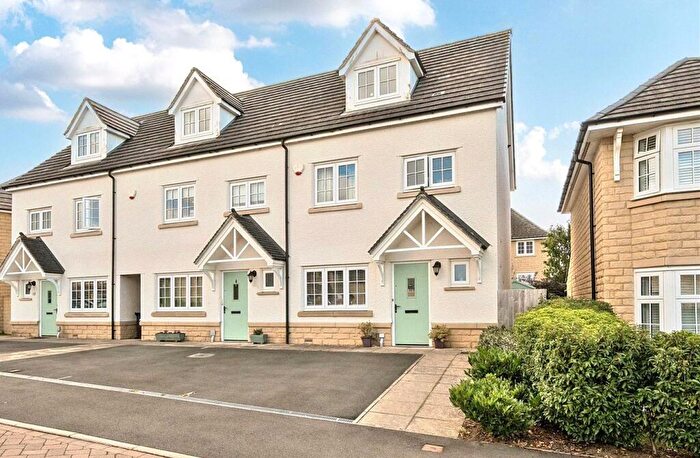
Properties for sale in Calverley And Farsley


![]()
If you are looking to sell your house, let it out, or receive a property valuation, an expert can help you.
Click the button below to get started.


Roads and Postcodes in Calverley And Farsley
Navigate through our locations to find the location of your next house in Calverley And Farsley, Leeds for sale or to rent.
| Streets | Postcodes |
|---|---|
| Airedale Mount | LS13 1JD |
| Bagley Lane | LS13 1HR LS13 1JA |
| Bridge Road | LS13 1LR |
| Bridge View | LS13 1LS |
| Brookfield Avenue | LS13 1NL |
| Brookfield Court | LS13 1ND |
| Brookfield Gardens | LS13 1NN |
| Calverley Bridge | LS13 1NF LS13 1NW |
| Canal Road | LS13 1HT |
| Chandlers Wharf | LS13 1PX |
| Chapel Street | LS13 1LL |
| Chiltern Court | LS13 1PT |
| Dalmeny Terrace | LS13 1LN |
| Georgian Square | LS13 1PZ |
| Hawthorn Drive | LS13 1NJ |
| Hawthorn Grove | LS13 1NH |
| Horsforth New Road | LS13 1NU |
| Knox Street | LS13 1LZ |
| Luther Street | LS13 1LU |
| Navigation Court | LS13 1NY |
| Oaklands Avenue | LS13 1LH |
| Oaklands Grove | LS13 1LE |
| Oaklands Road | LS13 1LF LS13 1LQ LS28 5FT |
| Orchard Mews | LS13 1PQ |
| Petrie Crescent | LS13 1NT |
| Petrie Street | LS13 1NA |
| Prospect Terrace | LS13 1HY |
| Prospect View | LS13 1HX |
| Rialto Court | LS13 1QD |
| Rodley Lane | LS13 1HU LS13 1LB LS13 1LJ LS13 1LT LS13 1NG |
| Towler Drive | LS13 1PB |
| Wycliffe Close | LS13 1LX |
| Wycliffe Road | LS13 1LY |
| Yewdall Road | LS13 1NB |
Transport near Calverley And Farsley
-
 New Pudsey Station
 -
Bramley (West Yorkshire) Station
-
Kirkstall Forge Station
-
Apperley Bridge Station
-
Horsforth Station
-
Headingley Station
- FAQ
- Price Paid By Year
- Property Type Price
Frequently asked questions about Calverley And Farsley
What is the average price for a property for sale in Calverley And Farsley?
The average price for a property for sale in Calverley And Farsley is £243,219. This amount is 3% lower than the average price in Leeds. There are 984 property listings for sale in Calverley And Farsley.
What streets have the most expensive properties for sale in Calverley And Farsley?
The streets with the most expensive properties for sale in Calverley And Farsley are Airedale Mount at an average of £379,043, Canal Road at an average of £350,000 and Bridge View at an average of £321,150.
What streets have the most affordable properties for sale in Calverley And Farsley?
The streets with the most affordable properties for sale in Calverley And Farsley are Rialto Court at an average of £99,000, Brookfield Court at an average of £117,185 and Rodley Lane at an average of £150,142.
Which train stations are available in or near Calverley And Farsley?
Some of the train stations available in or near Calverley And Farsley are New Pudsey, Bramley (West Yorkshire) and Kirkstall Forge.
Property Price Paid in Calverley And Farsley by Year
The average sold property price by year was:
| Year | Average Sold Price | Price Change |
Sold Properties
|
|---|---|---|---|
| 2025 | £247,194 | 1% |
21 Properties |
| 2024 | £245,161 | 6% |
26 Properties |
| 2023 | £229,961 | -8% |
26 Properties |
| 2022 | £247,610 | 7% |
48 Properties |
| 2021 | £229,360 | 3% |
50 Properties |
| 2020 | £223,448 | 8% |
39 Properties |
| 2019 | £206,335 | 12% |
58 Properties |
| 2018 | £182,169 | -1% |
38 Properties |
| 2017 | £184,164 | 10% |
50 Properties |
| 2016 | £165,208 | -11% |
51 Properties |
| 2015 | £183,572 | 12% |
47 Properties |
| 2014 | £161,678 | 20% |
51 Properties |
| 2013 | £129,574 | -35% |
33 Properties |
| 2012 | £174,424 | 9% |
30 Properties |
| 2011 | £158,758 | -4% |
29 Properties |
| 2010 | £165,147 | 25% |
17 Properties |
| 2009 | £123,537 | -39% |
54 Properties |
| 2008 | £171,448 | -18% |
77 Properties |
| 2007 | £202,956 | 23% |
55 Properties |
| 2006 | £156,563 | 4% |
49 Properties |
| 2005 | £150,325 | 4% |
41 Properties |
| 2004 | £143,779 | 11% |
42 Properties |
| 2003 | £128,157 | 26% |
27 Properties |
| 2002 | £95,291 | 17% |
29 Properties |
| 2001 | £79,260 | 18% |
30 Properties |
| 2000 | £65,116 | -13% |
37 Properties |
| 1999 | £73,392 | 19% |
69 Properties |
| 1998 | £59,440 | 10% |
39 Properties |
| 1997 | £53,777 | 2% |
39 Properties |
| 1996 | £52,477 | -1% |
35 Properties |
| 1995 | £52,986 | - |
21 Properties |
Property Price per Property Type in Calverley And Farsley
Here you can find historic sold price data in order to help with your property search.
The average Property Paid Price for specific property types in the last three years are:
| Property Type | Average Sold Price | Sold Properties |
|---|---|---|
| Semi Detached House | £272,327.00 | 34 Semi Detached Houses |
| Terraced House | £265,696.00 | 58 Terraced Houses |
| Flat | £155,001.00 | 28 Flats |
| Detached House | £420,000.00 | 1 Detached House |