
Houses for sale in Leeds, Leeds
House Prices in Leeds
Properties in Leeds have an average house price of £253k and had 25,397 Property Transactions within the last 3 years.¹
Leeds is an area in Leeds with 289,043 households², where the most expensive property was sold for £3.25M.
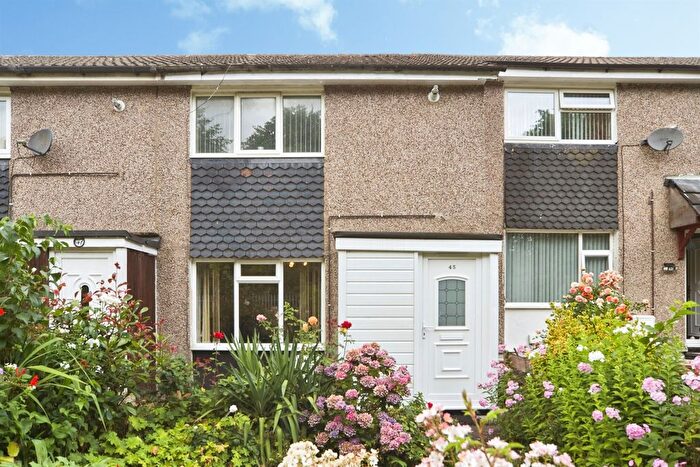
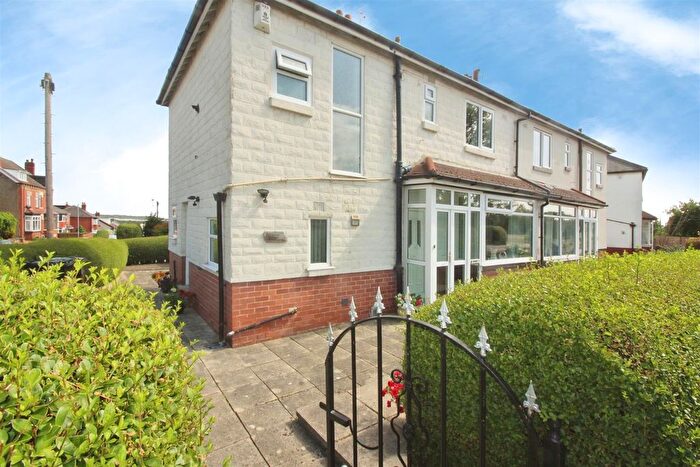
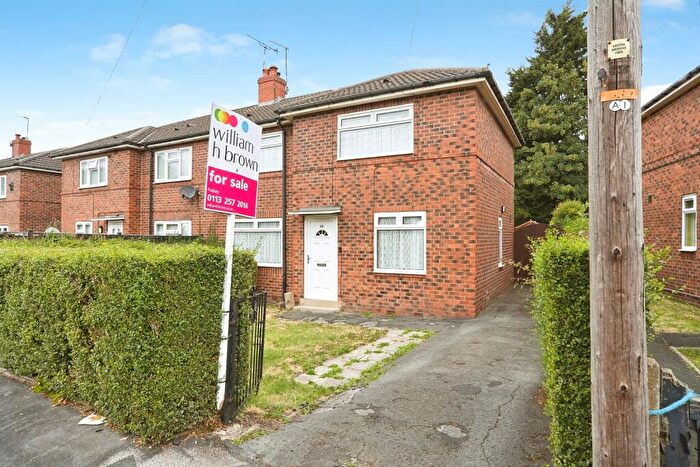
Properties for sale in Leeds


![]()
If you are looking to sell your house, let it out, or receive a property valuation, an expert can help you.
Click the button below to get started.


Neighbourhoods in Leeds
Navigate through our locations to find the location of your next house in Leeds, Leeds for sale or to rent.
- Adel And Wharfedale
- Alwoodley
- Ardsley And Robin Hood
- Armley
- Beeston And Holbeck
- Bramley And Stanningley
- Burmantofts And Richmond Hill
- Calverley And Farsley
- Chapel Allerton
- City And Hunslet
- Cross Gates And Whinmoor
- Farnley And Wortley
- Garforth And Swillington
- Gipton And Harehills
- Guiseley And Rawdon
- Harewood
- Headingley
- Horsforth
- Hyde Park And Woodhouse
- Killingbeck And Seacroft
- Kippax And Methley
- Kirkstall
- Middleton Park
- Moortown
- Morley North
- Morley South
- Otley And Yeadon
- Pudsey
- Rothwell
- Roundhay
- Temple Newsam
- Weetwood
- Little London & Woodhouse
- Hunslet & Riverside
- Beeston & Holbeck
- Burmantofts & Richmond Hill
- Ardsley & Robin Hood
- Farnley & Wortley
- Bramley & Stanningley
- Calverley & Farsley
- Killingbeck & Seacroft
- Cross Gates & Whinmoor
- Garforth & Swillington
- Adel & Wharfedale
- Otley & Yeadon
- Guiseley & Rawdon
- Headingley & Hyde Park
- Kippax & Methley
- Gipton & Harehills
Property price trends in Leeds
According to the latest Land Registry data, the average home in Leeds sold for £250,472 in 2026. That figure comes from a substantial record of 329,863 sales logged over the past 31 years.
Prices have moved up over the last three years. Compared with 2023, when the typical sale came in around £246,567, that's a rise of roughly 1.6%.
Looking back five years, average prices are up about 5.4% since 2021, a gain of around £12,942 in cash terms.
Zoom out to the past decade for the fuller picture. Back in 2016, homes here averaged £184,762, so the typical sold price has climbed about 35.6% since then, roughly 3.1% a year. Stretch the view to fifteen years and that annual pace holds at about 3%.
Frequently asked questions about Leeds
What is the average price for a property for sale in Leeds?
The average price for a property for sale in Leeds is £253,151. This amount is 3% lower than the average price in Leeds. There are more than 10,000 property listings for sale in Leeds.
What locations have the most expensive properties for sale in Leeds?
The locations with the most expensive properties for sale in Leeds are Adel & Wharfedale at an average of £599,566, Harewood at an average of £485,336 and Adel And Wharfedale at an average of £396,232.
What locations have the most affordable properties for sale in Leeds?
The locations with the most affordable properties for sale in Leeds are Burmantofts And Richmond Hill at an average of £129,620, Gipton And Harehills at an average of £141,191 and Beeston And Holbeck at an average of £153,628.
Which train stations are available in or near Leeds?
Some of the train stations available in or near Leeds are Leeds, Burley Park and Headingley.
Property Price Paid in Leeds by Year
The average sold property price by year was:
| Year | Average Sold Price | Price Change |
Sold Properties
|
|---|---|---|---|
| 2026 | £250,472 | -3% |
571 Properties |
| 2025 | £259,069 | 2% |
8,037 Properties |
| 2024 | £253,907 | 3% |
8,787 Properties |
| 2023 | £246,567 | -2% |
8,002 Properties |
| 2022 | £250,340 | 5% |
9,566 Properties |
| 2021 | £237,530 | 8% |
11,977 Properties |
| 2020 | £219,695 | 7% |
9,252 Properties |
| 2019 | £204,950 | 3% |
10,974 Properties |
| 2018 | £197,879 | 3% |
11,040 Properties |
| 2017 | £191,062 | 3% |
11,374 Properties |
Property Price per Property Type in Leeds
Here you can find historic sold price data in order to help with your property search.
The average Property Paid Price for specific property types in the last three years are:
| Property Type | Average Sold Price | Sold Properties |
|---|---|---|
| Semi Detached House | £268,855.00 | 9,814 Semi Detached Houses |
| Terraced House | £192,068.00 | 8,560 Terraced Houses |
| Detached House | £476,113.00 | 3,213 Detached Houses |
| Flat | £161,909.00 | 3,810 Flats |
Transport in Leeds
Please see below transportation links in this area:
