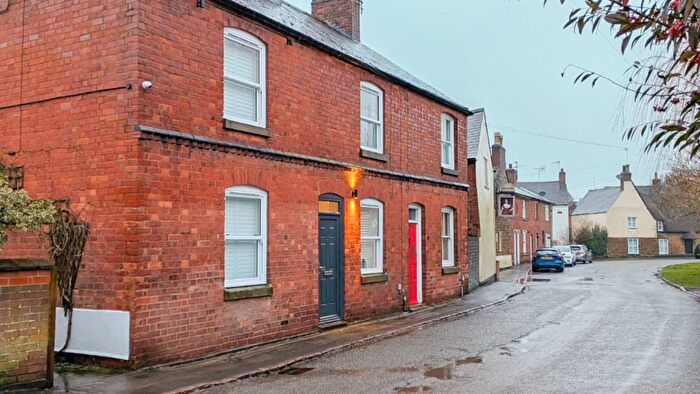
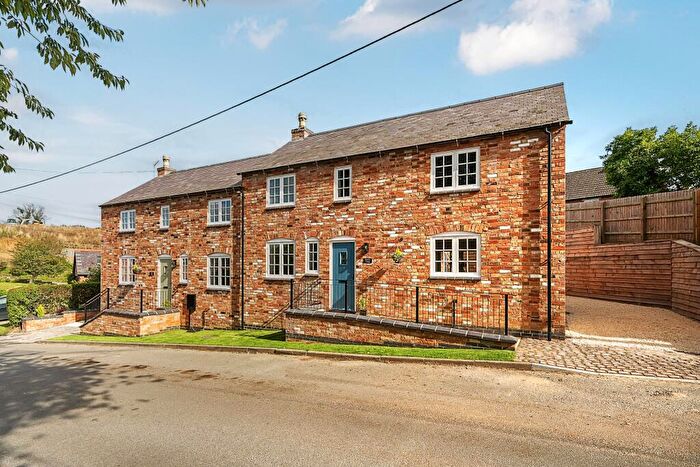
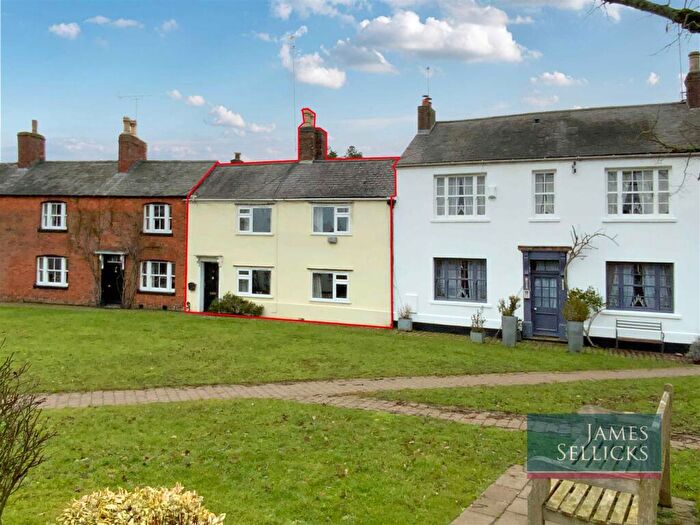
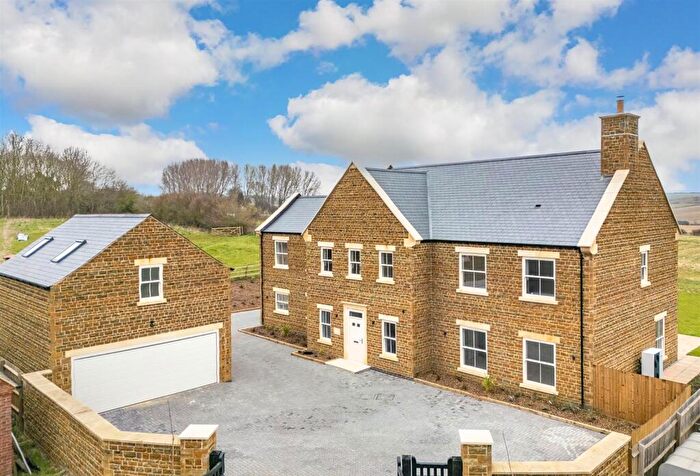
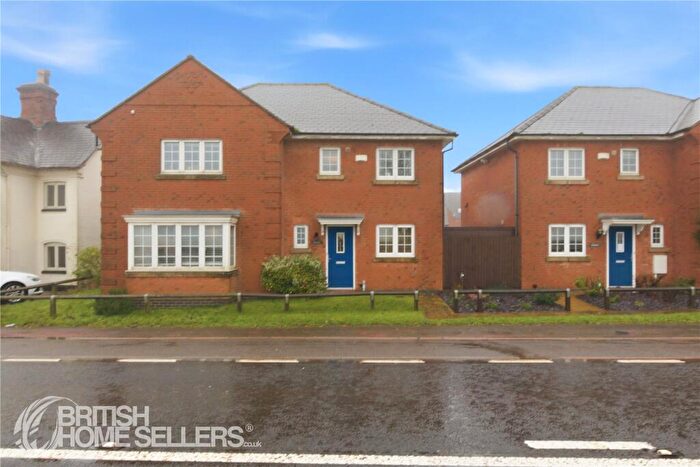
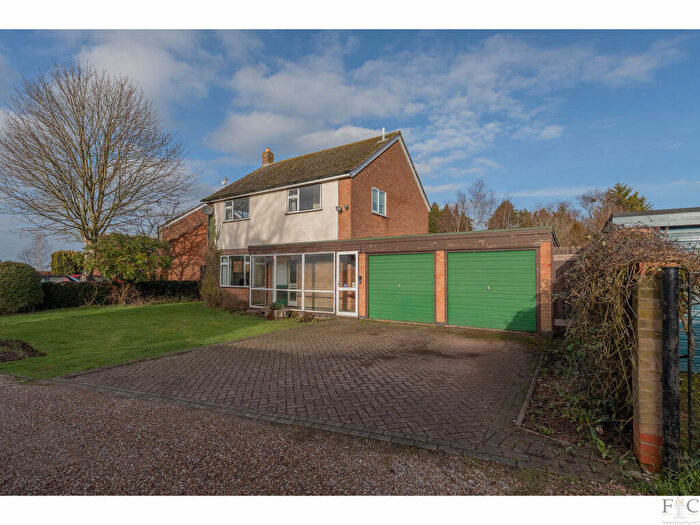
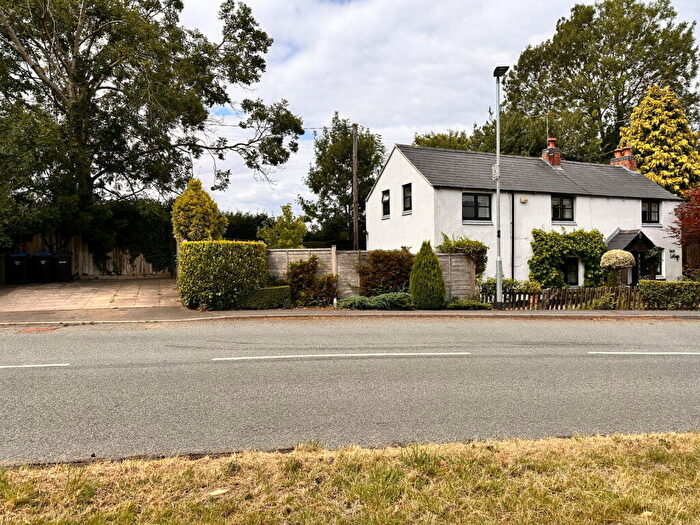
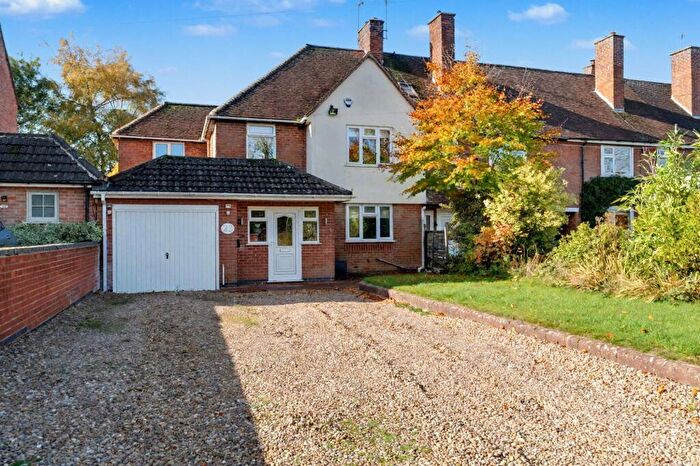
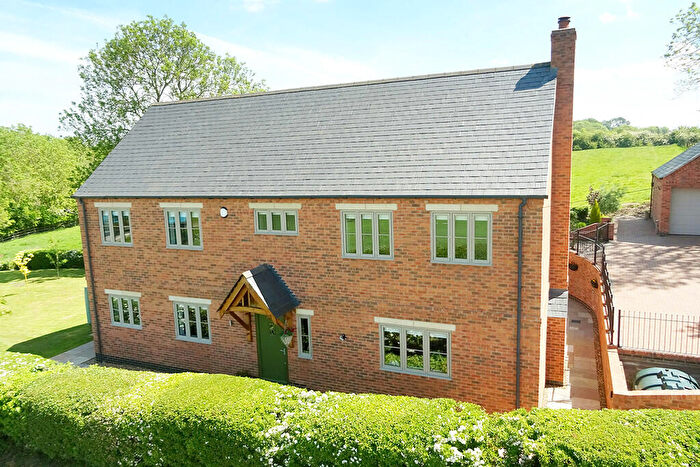
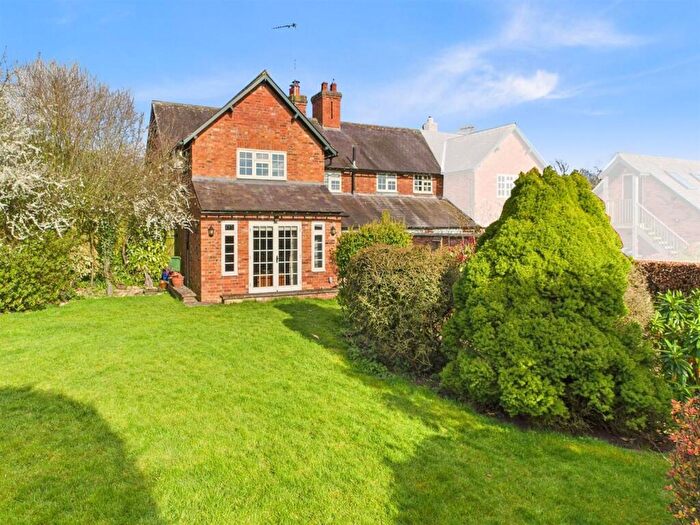
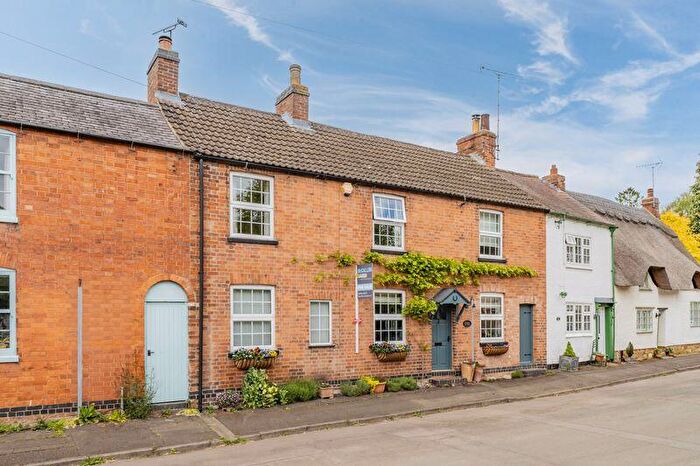
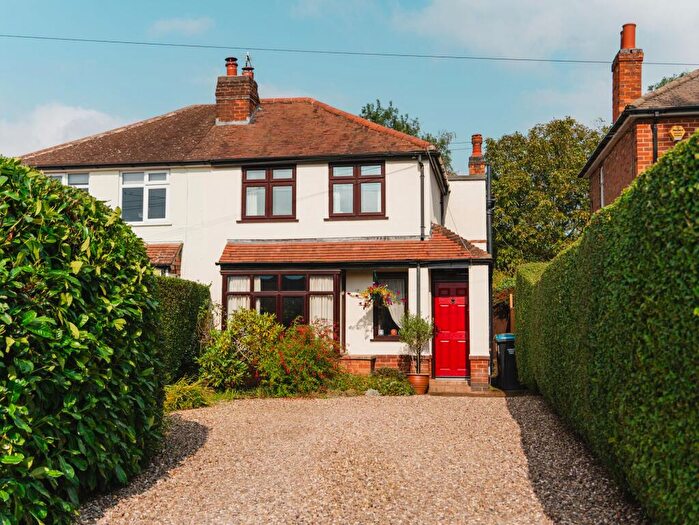
Houses for sale & to rent in Billesdon, Leicester
House Prices in Billesdon
Properties in Billesdon have an average house price of £518,374.00 and had 55 Property Transactions within the last 3 years¹.
Billesdon is an area in Leicester, Leicestershire with 620 households², where the most expensive property was sold for £1,850,000.00.
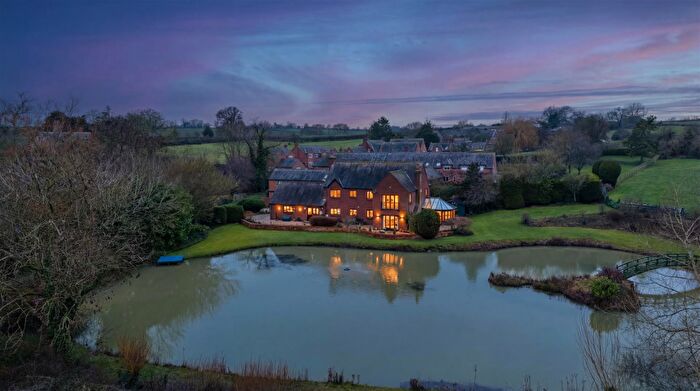
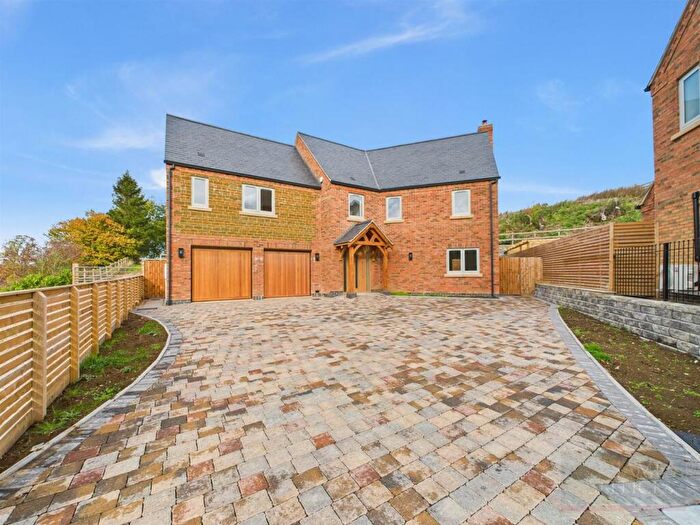
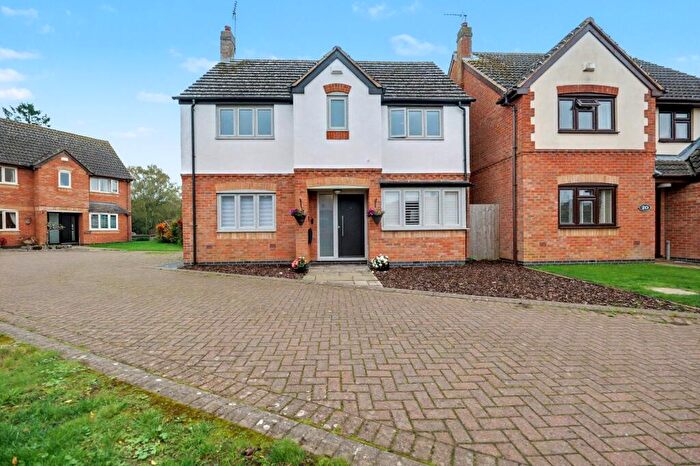
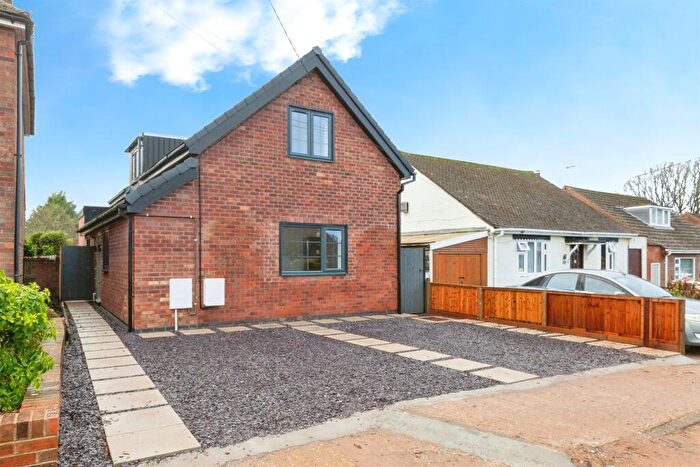
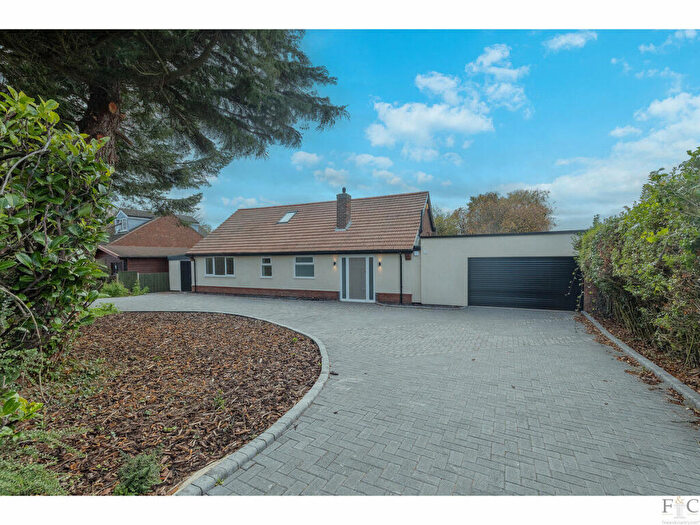
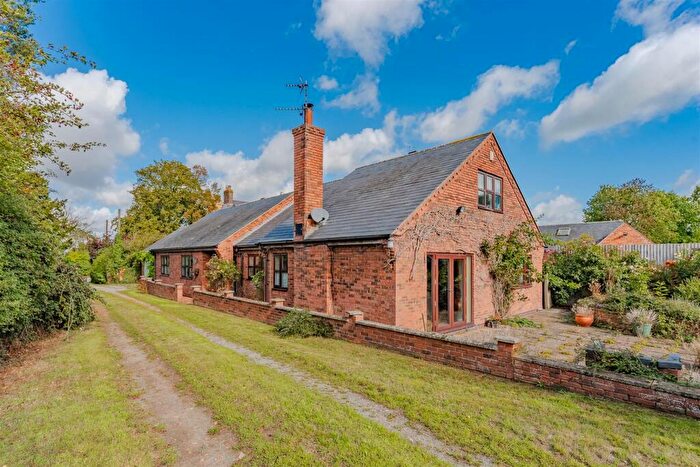
Properties for sale in Billesdon
Roads and Postcodes in Billesdon
Navigate through our locations to find the location of your next house in Billesdon, Leicester for sale or to rent.
| Streets | Postcodes |
|---|---|
| Back Lane | LE7 9LP |
| Brook Lane | LE7 9AB |
| Church Lane | LE7 9EX |
| Church Street | LE7 9AE |
| Coplow Lane | LE7 9AD |
| Forge Court | LE7 9BP |
| Frisby By Gaulby | LE7 9BD |
| Front Street | LE7 9BW |
| Gaulby Lane | LE7 9BA |
| Gaulby Road | LE7 9AF LE7 9AG |
| Glebe Close | LE7 9AH |
| Harborough Road | LE7 9EL |
| High Acres | LE7 9FB |
| Kibworth Road | LE7 9EQ |
| Knights Close | LE7 9AS |
| Leicester Road | LE7 9AQ |
| Long Lane | LE7 9AL |
| Main Street | LE7 9BE LE7 9BF LE7 9EG |
| Market Place | LE7 9AJ |
| Norton Lane | LE7 9BU |
| Rolleston Road | LE7 9AA LE7 9EN |
| School Lane | LE7 9BX |
| Skeffington Road | LE7 9EW |
| Spinney Meadow | LE7 9AZ |
| St Michaels Walk | LE7 9ET |
| Stoughton Road | LE7 9BB |
| The Poplars | LE7 9AT |
| Three Gates Lane | LE7 9ER |
| Tilton Lane | LE7 9DR LE7 9DS |
| Tilton Road | LE7 9FF |
| Tugby Road | LE7 9EE LE7 9EU |
| Turnbull Close | LE7 9AY |
| Uppingham Road | LE7 9AR LE7 9FL |
| Vicarage Close | LE7 9AN |
| Weare Close | LE7 9DY |
| West Lane | LE7 9AP |
| White Hart Close | LE7 9AU |
| Whitehart Mews | LE7 9AX |
Transport near Billesdon
- FAQ
- Price Paid By Year
- Property Type Price
Frequently asked questions about Billesdon
What is the average price for a property for sale in Billesdon?
The average price for a property for sale in Billesdon is £518,374. This amount is 66% higher than the average price in Leicester. There are 200 property listings for sale in Billesdon.
What streets have the most expensive properties for sale in Billesdon?
The streets with the most expensive properties for sale in Billesdon are Back Lane at an average of £1,385,000, Church Street at an average of £975,000 and Tilton Lane at an average of £801,500.
What streets have the most affordable properties for sale in Billesdon?
The streets with the most affordable properties for sale in Billesdon are Gaulby Road at an average of £224,750, Vicarage Close at an average of £260,000 and Knights Close at an average of £280,000.
Which train stations are available in or near Billesdon?
Some of the train stations available in or near Billesdon are Leicester, South Wigston and Syston.
Property Price Paid in Billesdon by Year
The average sold property price by year was:
| Year | Average Sold Price | Price Change |
Sold Properties
|
|---|---|---|---|
| 2025 | £534,763 | 21% |
19 Properties |
| 2024 | £420,997 | -51% |
21 Properties |
| 2023 | £633,945 | 32% |
15 Properties |
| 2022 | £428,305 | -5% |
18 Properties |
| 2021 | £448,117 | 1% |
26 Properties |
| 2020 | £442,236 | -16% |
19 Properties |
| 2019 | £514,064 | 23% |
17 Properties |
| 2018 | £393,770 | -19% |
22 Properties |
| 2017 | £467,050 | 33% |
20 Properties |
| 2016 | £311,343 | -40% |
23 Properties |
| 2015 | £436,156 | 6% |
16 Properties |
| 2014 | £409,991 | 10% |
24 Properties |
| 2013 | £369,583 | 2% |
24 Properties |
| 2012 | £361,961 | 12% |
26 Properties |
| 2011 | £317,366 | -9% |
15 Properties |
| 2010 | £346,995 | -7% |
12 Properties |
| 2009 | £371,117 | 3% |
17 Properties |
| 2008 | £361,497 | 13% |
18 Properties |
| 2007 | £314,834 | 7% |
19 Properties |
| 2006 | £292,313 | -6% |
36 Properties |
| 2005 | £309,480 | -11% |
57 Properties |
| 2004 | £343,168 | 22% |
32 Properties |
| 2003 | £268,231 | 19% |
30 Properties |
| 2002 | £217,351 | 24% |
31 Properties |
| 2001 | £166,043 | 3% |
33 Properties |
| 2000 | £160,883 | 0,5% |
38 Properties |
| 1999 | £160,142 | 16% |
27 Properties |
| 1998 | £134,776 | -3% |
25 Properties |
| 1997 | £139,175 | -5% |
27 Properties |
| 1996 | £145,757 | 26% |
27 Properties |
| 1995 | £108,309 | - |
23 Properties |
Property Price per Property Type in Billesdon
Here you can find historic sold price data in order to help with your property search.
The average Property Paid Price for specific property types in the last three years are:
| Property Type | Average Sold Price | Sold Properties |
|---|---|---|
| Semi Detached House | £296,194.00 | 18 Semi Detached Houses |
| Detached House | £715,498.00 | 30 Detached Houses |
| Terraced House | £272,363.00 | 6 Terraced Houses |
| Flat | £80,000.00 | 1 Flat |

