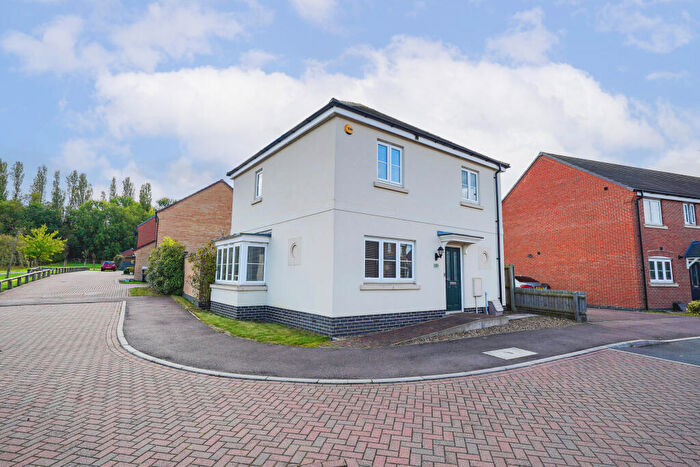
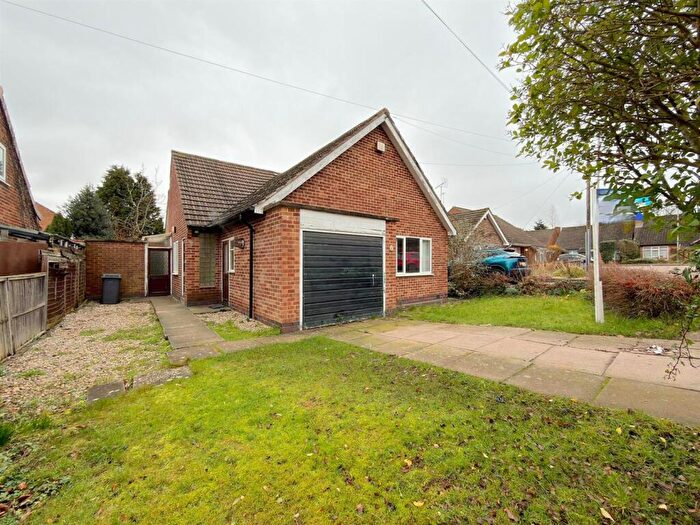
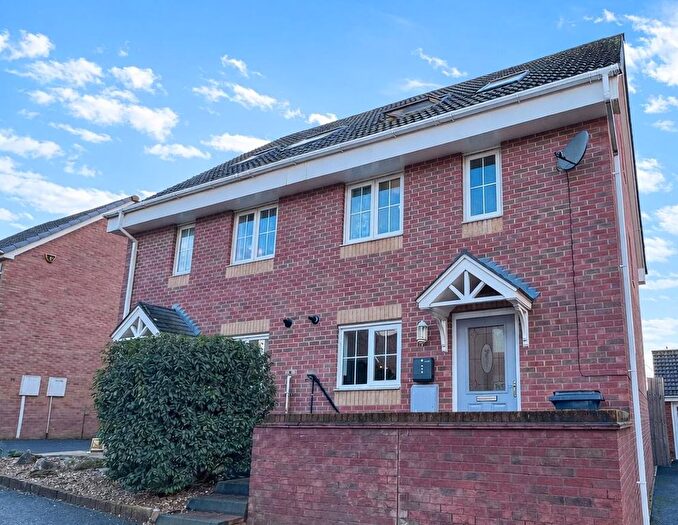
Houses for sale & to rent in Thurnby And Houghton, Leicester
House Prices in Thurnby And Houghton
Properties in Thurnby And Houghton have an average house price of £388,279.00 and had 297 Property Transactions within the last 3 years¹.
Thurnby And Houghton is an area in Leicester, Leicestershire with 2,796 households², where the most expensive property was sold for £1,875,000.00.
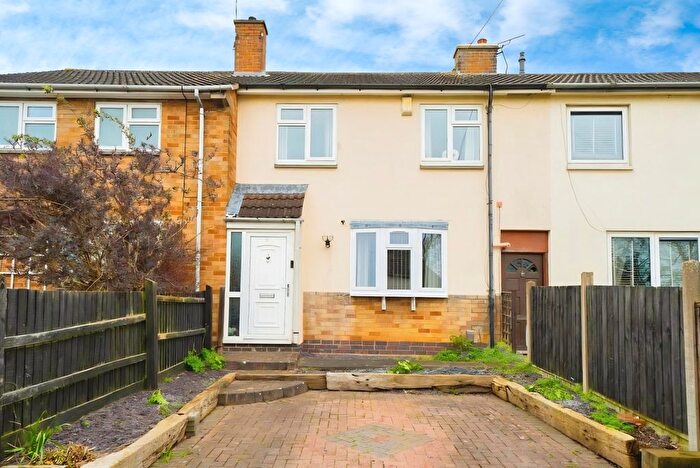
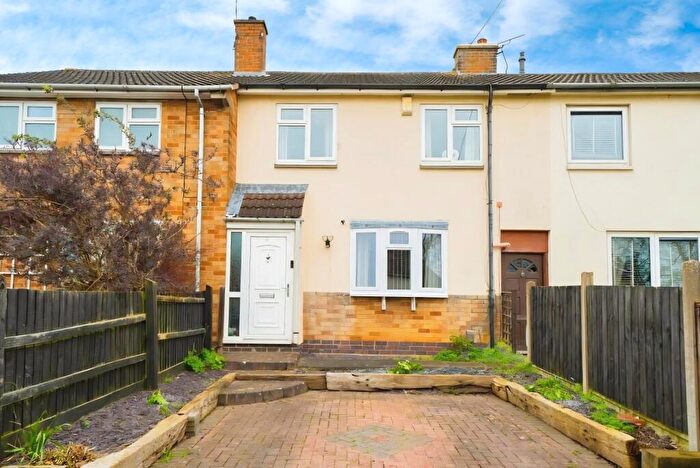
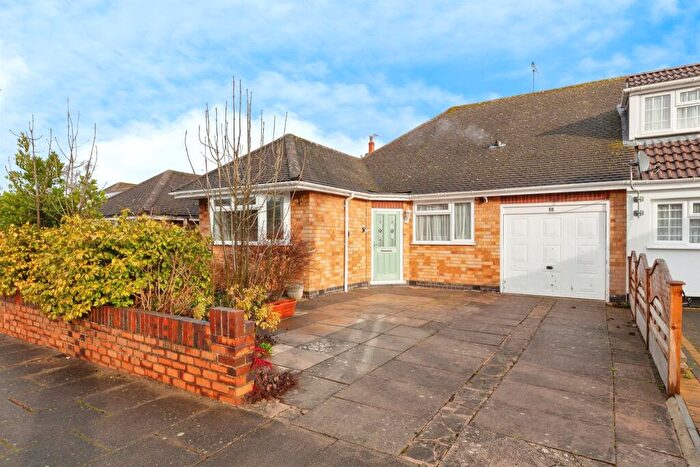
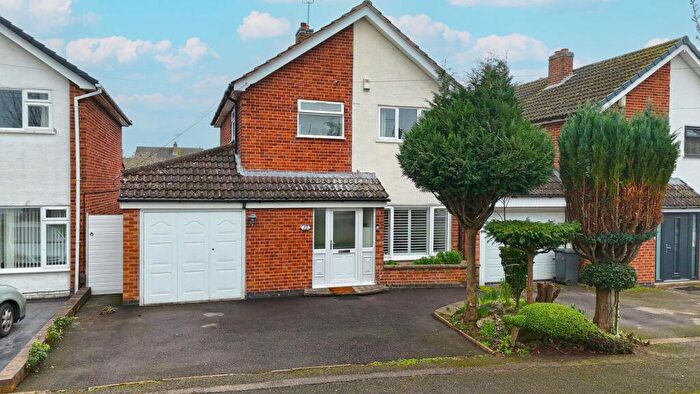
Properties for sale in Thurnby And Houghton
Roads and Postcodes in Thurnby And Houghton
Navigate through our locations to find the location of your next house in Thurnby And Houghton, Leicester for sale or to rent.
| Streets | Postcodes |
|---|---|
| Angus Close | LE7 9QG |
| Anthony Drive | LE7 9RA |
| Beeby Road | LE7 9SG LE7 9SH LE7 9SJ |
| Bennion Road | LE7 9QF |
| Boundary Close | LE7 9TR |
| Bradgate Close | LE7 9NP |
| Bramley Orchard | LE7 9RU |
| Chapel Close | LE7 9HT |
| Charlottes Walk | LE7 9HP |
| Charnwood Drive | LE7 9PB LE7 9PD |
| Chestnut Drive | LE7 9RB |
| Church Hill | LE7 9ST |
| Church Lane | LE2 2FJ |
| Corah Close | LE7 9FW |
| Coulter Close | LE7 9FR |
| Court Road | LE7 9PA |
| Covert Lane | LE7 9SN LE7 9SP LE7 9SQ |
| Cranbrook Road | LE7 9UA |
| Cricketers Close | LE7 9TQ |
| Dalby Avenue | LE7 9RD LE7 9RE |
| Deane Gate Drive | LE7 9HA |
| Devenports Hill | LE7 9NF |
| Elizabeth Close | LE7 9GA |
| Elliotts End | LE7 9FX |
| Facers Lane | LE7 9FS |
| Fern Close | LE7 9QJ |
| Field Close | LE7 9GS |
| Fiona Drive | LE7 9RF |
| Firs Close | LE7 9GF |
| Firs Road | LE7 9GU |
| Forest Rise | LE7 9PF LE7 9PG |
| Forsells End | LE7 9HQ |
| Freer Close | LE7 9HU |
| Gartree Road | LE2 2FG |
| Gaulby Lane | LE2 2FL LE7 9HB |
| Gilstead Close | LE7 9QD |
| Goddard Close | LE7 9NB |
| Grange Lane | LE7 9PH |
| Gresley Close | LE7 9QW |
| Hall Road | LE7 9SX LE7 9SY |
| Hamilton Lane | LE7 9SB |
| Hartopp Close | LE7 9ND |
| Hereward Drive | LE7 9RS |
| Herrick Drive | LE7 9RT |
| Hincks Avenue | LE7 9SW |
| Hollies Close | LE7 9GW |
| Hollies Way | LE7 9RJ LE7 9RL |
| Holmleigh Gardens | LE7 9QH |
| Home Close Road | LE7 9GT |
| Ingarsby Close | LE7 9JN |
| Ingarsby Lane | LE7 9JJ |
| Ivatt Close | LE7 9UT |
| Keays Way | LE7 9TB |
| Lady Jane Walk | LE7 9FP |
| Lakeside Court | LE7 9PY |
| Leas Close | LE7 9QU |
| Leybury Way | LE7 9UB |
| Limes Close | LE7 9SR |
| Linwal Avenue | LE7 9HD |
| Lyncroft Leys | LE7 9UW |
| Main Street | LE7 9GD LE7 9GE LE7 9NY LE7 9PJ LE7 9PL LE7 9PN LE7 9PP LE7 9TD |
| Malsbury Avenue | LE7 9FQ |
| Marefield Close | LE7 9US |
| Mitchell Grove | LE7 9FT |
| Newstead Avenue | LE7 9QE |
| North Way | LE7 9HR |
| Old Charity Farm | LE2 2EX |
| Orchard Close | LE7 9BN |
| Padgate Close | LE7 9UL |
| Padwell Lane | LE7 9PQ |
| Pavilion Road | LE7 9TN |
| Pulford Drive | LE7 9UD LE7 9UJ LE7 9UQ |
| Randles Close | LE7 9RG |
| Rose Acre Close | LE7 9UH |
| School Lane | LE7 9GJ |
| Scotland Lane | LE7 9GH |
| Scraptoft Lane | LE7 9SE |
| Scraptoft Mews | LE7 9TJ |
| Scraptoft Rise | LE7 9TF |
| Scrivener Close | LE7 9NE |
| Sedgefield Drive | LE7 9PS LE7 9PT |
| Somerby Road | LE7 9PR |
| Southfield Close | LE7 9UR |
| Springbrook Drive | LE7 9UE |
| St Catharines Way | LE7 9HE |
| St Lukes Close | LE7 9RH |
| Station Lane | LE7 9UF LE7 9UG |
| Station Road | LE7 9PU LE7 9PW |
| Stirling Drive | LE7 9QT |
| Stocks Road | LE7 9TE |
| Stoughton Lane | LE2 2FH |
| Stretton Lane | LE7 9GL LE7 9GN |
| Sturrock Close | LE7 9QP |
| Telford Way | LE5 2LX LE5 2LZ |
| The Cedars | LE7 9RZ |
| The Copse | LE7 9RW |
| The Cuttings | LE7 9QZ |
| The Drive | LE7 9TH |
| The Mount | LE7 9TG |
| The Pines | LE7 9RX |
| The Rise | LE7 9GQ |
| The Spinney | LE7 9QS |
| The Square | LE7 9PX |
| Thomas Close | LE7 9HF |
| Thurnby Lane | LE2 2FP |
| Thurncourt Gardens | LE5 2NT |
| Uppingham Road | LE7 9HG LE7 9HH LE7 9HJ LE7 9HL LE7 9HN LE7 9QA LE7 9RN LE7 9RP LE7 9RQ LE7 9RR |
| Vale End | LE7 9QL |
| Wadkins Way | LE7 9NA |
| Weir Lane | LE7 9GR |
| Winckley Close | LE7 9HS |
| Winkadale Close | LE7 9RY |
| Yaxley Close | LE7 9UU |
Transport near Thurnby And Houghton
-
Leicester Station
-
Syston Station
-
South Wigston Station
-
Sileby Station
-
Narborough Station
-
Barrow-Upon-Soar Station
- FAQ
- Price Paid By Year
- Property Type Price
Frequently asked questions about Thurnby And Houghton
What is the average price for a property for sale in Thurnby And Houghton?
The average price for a property for sale in Thurnby And Houghton is £388,279. This amount is 25% higher than the average price in Leicester. There are 5,838 property listings for sale in Thurnby And Houghton.
What streets have the most expensive properties for sale in Thurnby And Houghton?
The streets with the most expensive properties for sale in Thurnby And Houghton are Chestnut Drive at an average of £925,000, Limes Close at an average of £790,000 and Stoughton Lane at an average of £755,800.
What streets have the most affordable properties for sale in Thurnby And Houghton?
The streets with the most affordable properties for sale in Thurnby And Houghton are Elliotts End at an average of £102,625, Lady Jane Walk at an average of £114,833 and The Cedars at an average of £141,969.
Which train stations are available in or near Thurnby And Houghton?
Some of the train stations available in or near Thurnby And Houghton are Leicester, Syston and South Wigston.
Property Price Paid in Thurnby And Houghton by Year
The average sold property price by year was:
| Year | Average Sold Price | Price Change |
Sold Properties
|
|---|---|---|---|
| 2025 | £393,815 | -2% |
98 Properties |
| 2024 | £401,048 | 8% |
107 Properties |
| 2023 | £367,529 | -6% |
92 Properties |
| 2022 | £387,785 | 10% |
107 Properties |
| 2021 | £350,567 | 8% |
162 Properties |
| 2020 | £320,789 | 10% |
119 Properties |
| 2019 | £287,731 | 1% |
99 Properties |
| 2018 | £285,450 | 3% |
138 Properties |
| 2017 | £276,041 | 9% |
136 Properties |
| 2016 | £250,470 | -4% |
108 Properties |
| 2015 | £260,214 | 8% |
134 Properties |
| 2014 | £240,566 | 4% |
138 Properties |
| 2013 | £231,797 | 3% |
122 Properties |
| 2012 | £224,620 | 3% |
85 Properties |
| 2011 | £217,316 | -4% |
86 Properties |
| 2010 | £225,074 | -17% |
135 Properties |
| 2009 | £264,242 | 25% |
117 Properties |
| 2008 | £198,047 | -26% |
116 Properties |
| 2007 | £250,404 | 3% |
164 Properties |
| 2006 | £244,046 | 8% |
148 Properties |
| 2005 | £224,606 | -5% |
93 Properties |
| 2004 | £235,084 | 1% |
101 Properties |
| 2003 | £233,201 | 32% |
115 Properties |
| 2002 | £157,981 | 15% |
160 Properties |
| 2001 | £134,178 | -16% |
113 Properties |
| 2000 | £156,137 | 17% |
112 Properties |
| 1999 | £129,687 | 6% |
146 Properties |
| 1998 | £122,446 | 27% |
141 Properties |
| 1997 | £89,081 | 3% |
115 Properties |
| 1996 | £86,205 | -3% |
131 Properties |
| 1995 | £88,956 | - |
98 Properties |
Property Price per Property Type in Thurnby And Houghton
Here you can find historic sold price data in order to help with your property search.
The average Property Paid Price for specific property types in the last three years are:
| Property Type | Average Sold Price | Sold Properties |
|---|---|---|
| Semi Detached House | £308,249.00 | 79 Semi Detached Houses |
| Detached House | £490,646.00 | 164 Detached Houses |
| Terraced House | £242,509.00 | 33 Terraced Houses |
| Flat | £118,964.00 | 21 Flats |

