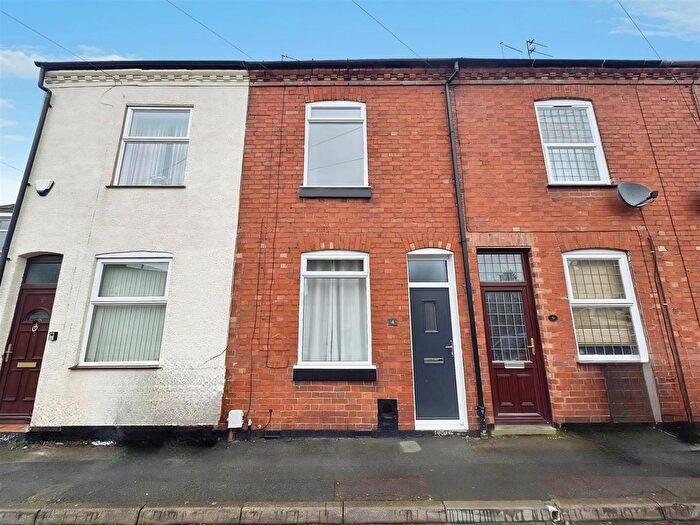
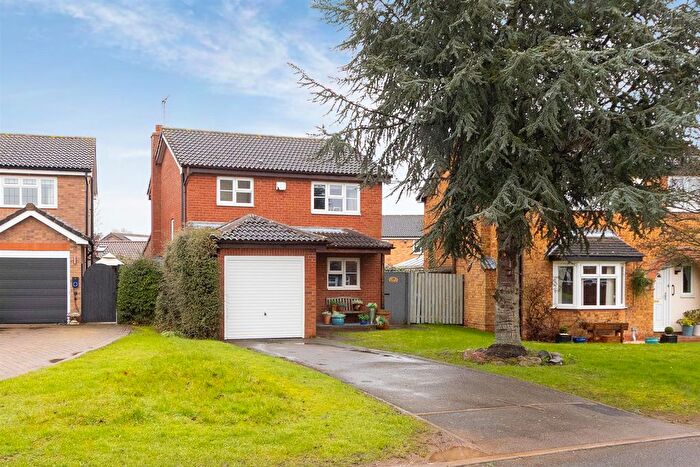
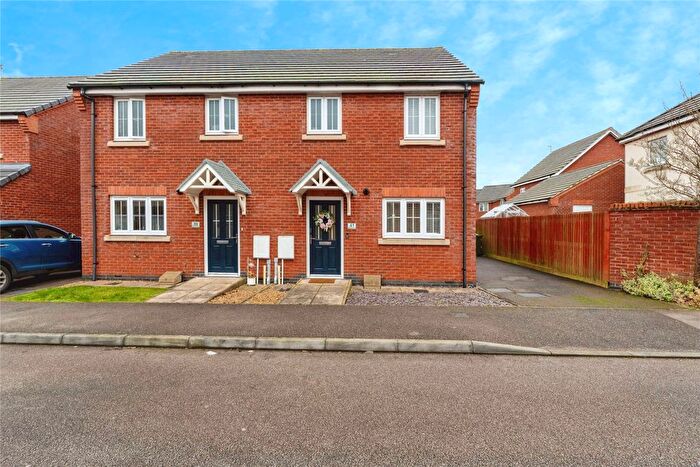
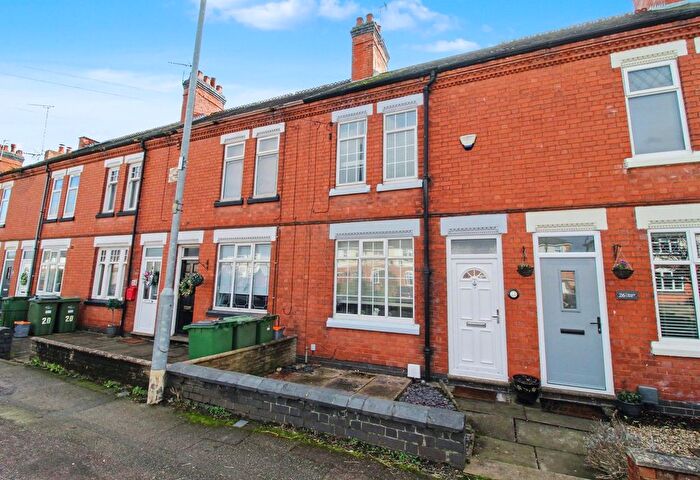
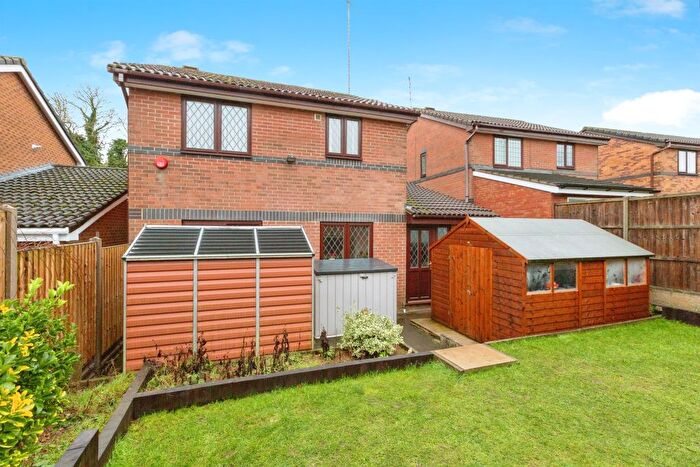
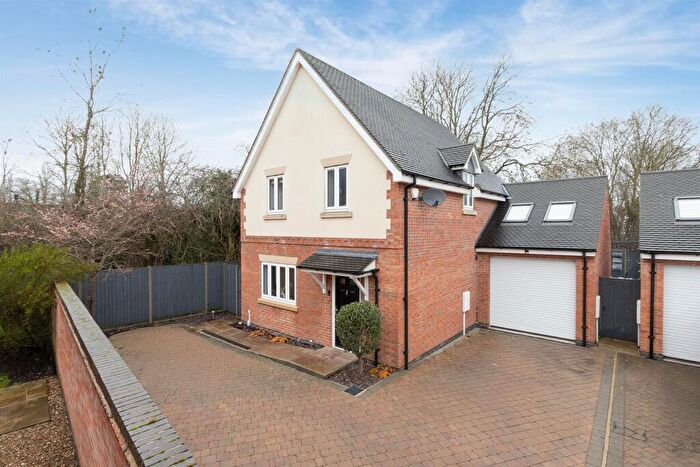
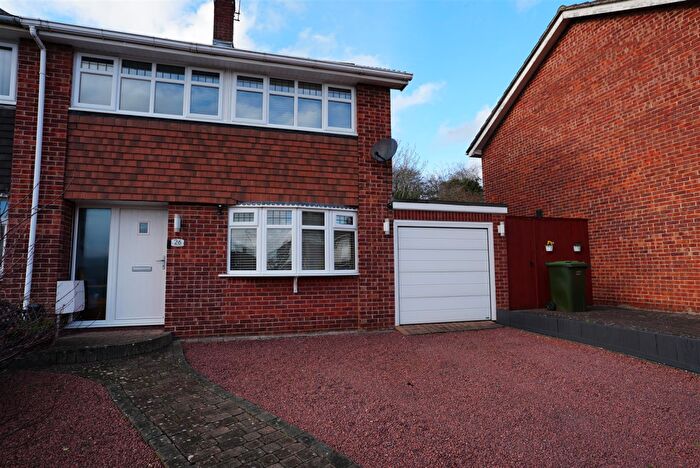
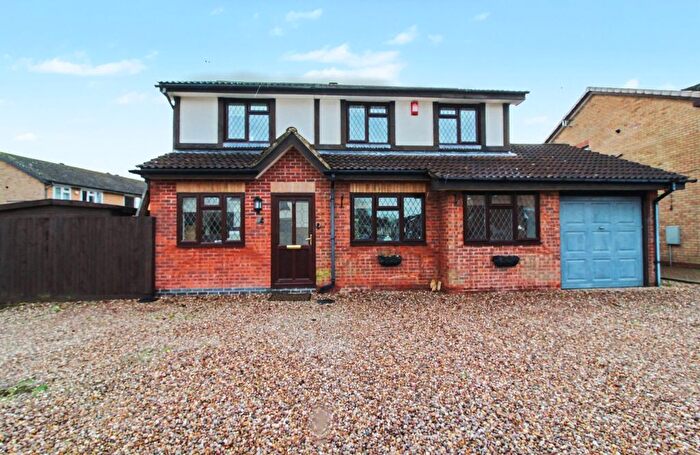
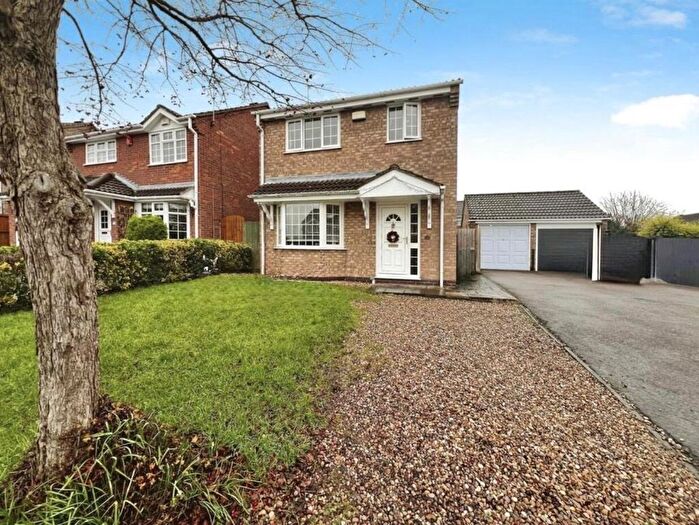
Houses for sale & to rent in Enderby And St Johns, Leicester
House Prices in Enderby And St Johns
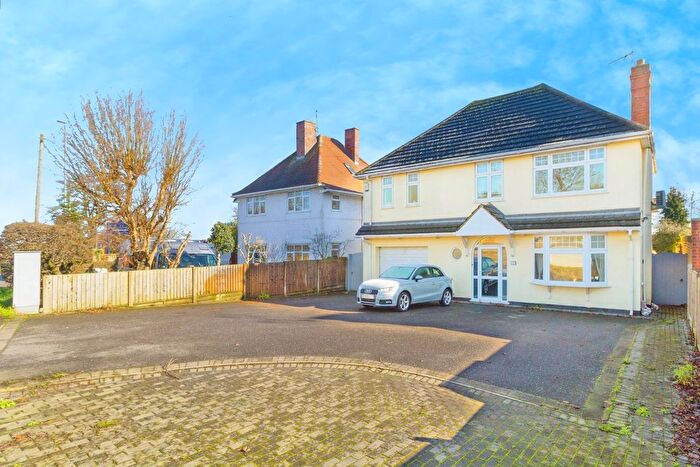
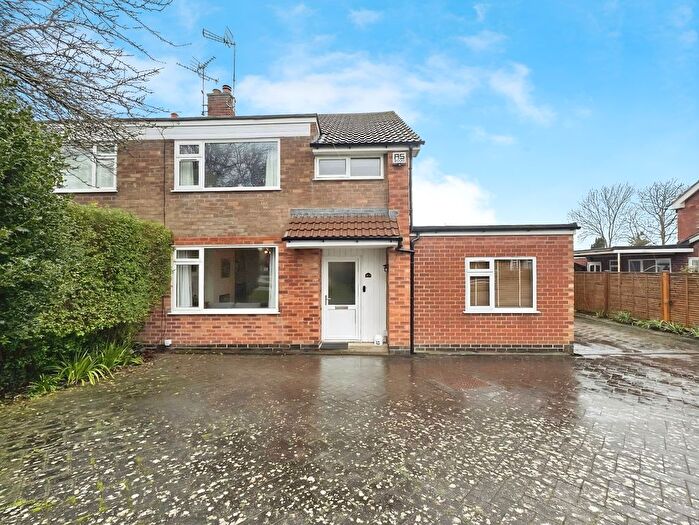
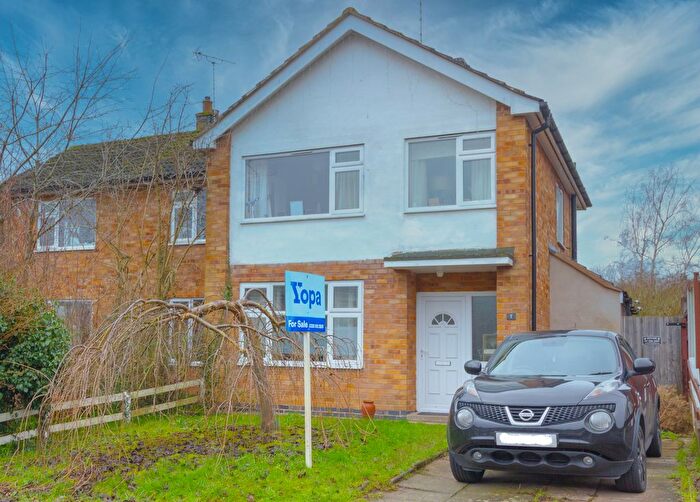
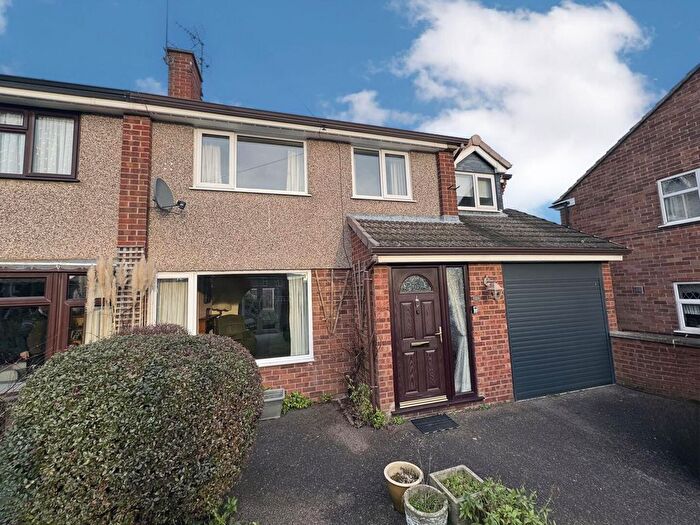
Properties in Enderby And St Johns have an average house price of £274,834.43 and had 304 Property Transactions within the last 3 years¹.
Enderby And St Johns is an area in Leicester, Leicestershire with 2,032 households², where the most expensive property was sold for £635,000.00.
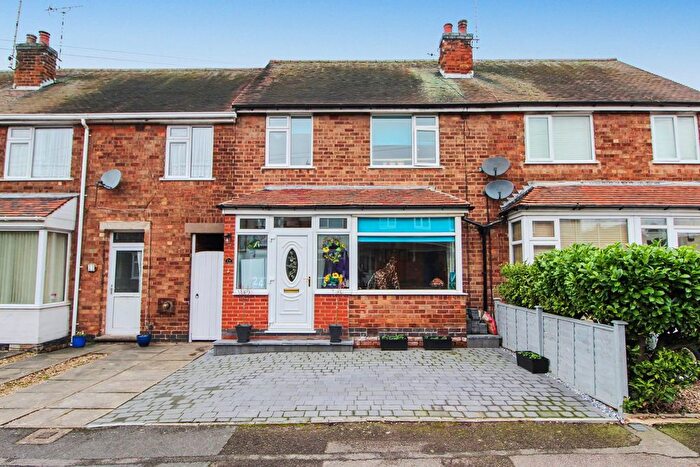
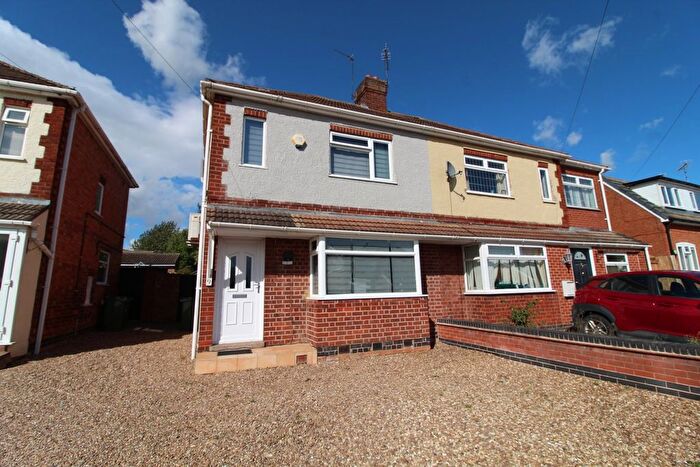
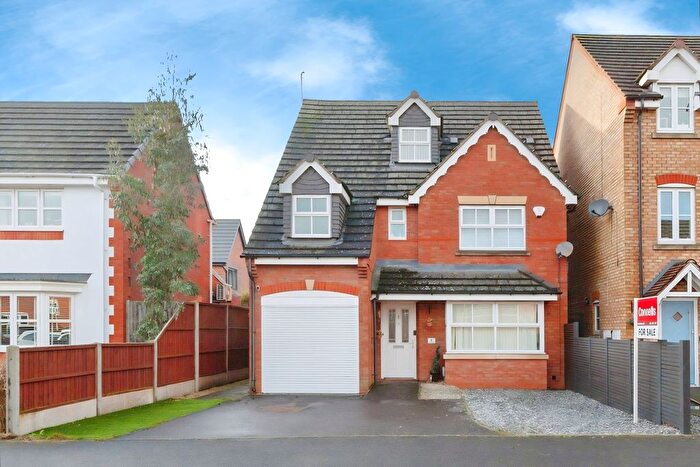
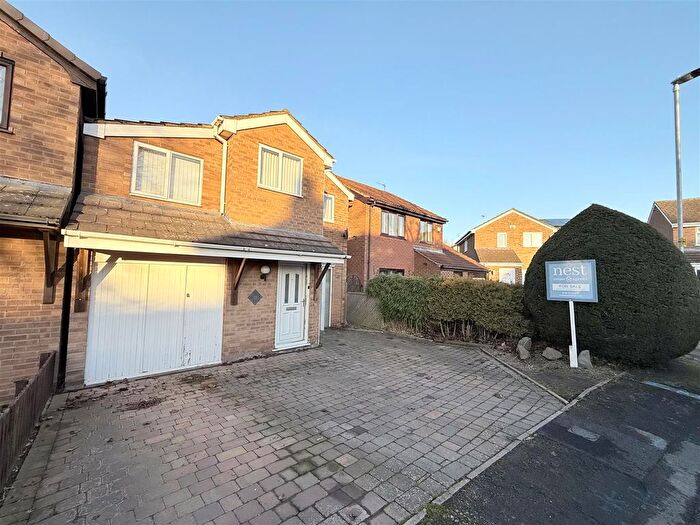
Properties for sale in Enderby And St Johns
Roads and Postcodes in Enderby And St Johns
Navigate through our locations to find the location of your next house in Enderby And St Johns, Leicester for sale or to rent.
| Streets | Postcodes |
|---|---|
| Abbey Road | LE19 2DA LE19 2DB |
| Aldeby Close | LE19 2BA |
| Alexander Avenue | LE19 4NA |
| Almond Road | LE19 4LD |
| Annan Way | LE19 4BS |
| Ashton Drive | LE19 4BA |
| Bantlam Lane | LE19 4NB |
| Barnsdale Way | LE19 1ES LE19 1SN |
| Barr Close | LE19 2AF |
| Barton Close | LE19 1SJ |
| Beauly Place | LE19 4DA |
| Beggars Lane | LE19 4LA |
| Blaby Road | LE19 2AR LE19 2BH LE19 4AP LE19 4AQ LE19 4AR LE19 4AW |
| Bordeaux Close | LE19 4RL |
| Broad Street | LE19 4AA |
| Brook Street | LE19 4ND |
| Carter Close | LE19 4PN |
| Cassley Crescent | LE19 4BJ |
| Chapel Street | LE19 4NE |
| Cherry Tree Grove | LE19 4QY |
| Clarence Road | LE19 2BB |
| Clarks Close | LE19 2EB |
| Co Operation Street | LE19 4NG |
| Columbia Close | LE19 4NU |
| Conery Lane | LE19 4AB |
| Cornwall Street | LE19 4NF |
| Cross Street | LE19 4NJ |
| Cumberwell Drive | LE19 2LB |
| Desford Road | LE19 4AD LE19 4AT |
| Deveron Drive | LE19 4LQ |
| Dionard Drive | LE19 4DD |
| Dorsey Way | LE19 4DB |
| Drummond Road | LE19 4QL |
| Earn Drive | LE19 4BW |
| Equity Road | LE19 4NN |
| Ettrick Way | LE19 4BB |
| Farrar Court | LE19 4BQ |
| Federation Street | LE19 4NP |
| Feldspar Close | LE19 4JS LE19 4SD |
| Fleet Road | LE19 4BD |
| Forest Road | LE19 3LR |
| Forsa Close | LE19 4BZ |
| Fosse Close | LE19 2AW |
| Fosse Park Shopping Centre | LE19 1HJ LE19 1HQ LE19 1HX |
| Fosse Park South | LE19 1UT |
| Foxhunter Gardens | LE19 2DZ |
| Frances Way | LE19 1SH |
| Froanes Close | LE19 4XL |
| Gayton Heights | LE19 4AX |
| George Street | LE19 4NQ |
| Girvan Drive | LE19 4BE |
| Granite Close | LE19 4AE |
| Grove Court | LE19 1SA |
| Grove Farm Triangle | LE19 1WT LE19 1WW |
| Gumley Square | LE19 4NR |
| Hall Walk | LE19 4AH |
| Halladale Drive | LE19 4LB |
| Harolds Lane | LE19 4AF |
| Hayes Gardens | LE19 4LW |
| Heath Avenue | LE19 2BD |
| Heron Way | LE19 2AJ |
| High Street | LE19 4AG |
| Hill View | LE19 2BT |
| Holyoake Street | LE19 4NS |
| Irvine Crescent | LE19 4BT |
| Isla Drive | LE19 4BN |
| Jacob Close | LE19 4PP |
| John Street | LE19 4LE LE19 4LF |
| King Street | LE19 4NT |
| Kings Court | LE19 4NH |
| Kirk Lane | LE19 4AS |
| Leicester Lane | LE19 4BP |
| Leicester Road | LE19 2BE LE19 2BF LE19 2BG LE19 2BJ |
| Lewis Court | LE19 1SD |
| Lime Tree Road | LE19 2BL |
| Lubbesthorpe | LE19 4AZ |
| Lubbesthorpe Bridle Road | LE19 4LJ LE19 4LL |
| Mill Hill | LE19 4AL LE19 4AJ |
| Mill Hill Industrial Estate | LE19 4AU |
| Mill Lane | LE19 4NW LE19 4LG LE19 4LH LE19 4LX LE19 4NL |
| Mitchell Road | LE19 4NX |
| Moores Lane | LE19 4AN |
| Narborough Road South | LE3 2LL |
| Narborough Wood Park | LE19 4XT |
| Ness Way | LE19 4BL |
| Nith Drive | LE19 4BU |
| Old Church Road | LE19 2ED LE19 2EE |
| Packhorse Drive | LE19 2RN LE19 2RP |
| Penman Way | LE19 1ST LE19 1SY LE19 1SZ |
| Peters Close | LE19 2AH |
| Pope Crescent | LE19 4QT |
| Quartz Close | LE19 4SG |
| Queens Drive | LE19 2LJ LE19 2LL |
| Ratby Meadow Lane | LE19 2BN |
| Rawson Street | LE19 4NY |
| Regal Court | LE19 2NH |
| Salts Close | LE19 4SQ |
| Sandhill Drive | LE19 2LP |
| Seine Lane | LE19 4PD |
| Shortridge Lane | LE19 4PA LE19 4PB LE19 4LY |
| Sloane Close | LE19 4QU |
| Smith Way | LE19 1SW LE19 1SX |
| Sparsis Gardens | LE19 2BQ |
| St Johns | LE19 2BP LE19 2BR LE19 2BS LE19 2AB LE19 2BX |
| Strathy Close | LE19 4LR |
| Strawberry Gardens | LE19 4PQ |
| Tay Road | LE19 4BF |
| Teviot Drive | LE19 4BY |
| The Cross | LE19 4PF |
| The Nook | LE19 4PE |
| Thomas Road | LE19 2AG |
| Thorpe Way | LE19 1SU |
| Townsend Road | LE19 4PG LE19 4PH |
| Trinity Road | LE19 2BU LE19 2BW |
| Tweed Street | LE19 4BH |
| Warren Park Way | LE19 4SA |
| Warren Road | LE19 2DR |
| West Street | LE19 4LS LE19 4LT LE19 4LU |
| LE19 4BX |
Transport near Enderby And St Johns
- FAQ
- Price Paid By Year
- Property Type Price
Frequently asked questions about Enderby And St Johns
What is the average price for a property for sale in Enderby And St Johns?
The average price for a property for sale in Enderby And St Johns is £274,834. This amount is 12% lower than the average price in Leicester. There are 646 property listings for sale in Enderby And St Johns.
What streets have the most expensive properties for sale in Enderby And St Johns?
The streets with the most expensive properties for sale in Enderby And St Johns are Gayton Heights at an average of £487,500, Strathy Close at an average of £400,000 and The Cross at an average of £399,000.
What streets have the most affordable properties for sale in Enderby And St Johns?
The streets with the most affordable properties for sale in Enderby And St Johns are Kings Court at an average of £120,333, Brook Street at an average of £124,000 and Shortridge Lane at an average of £150,500.
Which train stations are available in or near Enderby And St Johns?
Some of the train stations available in or near Enderby And St Johns are Narborough, South Wigston and Leicester.
Property Price Paid in Enderby And St Johns by Year
The average sold property price by year was:
| Year | Average Sold Price | Price Change |
Sold Properties
|
|---|---|---|---|
| 2025 | £274,274.2 | -0,4% |
88 Properties |
| 2024 | £275,248.89 | 0,1% |
115 Properties |
| 2023 | £274,850.64 | 5% |
101 Properties |
| 2022 | £261,084.58 | 1% |
106 Properties |
| 2021 | £257,891.03 | 3% |
180 Properties |
| 2020 | £251,259.41 | -3% |
160 Properties |
| 2019 | £258,597.99 | -4% |
231 Properties |
| 2018 | £268,814.45 | 9% |
222 Properties |
| 2017 | £243,461.27 | 20% |
182 Properties |
| 2016 | £194,976.05 | 3% |
106 Properties |
| 2015 | £190,090.93 | 12% |
87 Properties |
| 2014 | £167,180.95 | 11% |
126 Properties |
| 2013 | £149,061 | -2% |
64 Properties |
| 2012 | £151,941 | -15% |
64 Properties |
| 2011 | £173,995 | 8% |
86 Properties |
| 2010 | £159,451 | 2% |
55 Properties |
| 2009 | £156,428 | 1% |
44 Properties |
| 2008 | £154,736 | -4% |
54 Properties |
| 2007 | £160,270 | 7% |
108 Properties |
| 2006 | £148,893 | 5% |
91 Properties |
| 2005 | £141,275 | -1% |
90 Properties |
| 2004 | £142,395.07 | 17% |
91 Properties |
| 2003 | £118,292 | 21% |
110 Properties |
| 2002 | £93,601 | 21% |
142 Properties |
| 2001 | £74,060 | -0,5% |
173 Properties |
| 2000 | £74,399 | 17% |
93 Properties |
| 1999 | £62,120 | 20% |
88 Properties |
| 1998 | £49,500 | -6% |
68 Properties |
| 1997 | £52,234 | 12% |
80 Properties |
| 1996 | £45,901 | -1% |
66 Properties |
| 1995 | £46,415 | - |
71 Properties |
Property Price per Property Type in Enderby And St Johns
Here you can find historic sold price data in order to help with your property search.
The average Property Paid Price for specific property types in the last three years are:
| Property Type | Average Sold Price | Sold Properties |
|---|---|---|
| Semi Detached House | £258,673.16 | 117 Semi Detached Houses |
| Detached House | £377,339.40 | 83 Detached Houses |
| Terraced House | £224,842.43 | 81 Terraced Houses |
| Flat | £163,195.65 | 23 Flats |

