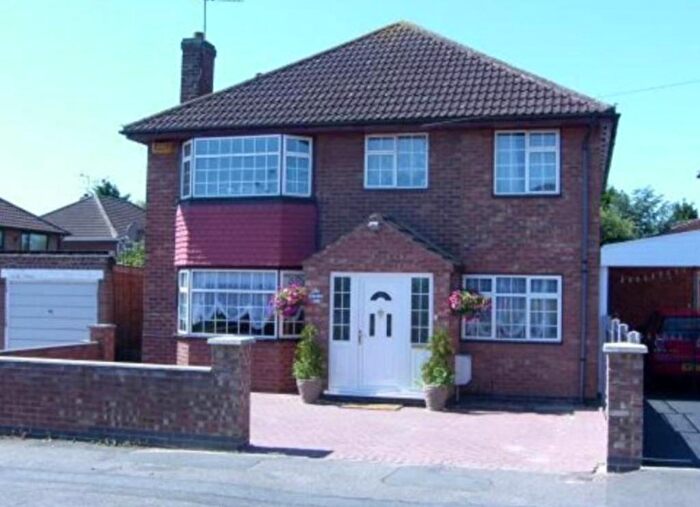
Houses for sale & to rent in Millfield, Leicester
House Prices in Millfield
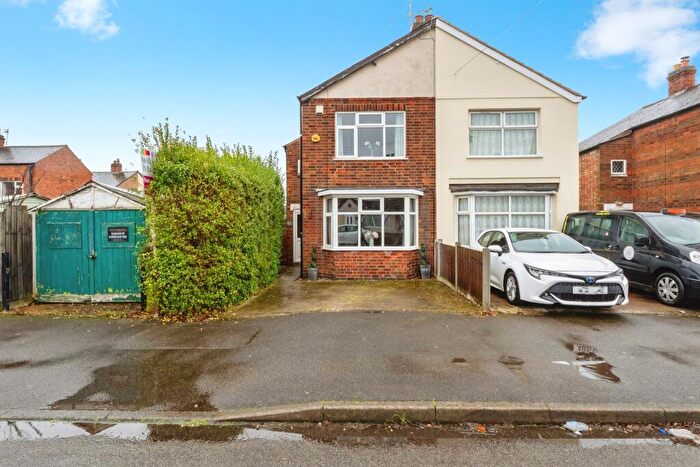
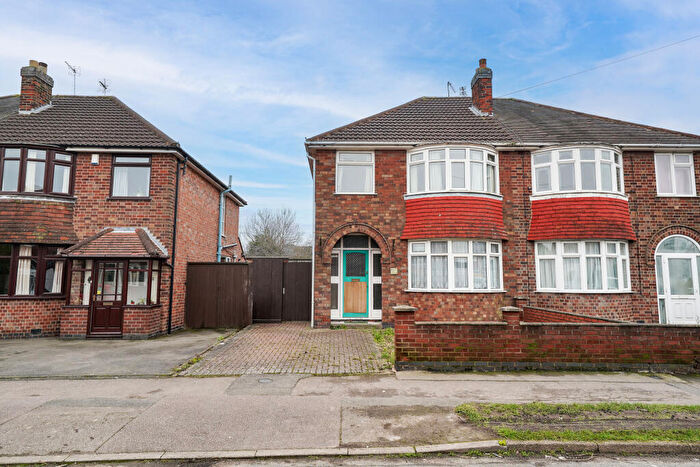
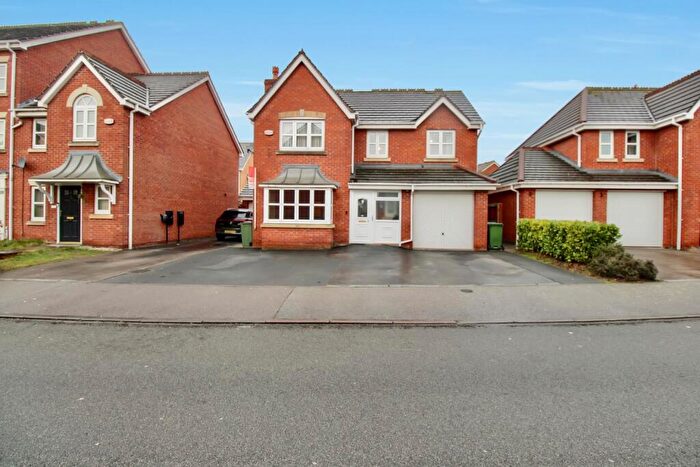
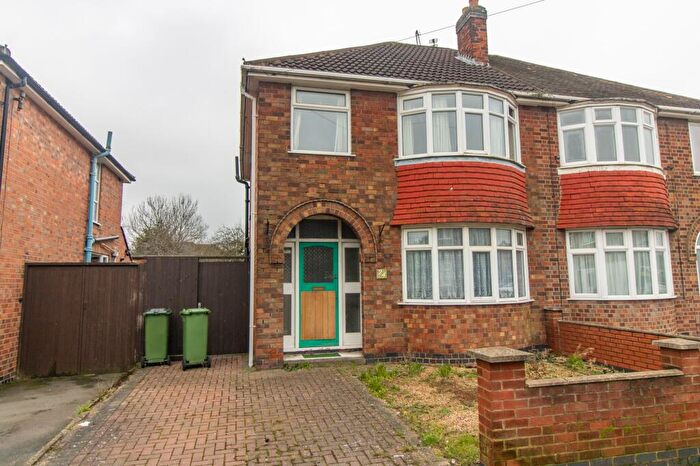
Properties in Millfield have an average house price of £252,364.00 and had 112 Property Transactions within the last 3 years¹.
Millfield is an area in Leicester, Leicestershire with 1,125 households², where the most expensive property was sold for £425,000.00.
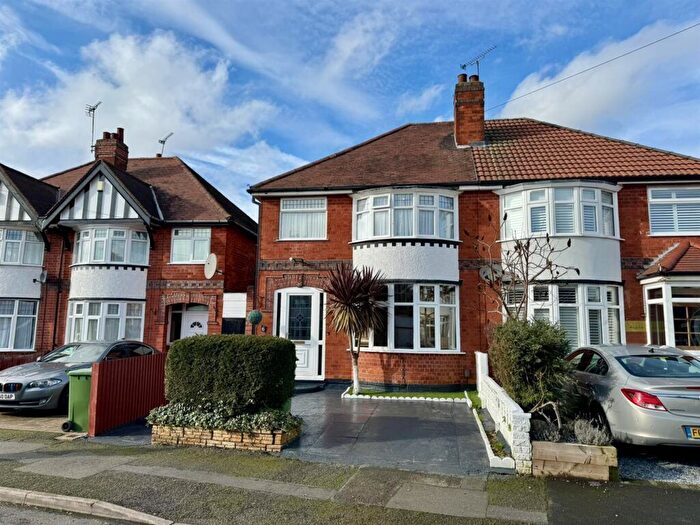
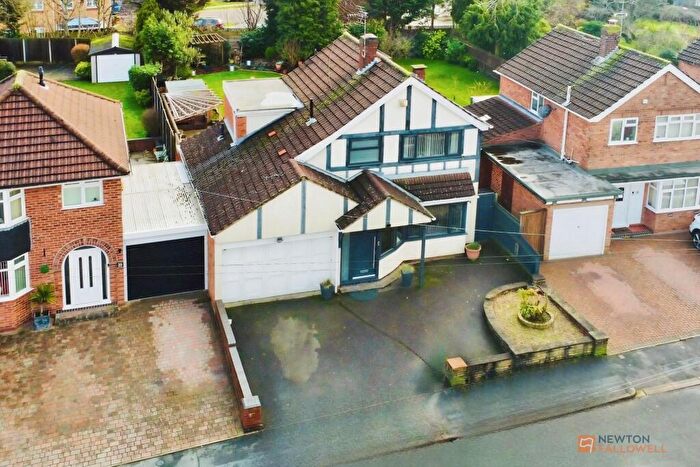
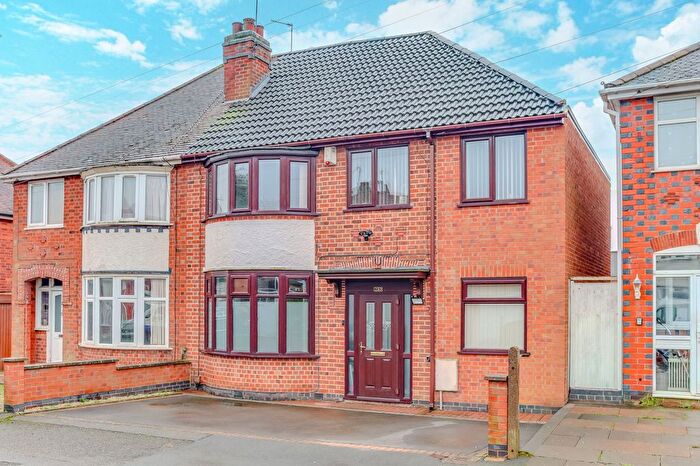
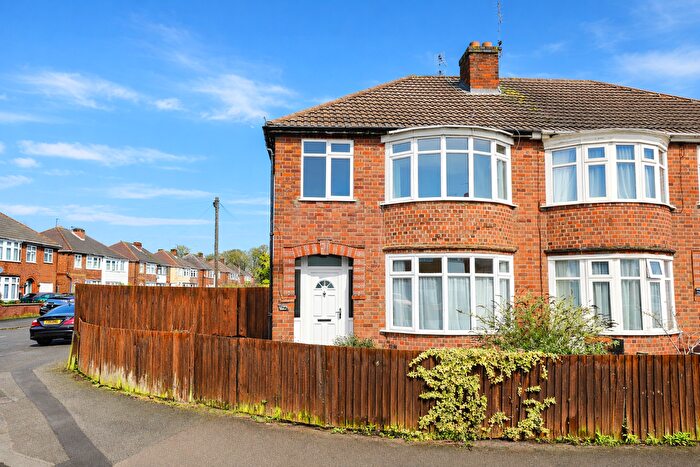
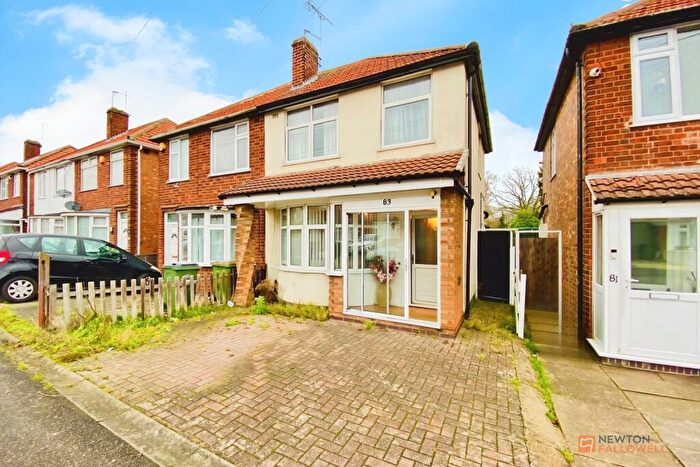
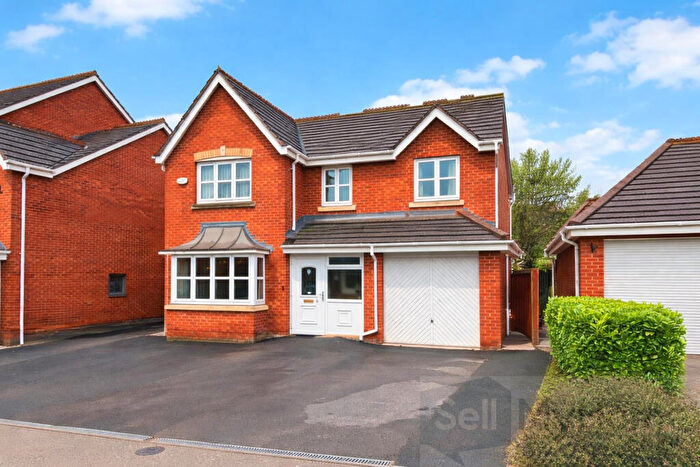
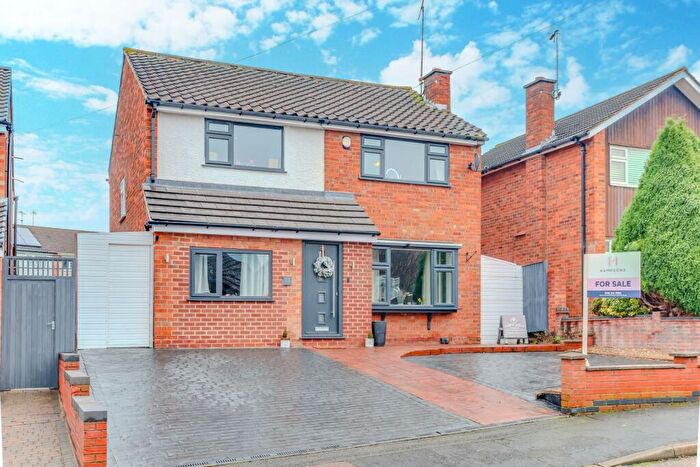
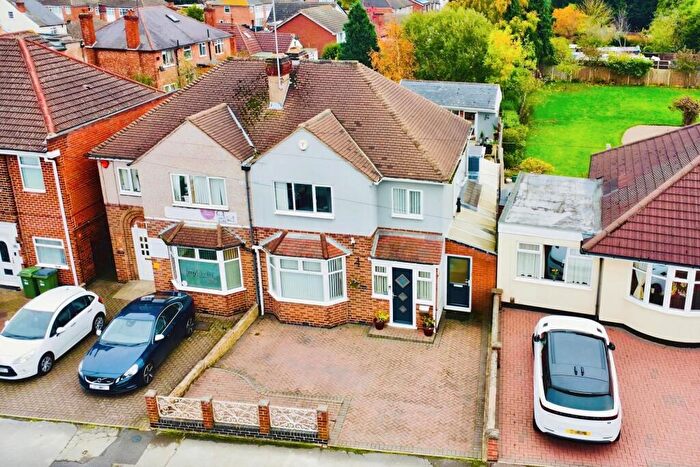
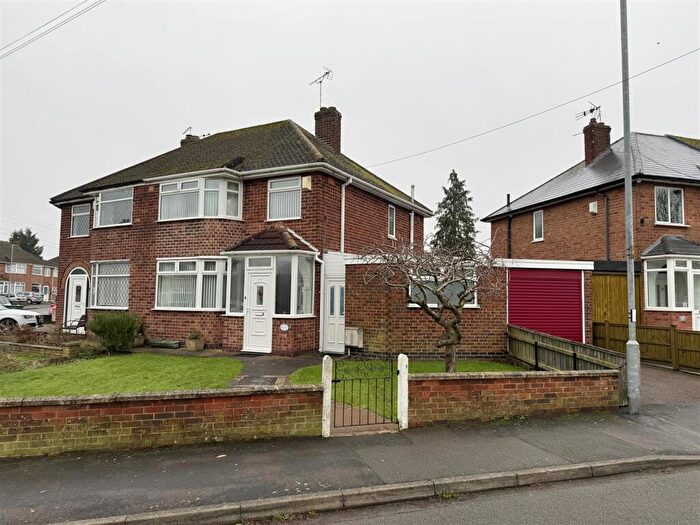
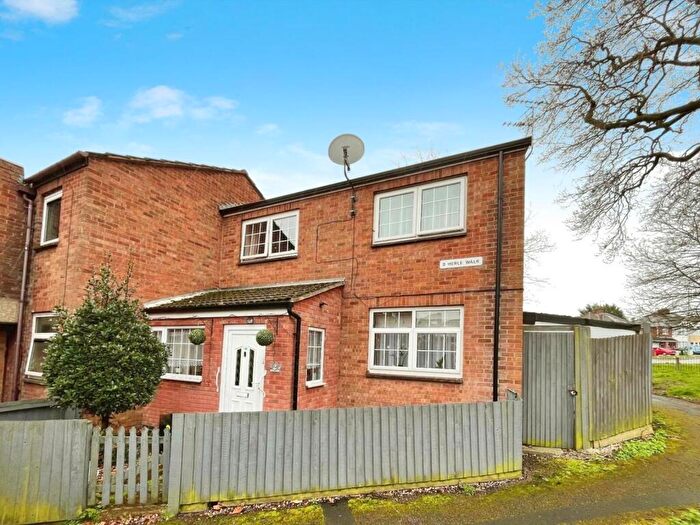
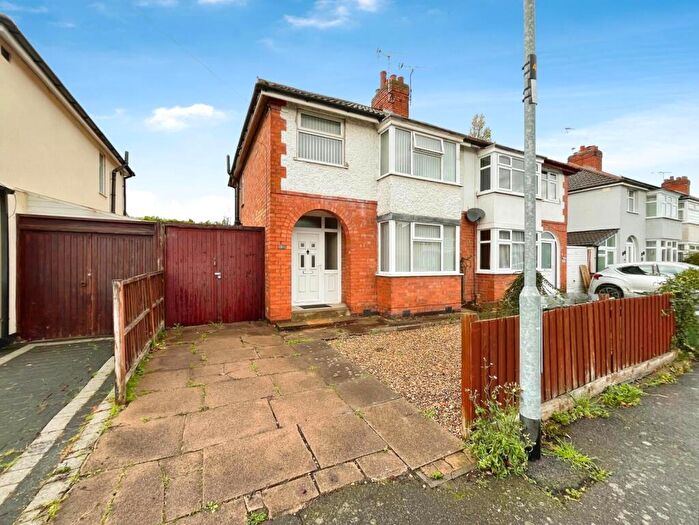
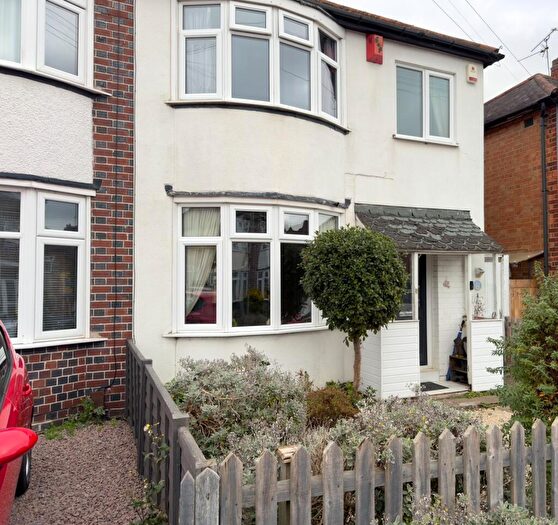
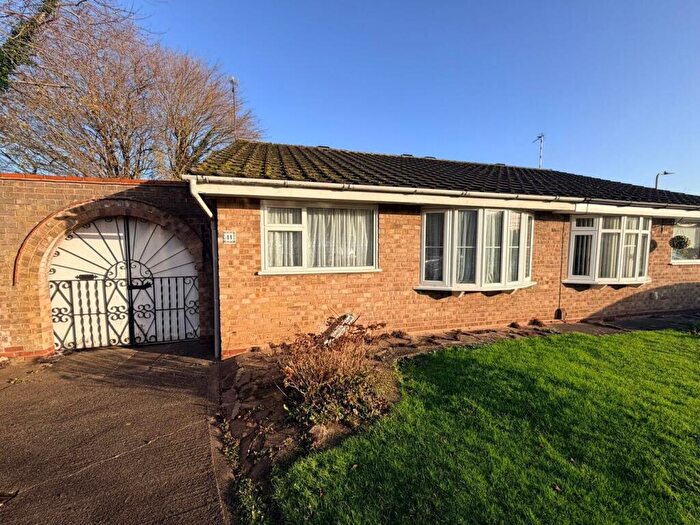
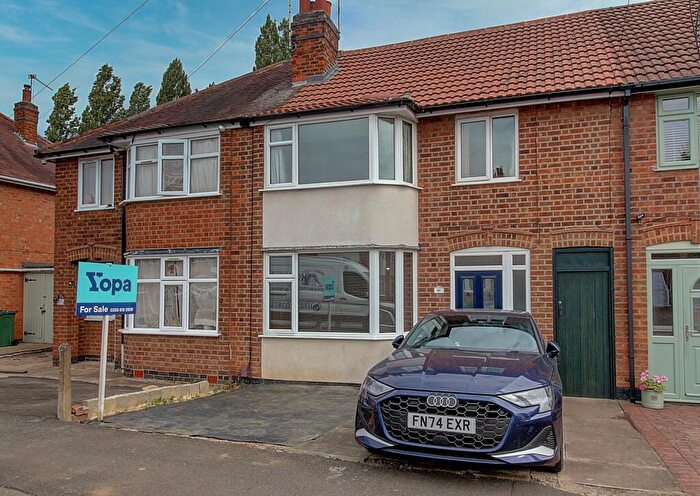
Properties for sale in Millfield
Roads and Postcodes in Millfield
Navigate through our locations to find the location of your next house in Millfield, Leicester for sale or to rent.
| Streets | Postcodes |
|---|---|
| Bannister Road | LE3 2XS |
| Bloxoms Close | LE3 2YA |
| Brockenhurst Drive | LE3 2UB |
| Cairns Close | LE3 2TG |
| Cottage Farm Close | LE3 2XZ |
| Farmway | LE3 2XA LE3 2XB |
| Fishpools | LE3 2UL |
| Fosse Close | LE3 2RY |
| Freeboard Road | LE3 2UN |
| Gayhurst Close | LE3 2UP |
| Grassacres | LE3 2UQ LE3 2UR |
| Hat Road | LE3 2WF |
| Junction 21 Approach | LE19 1WQ |
| Kingsway | LE3 2JJ LE3 2TT |
| Leyland Road | LE3 2JR |
| Lubbesthorpe Road | LE3 2XD LE3 2XE LE3 2XF LE3 2XG LE3 2XH |
| Millfield Crescent | LE3 2XJ |
| Pinfold | LE3 2TY LE3 2UW |
| Pits Avenue | LE3 2XL |
| Riddington Road | LE3 2JS |
| Riseholme Close | LE3 2YJ |
| Shipman Road | LE3 2YB |
| Southside Road | LE3 2YZ |
| Staplehurst Avenue | LE3 2UX |
| The Chase | LE3 2WA |
| The Glade | LE3 2WB |
| The Osiers | LE3 2XN |
| The Osiers Business Centre | LE19 1DX |
| Watergate Lane | LE3 2DE LE3 2XP LE3 2XQ |
| Willow Court | LE3 2XR |
| Woodcote Road | LE3 2WD LE3 2WE |
Transport near Millfield
- FAQ
- Price Paid By Year
- Property Type Price
Frequently asked questions about Millfield
What is the average price for a property for sale in Millfield?
The average price for a property for sale in Millfield is £252,364. This amount is 19% lower than the average price in Leicester. There are 656 property listings for sale in Millfield.
What streets have the most expensive properties for sale in Millfield?
The streets with the most expensive properties for sale in Millfield are The Osiers at an average of £343,333, The Chase at an average of £303,666 and Grassacres at an average of £301,000.
What streets have the most affordable properties for sale in Millfield?
The streets with the most affordable properties for sale in Millfield are Fosse Close at an average of £73,000, Pinfold at an average of £172,800 and Riseholme Close at an average of £204,250.
Which train stations are available in or near Millfield?
Some of the train stations available in or near Millfield are Narborough, South Wigston and Leicester.
Property Price Paid in Millfield by Year
The average sold property price by year was:
| Year | Average Sold Price | Price Change |
Sold Properties
|
|---|---|---|---|
| 2025 | £257,772 | 6% |
35 Properties |
| 2024 | £242,165 | -8% |
46 Properties |
| 2023 | £261,391 | 0,2% |
31 Properties |
| 2022 | £260,915 | 18% |
39 Properties |
| 2021 | £214,085 | 11% |
41 Properties |
| 2020 | £189,714 | -0,2% |
35 Properties |
| 2019 | £190,184 | 2% |
35 Properties |
| 2018 | £186,040 | 4% |
36 Properties |
| 2017 | £177,916 | 7% |
51 Properties |
| 2016 | £166,182 | 5% |
48 Properties |
| 2015 | £157,788 | 13% |
45 Properties |
| 2014 | £137,789 | -12% |
46 Properties |
| 2013 | £154,434 | 18% |
23 Properties |
| 2012 | £127,198 | 2% |
18 Properties |
| 2011 | £124,469 | -5% |
18 Properties |
| 2010 | £130,847 | 2% |
21 Properties |
| 2009 | £127,697 | -13% |
23 Properties |
| 2008 | £143,690 | -15% |
36 Properties |
| 2007 | £165,242 | -0,1% |
59 Properties |
| 2006 | £165,360 | -9% |
82 Properties |
| 2005 | £179,687 | 11% |
49 Properties |
| 2004 | £159,471 | 26% |
55 Properties |
| 2003 | £118,585 | 28% |
30 Properties |
| 2002 | £85,848 | 19% |
30 Properties |
| 2001 | £69,431 | 18% |
39 Properties |
| 2000 | £57,013 | -4% |
38 Properties |
| 1999 | £59,485 | 2% |
38 Properties |
| 1998 | £58,077 | 5% |
31 Properties |
| 1997 | £55,435 | 18% |
34 Properties |
| 1996 | £45,663 | -14% |
18 Properties |
| 1995 | £52,054 | - |
33 Properties |
Property Price per Property Type in Millfield
Here you can find historic sold price data in order to help with your property search.
The average Property Paid Price for specific property types in the last three years are:
| Property Type | Average Sold Price | Sold Properties |
|---|---|---|
| Semi Detached House | £249,414.00 | 61 Semi Detached Houses |
| Detached House | £307,302.00 | 31 Detached Houses |
| Terraced House | £214,916.00 | 12 Terraced Houses |
| Flat | £118,139.00 | 8 Flats |


