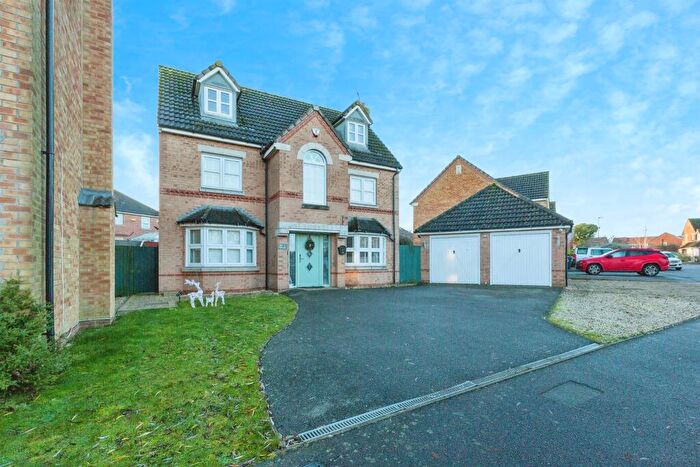
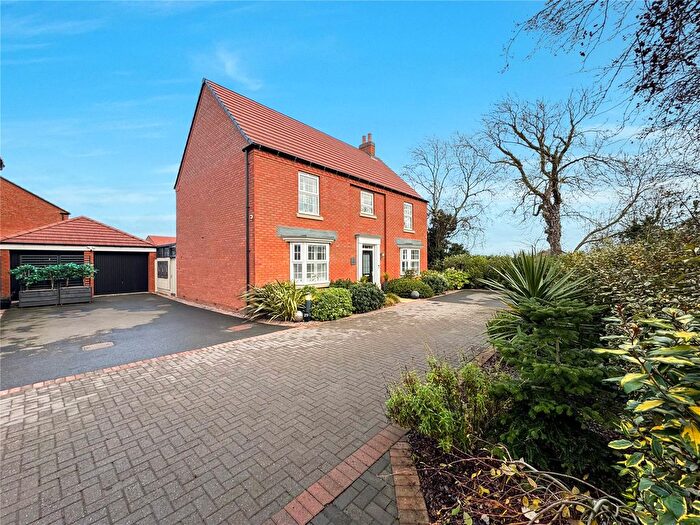
Houses for sale & to rent in Fleckney, Leicester
House Prices in Fleckney
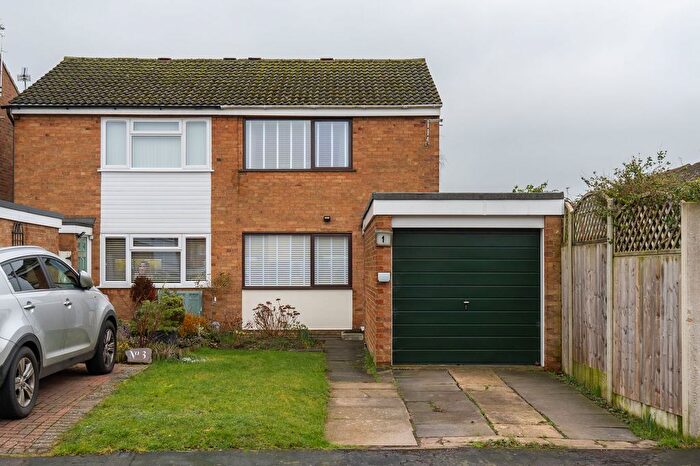
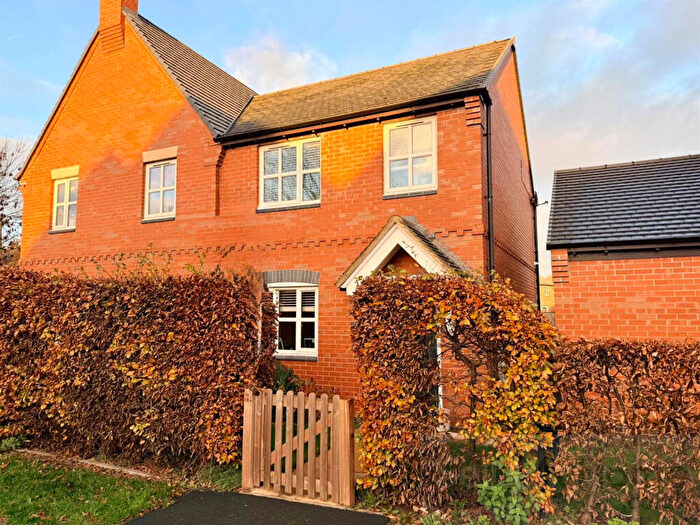
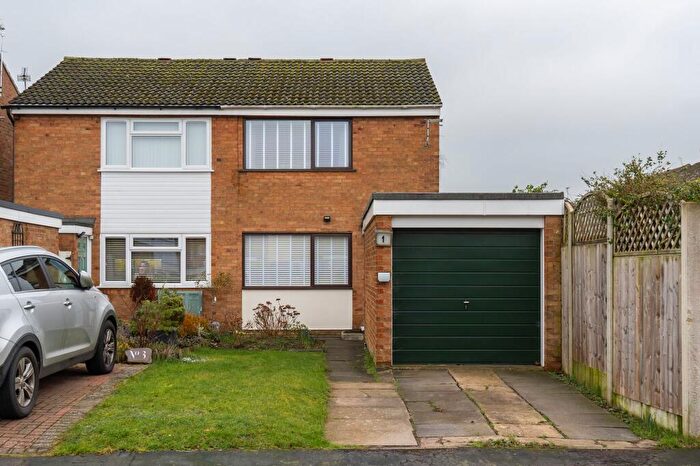
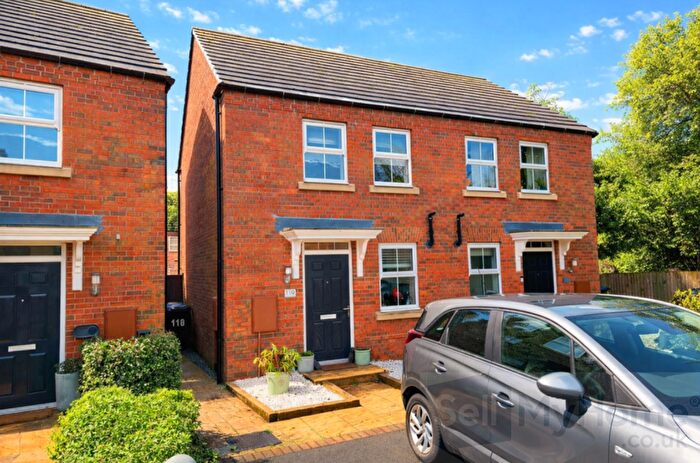
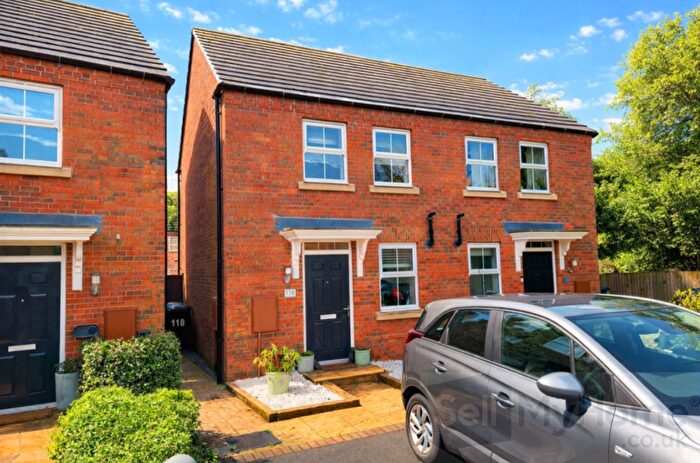
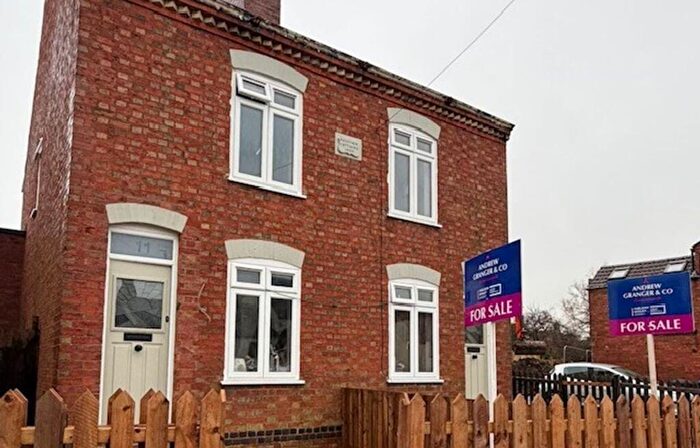
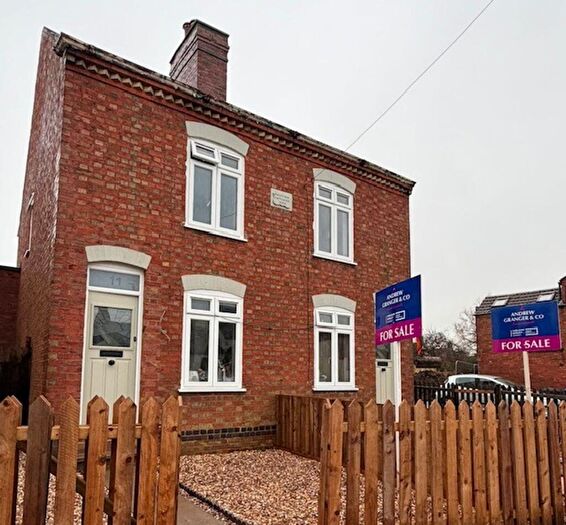
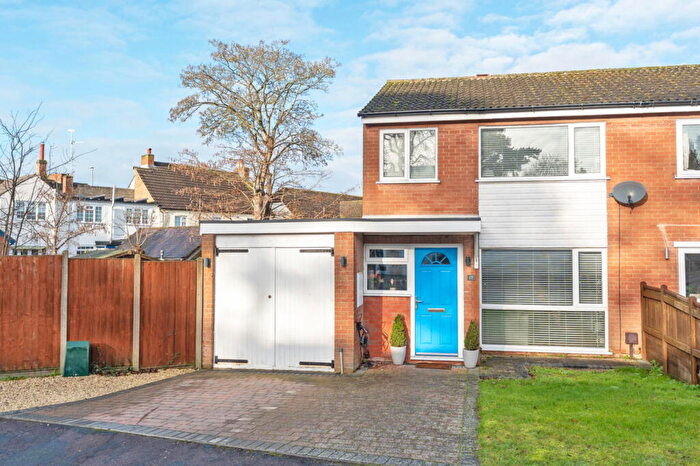
Properties in Fleckney have an average house price of £295,535.00 and had 247 Property Transactions within the last 3 years¹.
Fleckney is an area in Leicester, Leicestershire with 1,991 households², where the most expensive property was sold for £2,400,000.00.
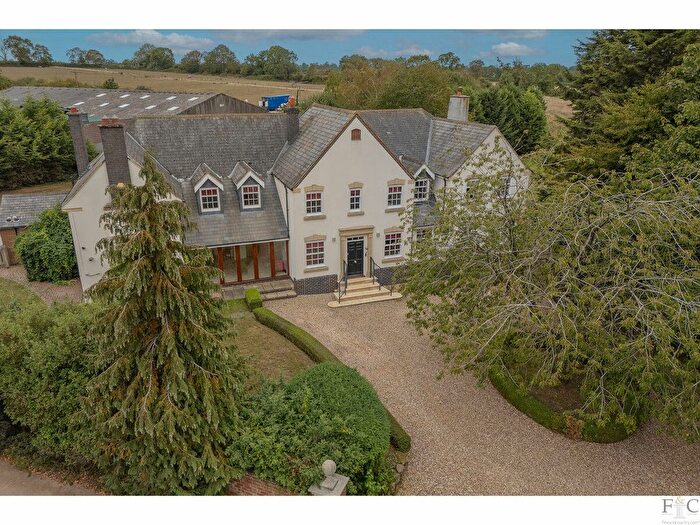
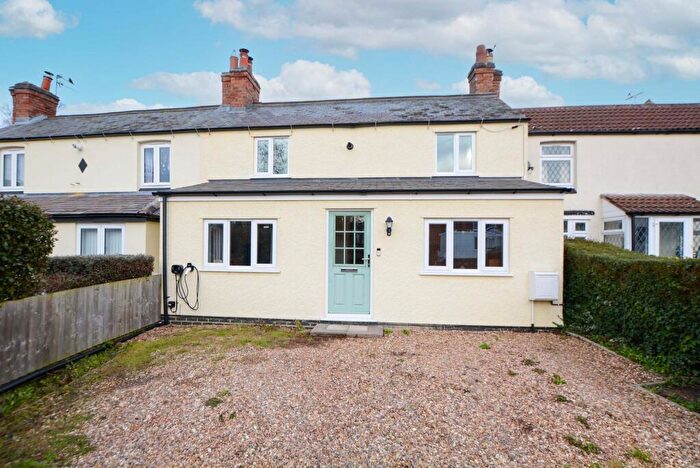
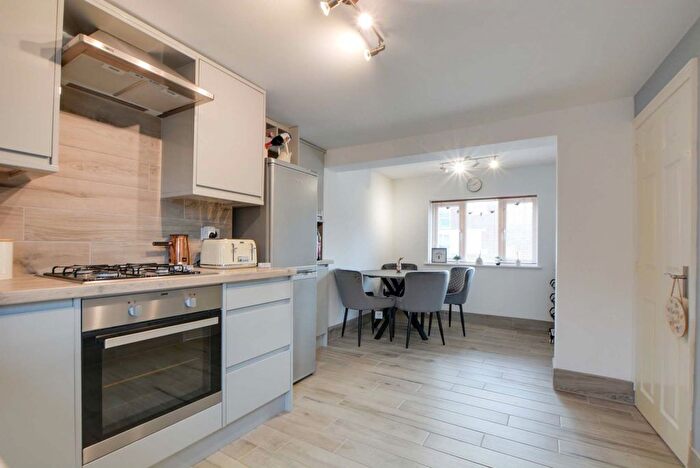
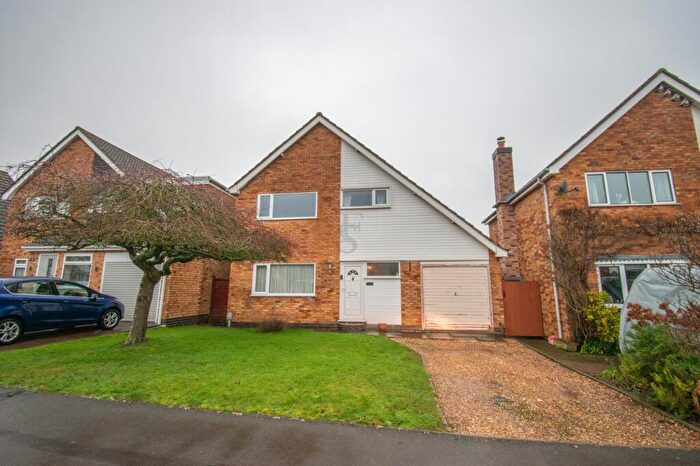
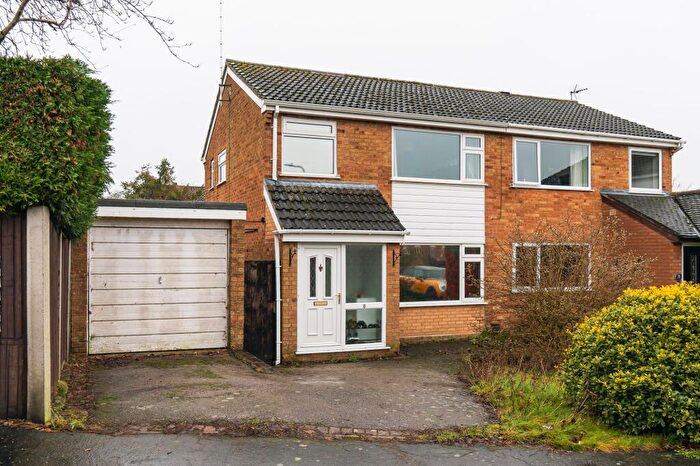
Properties for sale in Fleckney
Roads and Postcodes in Fleckney
Navigate through our locations to find the location of your next house in Fleckney, Leicester for sale or to rent.
| Streets | Postcodes |
|---|---|
| Ainsdale | LE8 8TP |
| Albert Street | LE8 8BA |
| Arnesby Road | LE8 8AQ |
| Badcock Way | LE8 8DD |
| Badger Close | LE8 8DF |
| Barfoot Close | LE8 8TD |
| Batchelor Road | LE8 8BE |
| Blackbird Road | LE8 8EU |
| Bratmyr | LE8 8BJ |
| Bromley Close | LE8 8ET |
| Brookside Gardens | LE8 8AB |
| Bruntingthorpe Road | LE17 6PP LE17 6PR |
| Burton Way | LE8 8DW |
| Byron Close | LE8 8TU LE8 8UP |
| Chapman Drive | LE8 8DX |
| Churchill Way | LE8 8UD |
| Cobwells Close | LE8 8UF |
| Coleman Road | LE8 8BH |
| Coneygrey | LE8 8TA |
| Cottage Mews | LE8 8DP |
| Crossleys | LE8 8BY |
| Deacon Close | LE8 8EB |
| Dribdale | LE8 8TQ |
| Edward Road | LE8 8AD LE8 8UB |
| Elizabeth Close | LE8 8TY |
| Elizabeth Road | LE8 8AE |
| Fell Close | LE8 8DG |
| Fleckney Lane | LE8 8AF |
| Forge Close | LE8 8DA |
| Fox Close | LE8 8DE |
| Freer Road | LE8 8EP |
| Furnival Close | LE8 8DZ |
| Gamble Avenue | LE8 8EA |
| Garner Way | LE8 8EJ LE8 8EL |
| Gladstone Street | LE8 8AG LE8 8AH |
| Goshawk Close | LE8 8EW |
| Hastings Close | LE8 8UG |
| Hensman Close | LE8 8UJ |
| Heycock Close | LE8 8UH |
| High Street | LE8 8AJ LE8 8DN LE8 8DU |
| Highfield Street | LE8 8BD |
| Hobrook Road | LE8 8BT |
| Howlett Road | LE8 8ER |
| Kertley | LE8 8TH |
| Kestrel Close | LE8 8DH |
| Kibworth Road | LE8 8AL LE8 0RJ |
| Kilby Road | LE8 8BL LE8 8BN LE8 8BP LE8 8BQ |
| Lamplighters | LE8 8LL |
| Langdale | LE8 8TF |
| Leicester Road | LE8 8BF LE8 8BG LE17 6ND LE17 6NP LE17 6PB |
| Lodge Road | LE8 8BX |
| Long Grey | LE8 8TB |
| Lovelace Way | LE8 8TT |
| Main Street | LE8 8AN LE8 8AP LE8 0UE |
| Manor Road | LE8 8TN |
| Marlborough Drive | LE8 8UR |
| Marmion Close | LE8 8UL |
| Mattock Drive | LE8 8EE |
| Middletons Close | LE8 8DL |
| Mosswithy | LE8 8BW |
| Orchard Court | LE8 0XY |
| Orchard Street | LE8 8AR LE8 8DQ LE8 8DS LE8 8DR |
| Park Street | LE8 8BB |
| Peberdy Close | LE8 8ES |
| Pells Close | LE8 8TJ |
| Penclose Road | LE8 8TE |
| Priest Meadow | LE8 8TZ LE8 8UA |
| Richmond Close | LE8 8UQ |
| Rowley Close | LE8 8BU |
| Saddington Road | LE8 8AW LE8 8AX LE8 8DT LE17 6NZ LE17 6PX |
| Sawbrook | LE8 8TR |
| School Street | LE8 8AS |
| Shearsby Road | LE8 0QU |
| Short Close | LE8 8TL |
| Shoulbard | LE8 8TX |
| Smith Close | LE8 8EF |
| Stenor Close | LE8 8TG |
| Stores Lane | LE8 8AT |
| Sturgess Lane | LE8 8ED |
| The Meer | LE8 8UN |
| The Parade | LE8 8AY |
| The Springs | LE8 8DB |
| The Wranglands | LE8 8TW |
| Theddingworth Road | LE17 6PZ |
| Tigers Road | LE8 8EG LE8 8EH |
| Victoria Street | LE8 8AZ |
| Wagtail Close | LE8 8DJ |
| Weir Road | LE8 0QY |
| Wentworth Road | LE8 8TS |
| Western Avenue | LE8 8BS |
| Wolsey Close | LE8 8AU |
| Wolsey Lane | LE8 8BR |
| LE17 6PA LE17 6PH LE8 8EN LE8 8WF LE8 8WG LE8 8WW LE8 8UZ |
Transport near Fleckney
- FAQ
- Price Paid By Year
- Property Type Price
Frequently asked questions about Fleckney
What is the average price for a property for sale in Fleckney?
The average price for a property for sale in Fleckney is £295,535. This amount is 5% lower than the average price in Leicester. There are 1,161 property listings for sale in Fleckney.
What streets have the most expensive properties for sale in Fleckney?
The streets with the most expensive properties for sale in Fleckney are Arnesby Road at an average of £2,400,000, Theddingworth Road at an average of £1,050,000 and Fell Close at an average of £475,000.
What streets have the most affordable properties for sale in Fleckney?
The streets with the most affordable properties for sale in Fleckney are Byron Close at an average of £134,125, Dribdale at an average of £147,000 and Orchard Street at an average of £181,772.
Which train stations are available in or near Fleckney?
Some of the train stations available in or near Fleckney are South Wigston, Market Harborough and Narborough.
Property Price Paid in Fleckney by Year
The average sold property price by year was:
| Year | Average Sold Price | Price Change |
Sold Properties
|
|---|---|---|---|
| 2025 | £292,465 | -9% |
82 Properties |
| 2024 | £318,002 | 15% |
91 Properties |
| 2023 | £271,307 | -14% |
74 Properties |
| 2022 | £307,955 | 11% |
131 Properties |
| 2021 | £272,789 | 1% |
188 Properties |
| 2020 | £270,770 | -2% |
119 Properties |
| 2019 | £275,085 | 19% |
98 Properties |
| 2018 | £223,977 | - |
67 Properties |
| 2017 | £223,913 | 11% |
94 Properties |
| 2016 | £198,603 | 2% |
89 Properties |
| 2015 | £195,201 | 3% |
70 Properties |
| 2014 | £189,036 | 12% |
95 Properties |
| 2013 | £165,933 | 6% |
61 Properties |
| 2012 | £155,171 | -1% |
71 Properties |
| 2011 | £157,399 | -17% |
53 Properties |
| 2010 | £183,493 | 14% |
59 Properties |
| 2009 | £158,593 | -8% |
58 Properties |
| 2008 | £172,046 | 3% |
50 Properties |
| 2007 | £166,690 | -1% |
126 Properties |
| 2006 | £168,341 | - |
116 Properties |
| 2005 | £168,387 | 12% |
95 Properties |
| 2004 | £148,557 | -5% |
125 Properties |
| 2003 | £156,121 | 25% |
123 Properties |
| 2002 | £117,198 | 22% |
137 Properties |
| 2001 | £91,556 | 5% |
165 Properties |
| 2000 | £86,827 | 20% |
140 Properties |
| 1999 | £69,185 | 7% |
124 Properties |
| 1998 | £64,420 | 15% |
113 Properties |
| 1997 | £54,949 | -6% |
106 Properties |
| 1996 | £58,082 | 4% |
138 Properties |
| 1995 | £55,566 | - |
129 Properties |
Property Price per Property Type in Fleckney
Here you can find historic sold price data in order to help with your property search.
The average Property Paid Price for specific property types in the last three years are:
| Property Type | Average Sold Price | Sold Properties |
|---|---|---|
| Semi Detached House | £273,781.00 | 62 Semi Detached Houses |
| Detached House | £359,390.00 | 121 Detached Houses |
| Terraced House | £207,982.00 | 56 Terraced Houses |
| Flat | £111,181.00 | 8 Flats |

