
Houses for sale & to rent in Lubenham, Leicester
House Prices in Lubenham
Properties in Lubenham have an average house price of £483k and had 7 Property Transactions within the last 3 years¹.
Lubenham is an area in Leicester, Leicestershire with 99 households², where the most expensive property was sold for £1M.
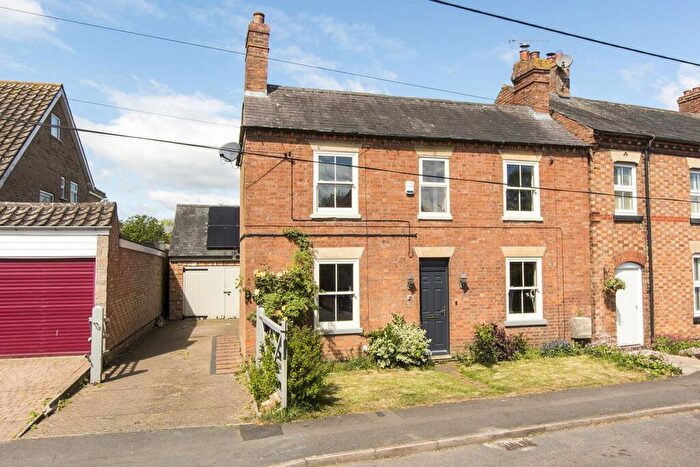
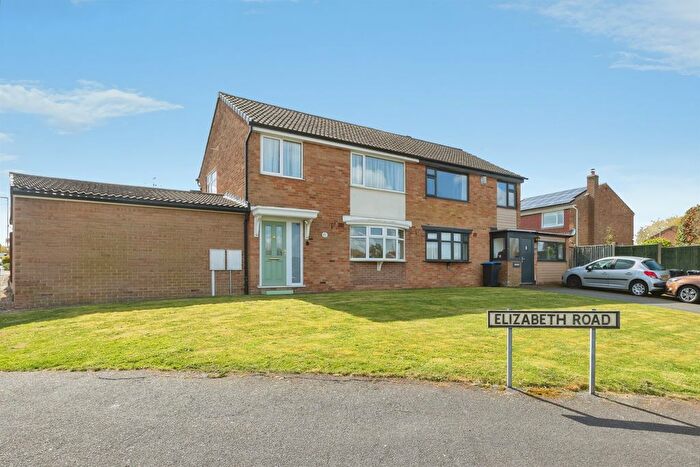
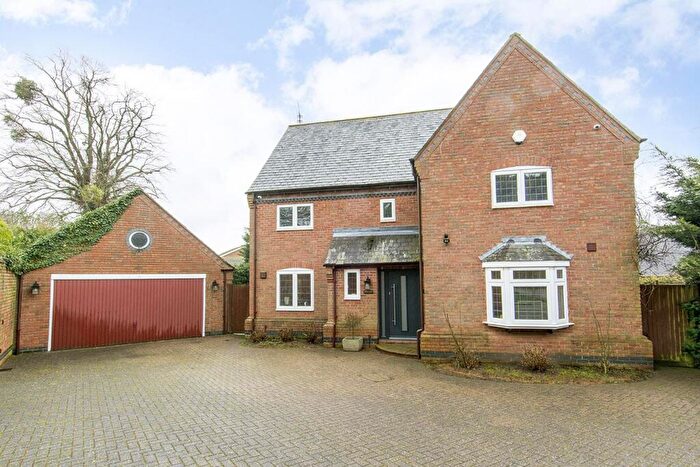
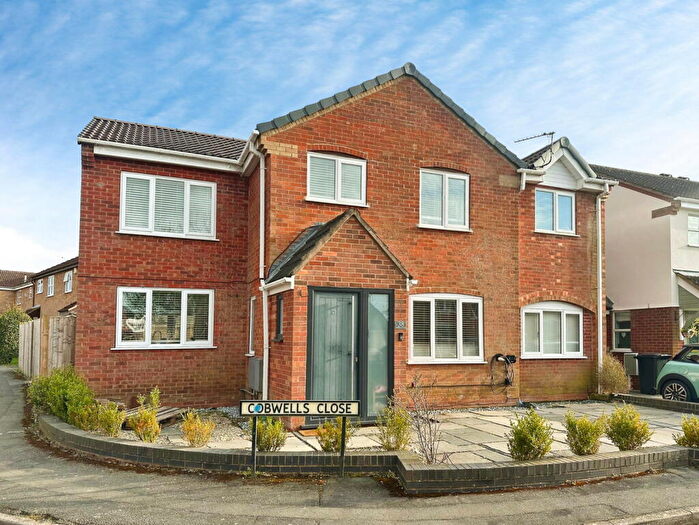
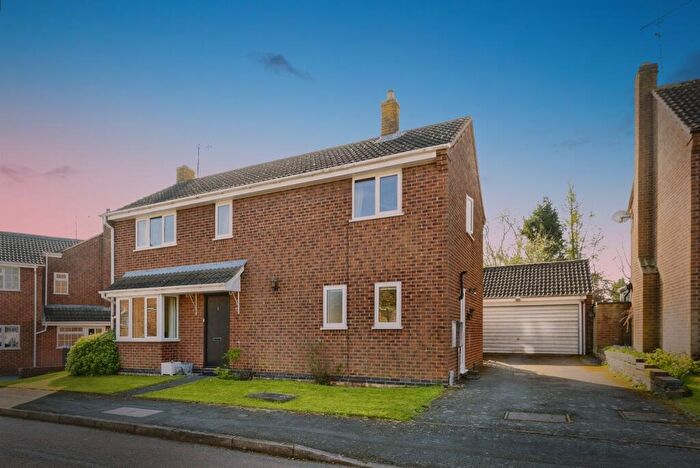
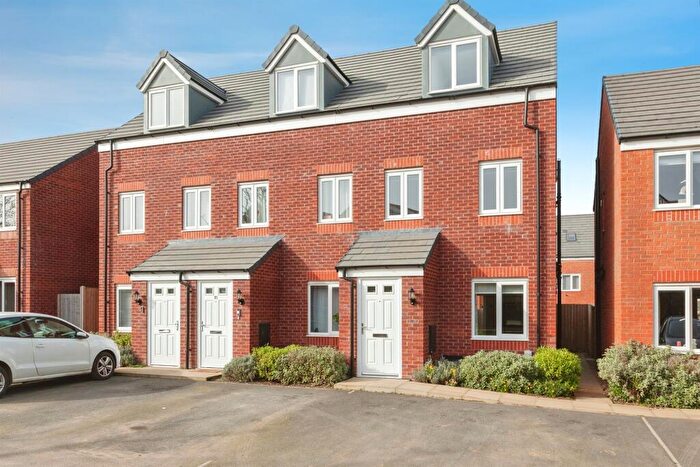
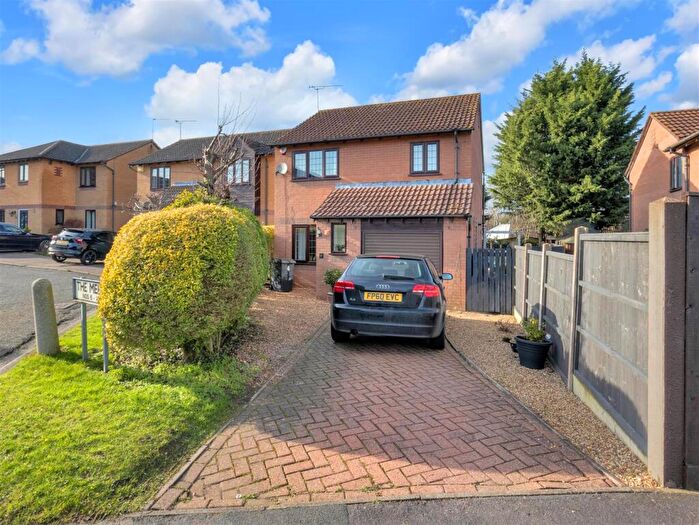
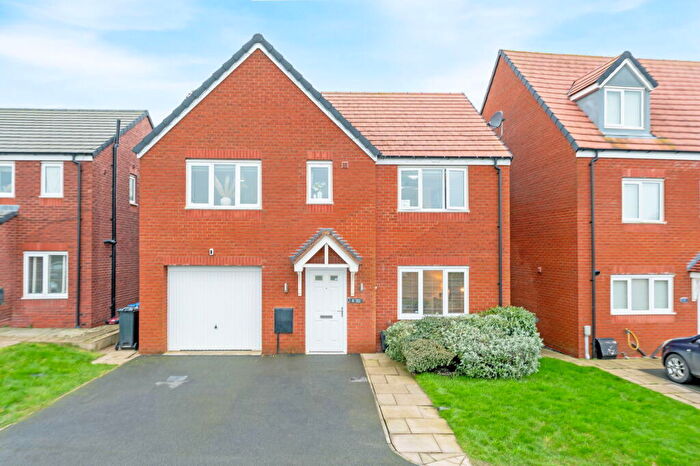
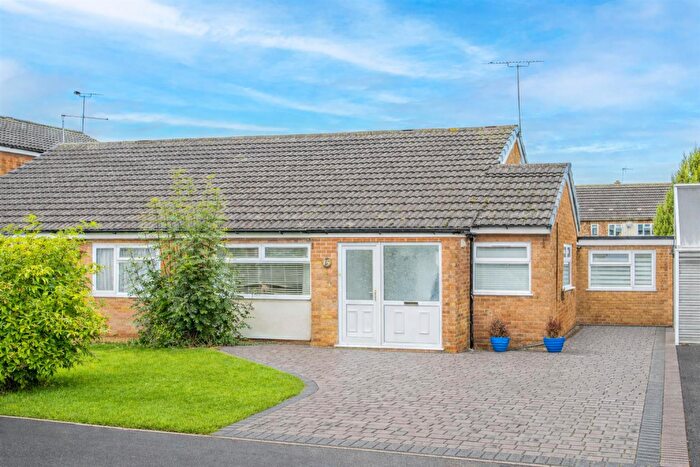
Properties for sale in Lubenham
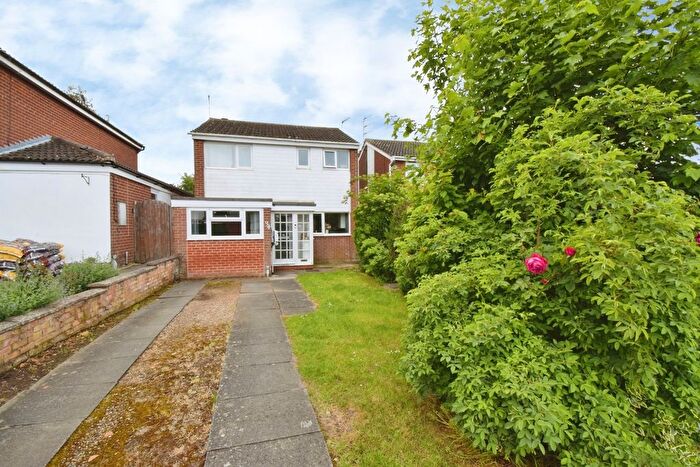
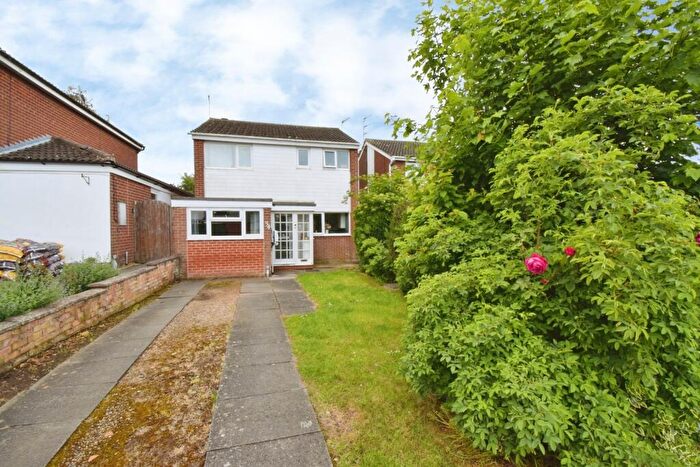
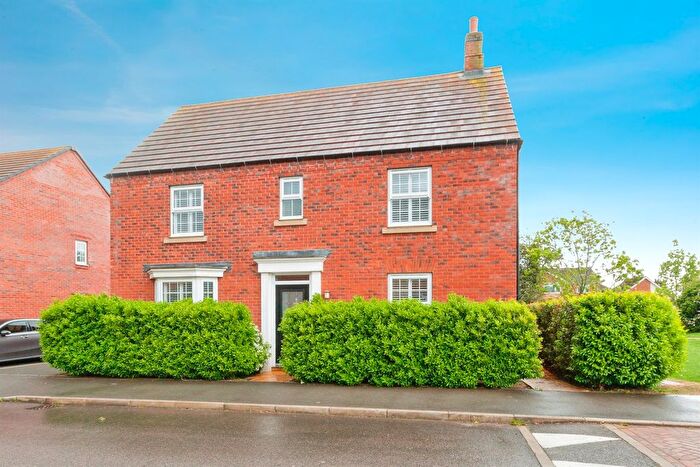
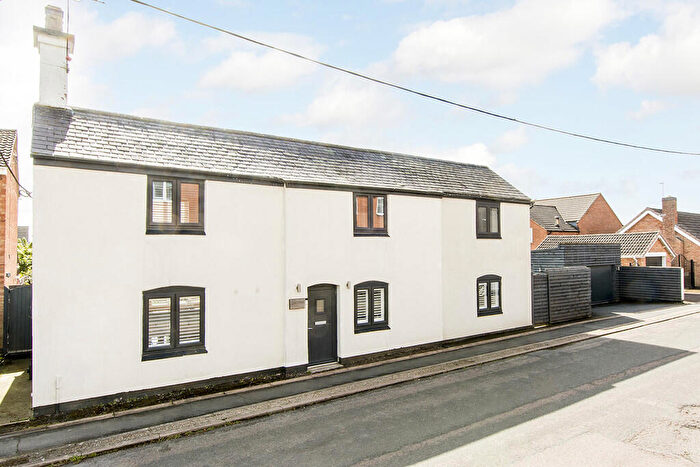
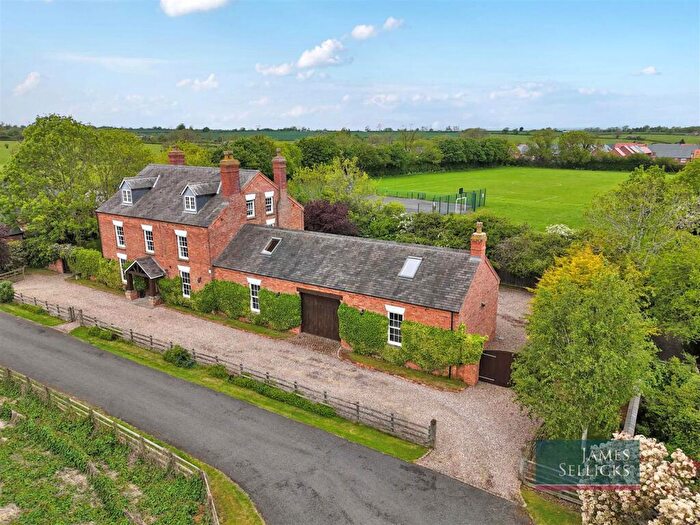
![]()
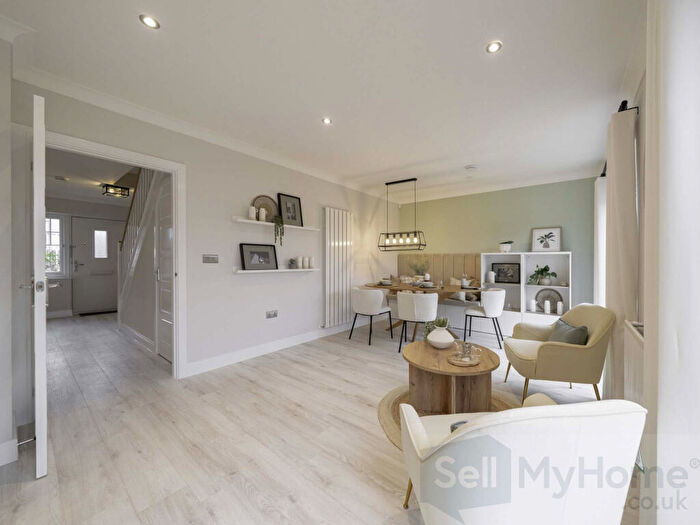
If you are looking to sell your house, let it out, or receive a property valuation, an expert can help you.
Click the button below to get started.
Roads and Postcodes in Lubenham
Navigate through our locations to find the location of your next house in Lubenham, Leicester for sale or to rent.
| Streets | Postcodes |
|---|---|
| Bakehouse Lane | LE8 0QA |
| Bryars Close | LE8 0RH |
| Debdale Wharf | LE8 0XA |
| Main Street | LE8 0QH |
| Mowsley Road | LE8 0QP |
| Smeeton Road | LE8 0QT |
| Weir Road | LE8 0RN |
Transport near Lubenham

- FAQ
- Price Paid By Year
- Property Type Price
Frequently asked questions about Lubenham
What is the average price for a property for sale in Lubenham?
The average price for a property for sale in Lubenham is £482,571. This amount is 54% higher than the average price in Leicester. There are 808 property listings for sale in Lubenham.
What streets have the most expensive properties for sale in Lubenham?
The streets with the most expensive properties for sale in Lubenham are Smeeton Road at an average of £600,000 and Main Street at an average of £529,333.
What streets have the most affordable properties for sale in Lubenham?
The streets with the most affordable properties for sale in Lubenham are Bryars Close at an average of £190,000 and Mowsley Road at an average of £400,000.
Which train stations are available in or near Lubenham?
Some of the train stations available in or near Lubenham are Market Harborough, South Wigston and Narborough.
Property Price Paid in Lubenham by Year
The average sold property price by year was:
| Year | Average Sold Price | Price Change |
Sold Properties
|
|---|---|---|---|
| 2025 | £421,500 | -7% |
2 Properties |
| 2024 | £452,500 | -60% |
4 Properties |
| 2023 | £725,000 | 27% |
1 Property |
| 2022 | £530,000 | -8% |
1 Property |
| 2021 | £575,000 | 1% |
2 Properties |
| 2020 | £567,500 | 36% |
3 Properties |
| 2019 | £362,000 | -31% |
1 Property |
| 2018 | £474,166 | 48% |
3 Properties |
| 2017 | £245,000 | -63% |
1 Property |
| 2016 | £398,600 | 9% |
5 Properties |
| 2015 | £362,000 | -22% |
3 Properties |
| 2014 | £442,000 | 67% |
4 Properties |
| 2013 | £146,500 | -48% |
1 Property |
| 2012 | £217,500 | -104% |
1 Property |
| 2011 | £444,375 | 33% |
4 Properties |
| 2010 | £298,000 | 21% |
4 Properties |
| 2009 | £235,000 | 0,2% |
1 Property |
| 2008 | £234,500 | -108% |
2 Properties |
| 2007 | £488,750 | 17% |
4 Properties |
| 2006 | £405,890 | -16% |
5 Properties |
| 2005 | £470,250 | 60% |
4 Properties |
| 2004 | £190,000 | -66% |
2 Properties |
| 2003 | £316,250 | 17% |
4 Properties |
| 2002 | £261,083 | 27% |
6 Properties |
| 2001 | £189,625 | 7% |
4 Properties |
| 2000 | £175,750 | 46% |
2 Properties |
| 1999 | £95,000 | -60% |
1 Property |
| 1998 | £151,583 | 37% |
6 Properties |
| 1997 | £95,944 | -11% |
3 Properties |
| 1996 | £106,666 | 23% |
3 Properties |
| 1995 | £82,000 | - |
2 Properties |
Property Price per Property Type in Lubenham
Here you can find historic sold price data in order to help with your property search.
The average Property Paid Price for specific property types in the last three years are:
| Property Type | Average Sold Price | Sold Properties |
|---|---|---|
| Semi Detached House | £445,000.00 | 3 Semi Detached Houses |
| Terraced House | £443,000.00 | 1 Terraced House |
| Detached House | £533,333.00 | 3 Detached Houses |