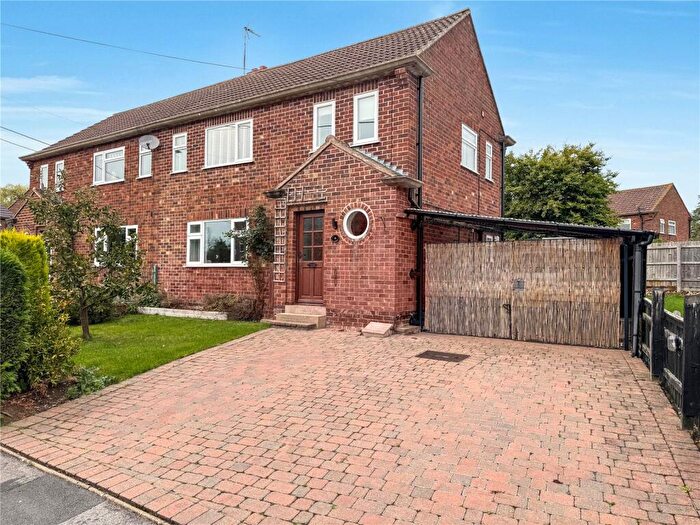
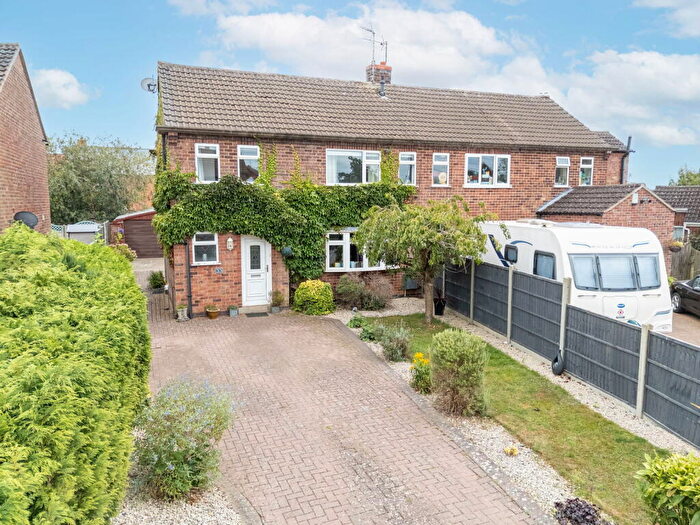
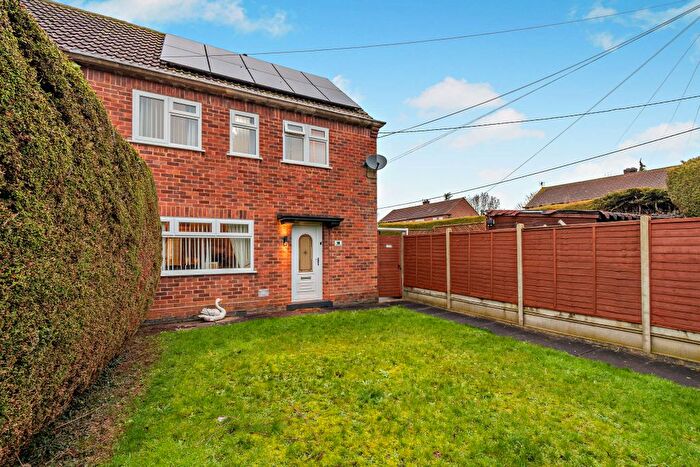
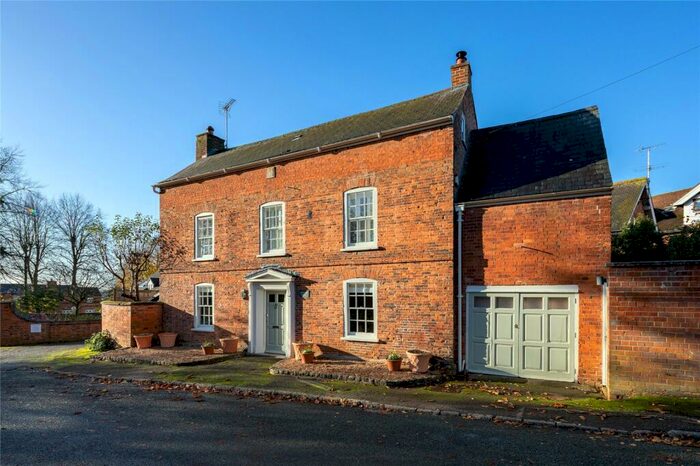
Houses for sale & to rent in Kibworth, Market Harborough
House Prices in Kibworth
Properties in Kibworth have an average house price of £757,614.00 and had 20 Property Transactions within the last 3 years¹.
Kibworth is an area in Market Harborough, Leicestershire with 277 households², where the most expensive property was sold for £1,600,000.00.
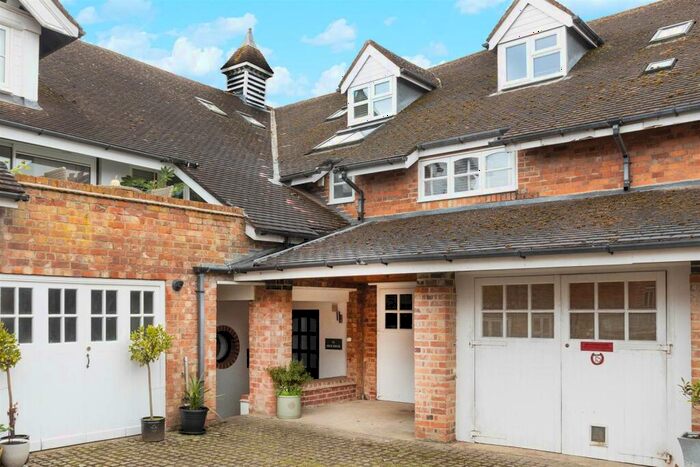
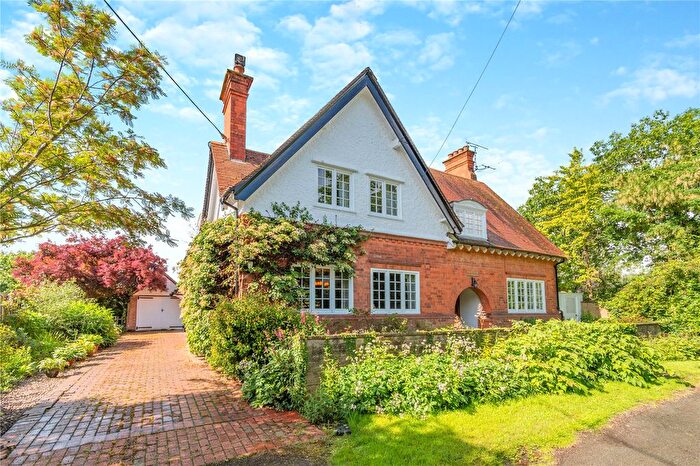
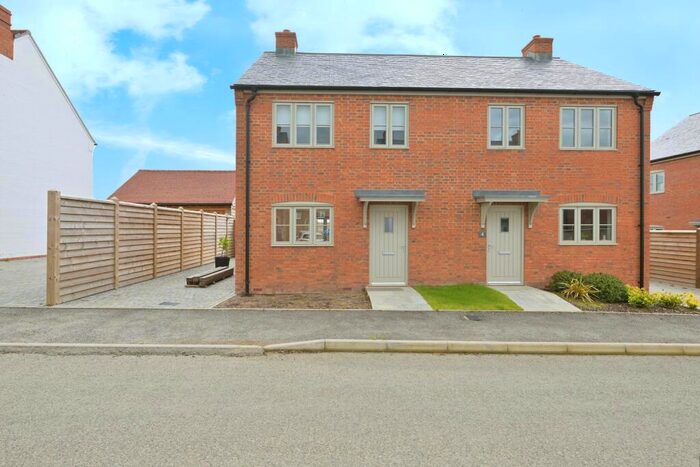
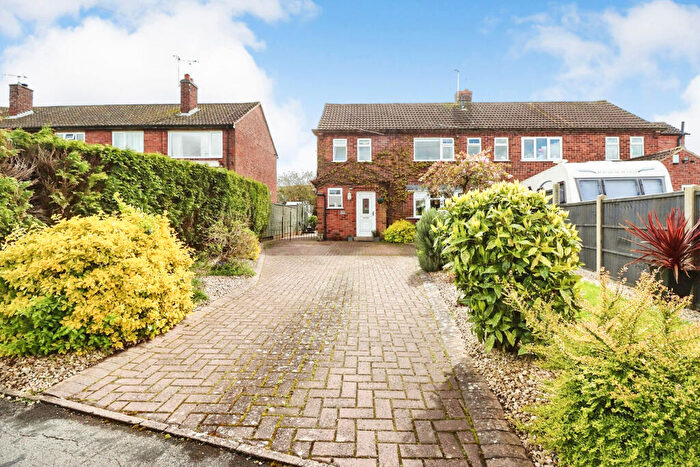
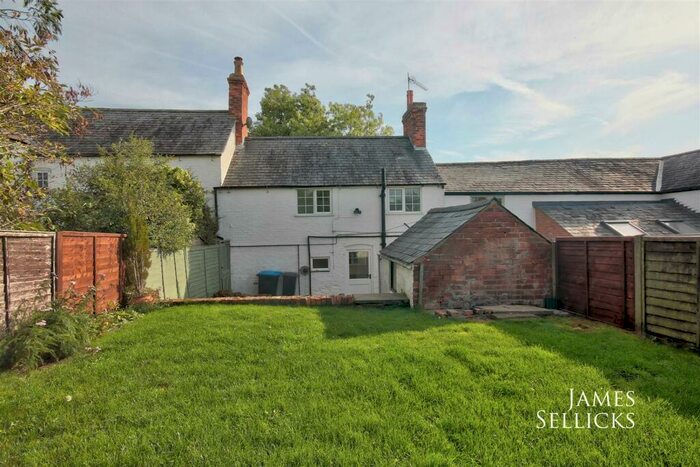
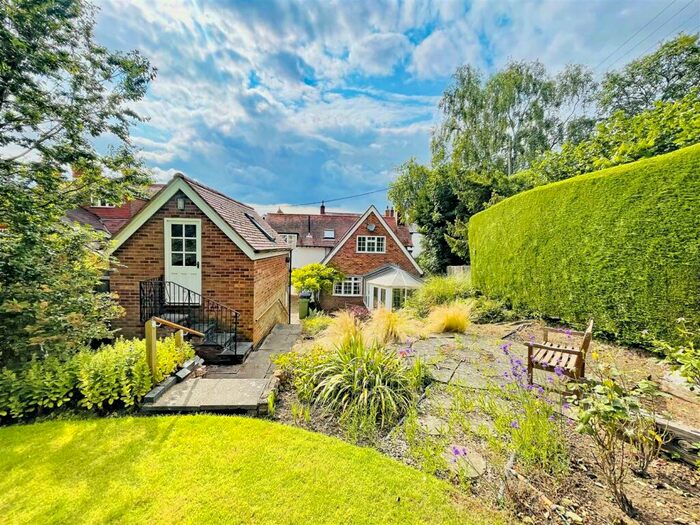
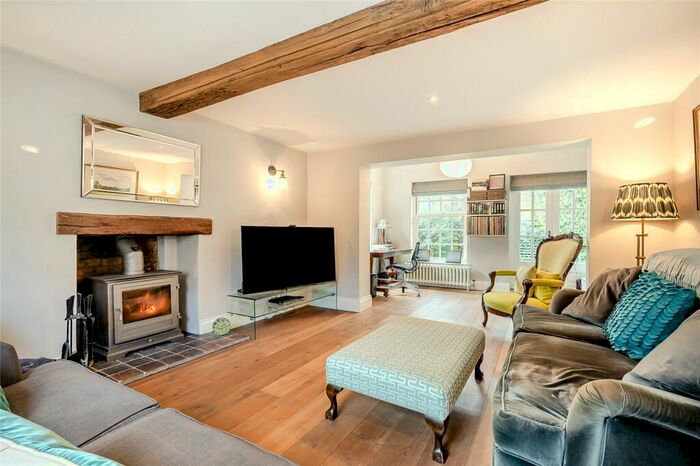
Properties for sale in Kibworth
Previously listed properties in Kibworth
Roads and Postcodes in Kibworth
Navigate through our locations to find the location of your next house in Kibworth, Market Harborough for sale or to rent.
| Streets | Postcodes |
|---|---|
| Back Lane | LE16 7TB |
| Bowden Road | LE16 7TP |
| Brook Lane | LE16 7SG |
| Church Causeway | LE16 7SU |
| Church Lane | LE16 7SX LE16 7TR |
| Fernie Chase | LE16 7SE |
| Grange Lane | LE16 7SD LE16 7TF |
| Langton Road | LE16 7TQ |
| Main Street | LE16 7SY LE16 7TN LE16 7TS LE16 7TW |
| May Cottages | LE16 7TD |
| Melton Road | LE16 7TG LE16 7TH |
| Old School Walk | LE16 7FW |
| Stonton Road | LE16 7SZ |
| The Limes | LE16 7UN |
| The Old Stable Yard | LE16 7SB |
| Thornton Crescent | LE16 7TA |
| Welham Road | LE16 7TU |
| West Langton Road | LE16 7TY LE16 7UZ |
Transport near Kibworth
-
Market Harborough Station
-
South Wigston Station
-
Corby Station
-
Leicester Station
-
Narborough Station
-
Kettering Station
-
Oakham Station
-
Syston Station
- FAQ
- Price Paid By Year
- Property Type Price
Frequently asked questions about Kibworth
What is the average price for a property for sale in Kibworth?
The average price for a property for sale in Kibworth is £757,614. This amount is 101% higher than the average price in Market Harborough. There are 33 property listings for sale in Kibworth.
What streets have the most expensive properties for sale in Kibworth?
The streets with the most expensive properties for sale in Kibworth are Bowden Road at an average of £1,063,750, Main Street at an average of £936,650 and West Langton Road at an average of £856,666.
What streets have the most affordable properties for sale in Kibworth?
The streets with the most affordable properties for sale in Kibworth are Thornton Crescent at an average of £330,000, Melton Road at an average of £461,840 and Church Lane at an average of £529,000.
Which train stations are available in or near Kibworth?
Some of the train stations available in or near Kibworth are Market Harborough, South Wigston and Corby.
Property Price Paid in Kibworth by Year
The average sold property price by year was:
| Year | Average Sold Price | Price Change |
Sold Properties
|
|---|---|---|---|
| 2025 | £754,960 | 9% |
4 Properties |
| 2024 | £685,995 | -28% |
10 Properties |
| 2023 | £878,750 | 20% |
6 Properties |
| 2022 | £703,939 | 23% |
11 Properties |
| 2021 | £540,446 | -9% |
14 Properties |
| 2020 | £590,000 | 21% |
5 Properties |
| 2019 | £468,845 | 3% |
10 Properties |
| 2018 | £452,500 | -15% |
8 Properties |
| 2017 | £522,400 | -0,4% |
10 Properties |
| 2016 | £524,625 | 13% |
8 Properties |
| 2015 | £455,714 | - |
7 Properties |
| 2014 | £455,621 | 15% |
10 Properties |
| 2013 | £385,214 | 2% |
7 Properties |
| 2012 | £376,961 | -31% |
9 Properties |
| 2011 | £494,045 | 17% |
11 Properties |
| 2010 | £410,368 | -36% |
16 Properties |
| 2009 | £557,100 | 27% |
5 Properties |
| 2008 | £407,607 | -4% |
14 Properties |
| 2007 | £424,833 | 12% |
17 Properties |
| 2006 | £372,416 | -12% |
18 Properties |
| 2005 | £416,450 | 13% |
11 Properties |
| 2004 | £362,600 | 22% |
10 Properties |
| 2003 | £283,500 | -47% |
11 Properties |
| 2002 | £416,363 | 49% |
15 Properties |
| 2001 | £213,460 | 9% |
14 Properties |
| 2000 | £194,416 | 16% |
12 Properties |
| 1999 | £162,474 | 4% |
21 Properties |
| 1998 | £156,430 | 6% |
18 Properties |
| 1997 | £146,864 | 46% |
10 Properties |
| 1996 | £78,618 | -24% |
8 Properties |
| 1995 | £97,509 | - |
11 Properties |
Property Price per Property Type in Kibworth
Here you can find historic sold price data in order to help with your property search.
The average Property Paid Price for specific property types in the last three years are:
| Property Type | Average Sold Price | Sold Properties |
|---|---|---|
| Semi Detached House | £330,000.00 | 1 Semi Detached House |
| Terraced House | £650,750.00 | 4 Terraced Houses |
| Detached House | £814,619.00 | 15 Detached Houses |

