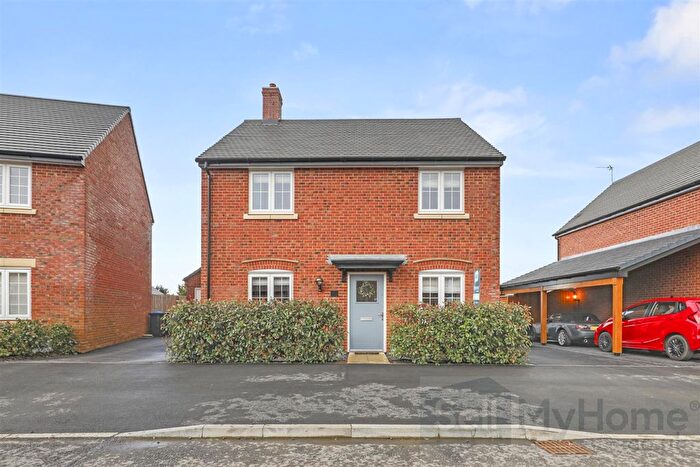
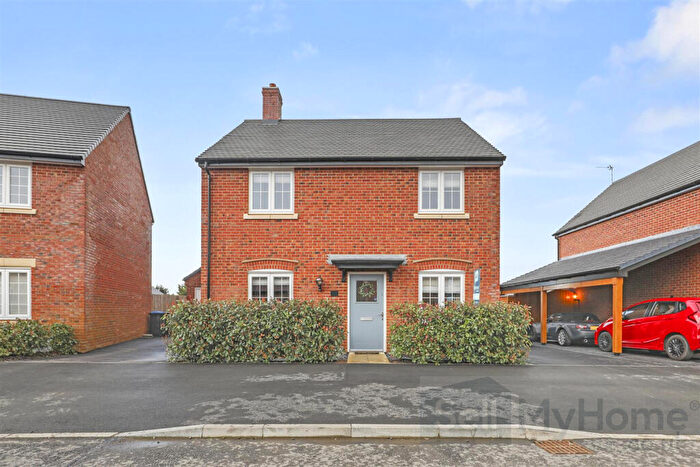
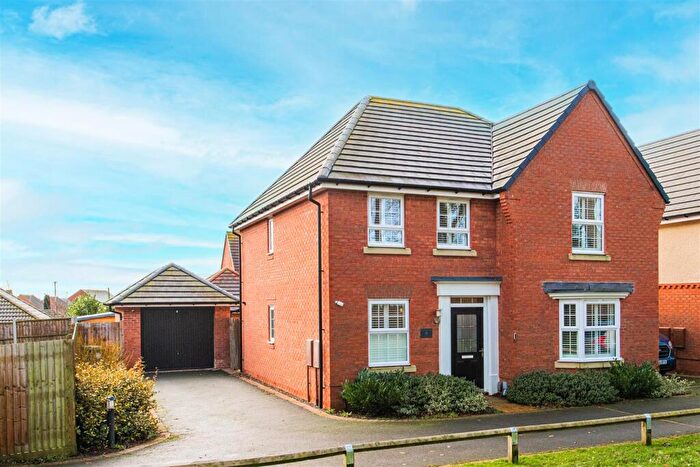
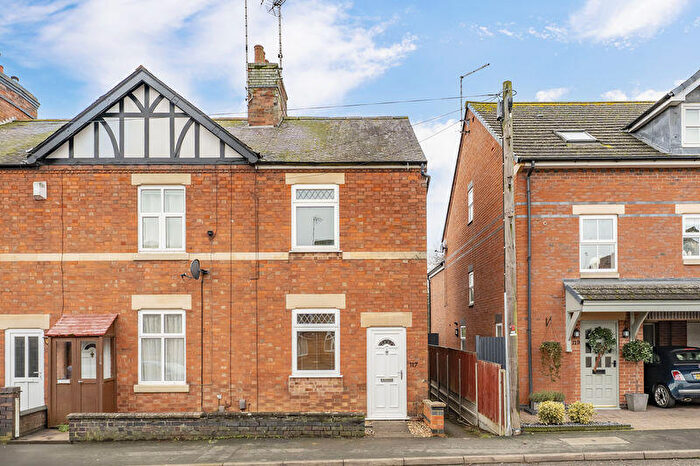
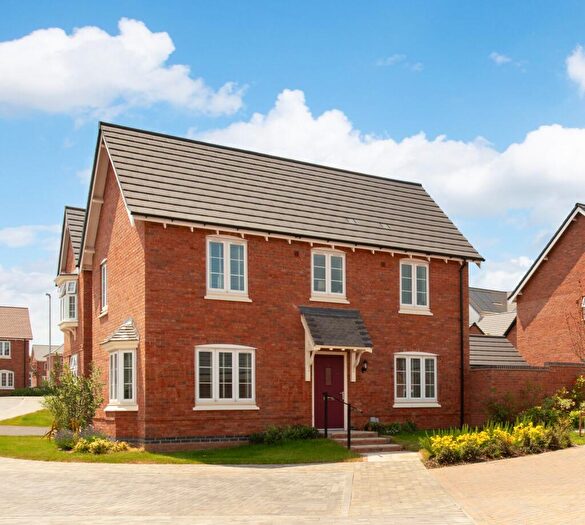
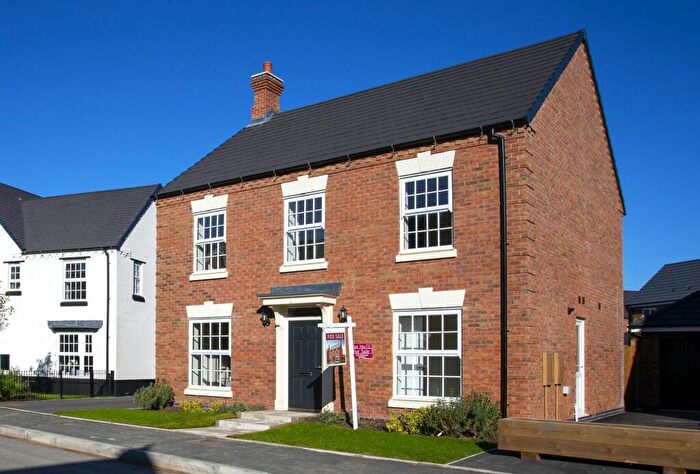
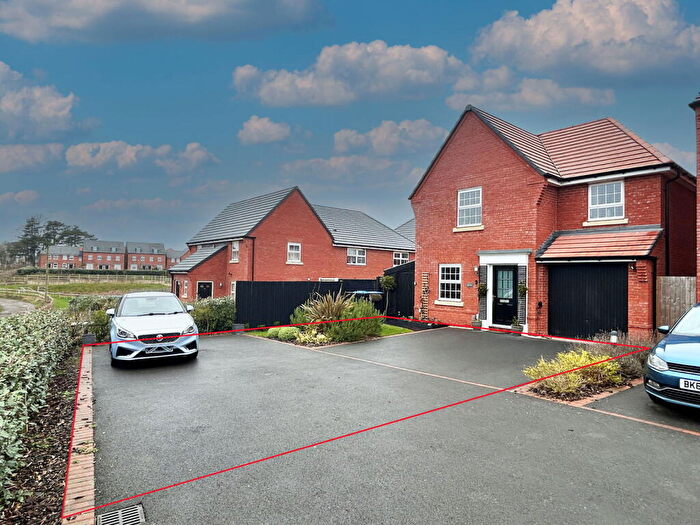
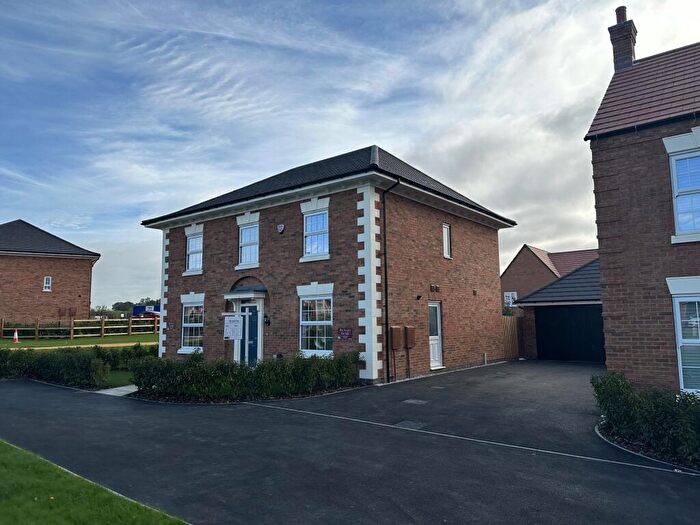
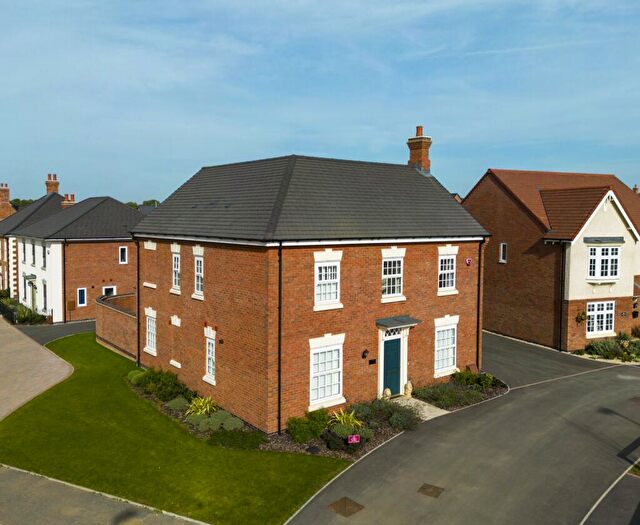
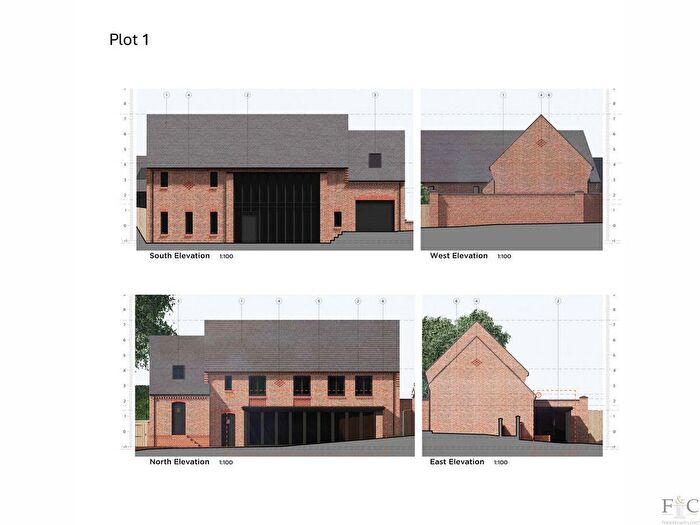
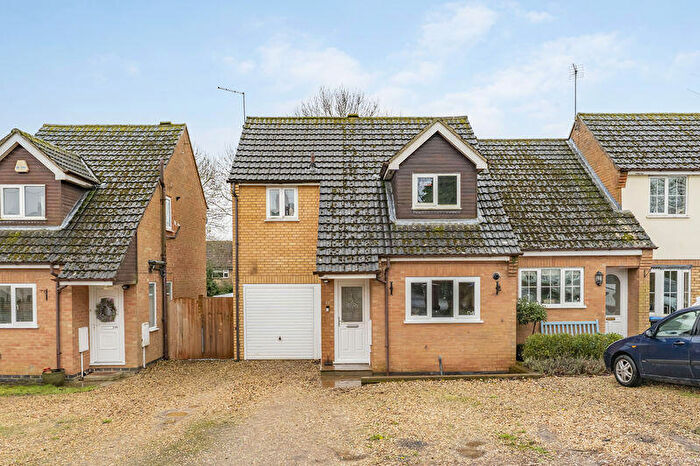
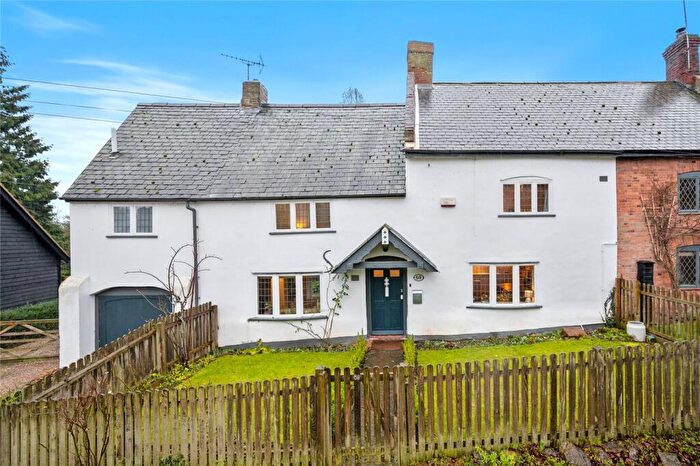
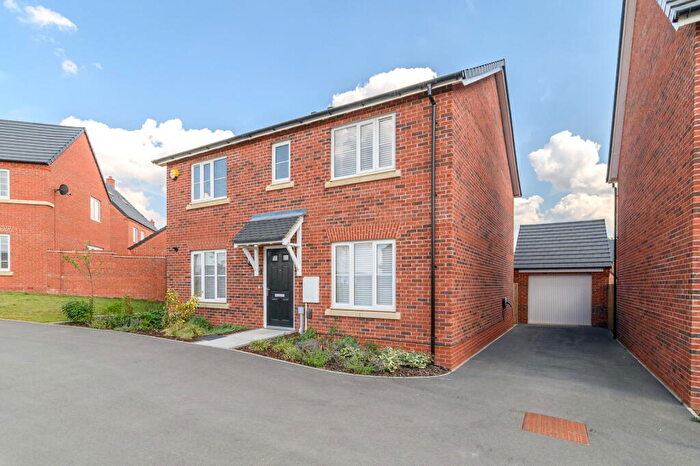
Houses for sale & to rent in Lubenham, Market Harborough
House Prices in Lubenham
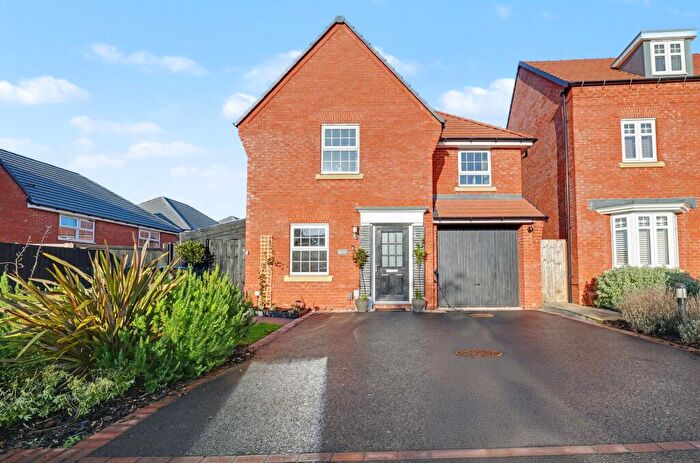
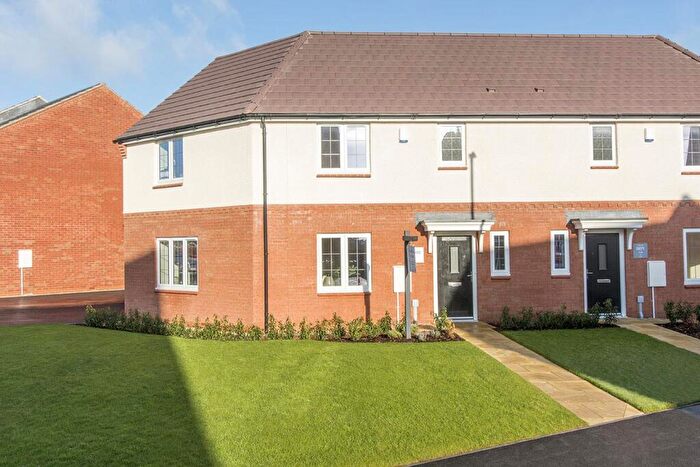
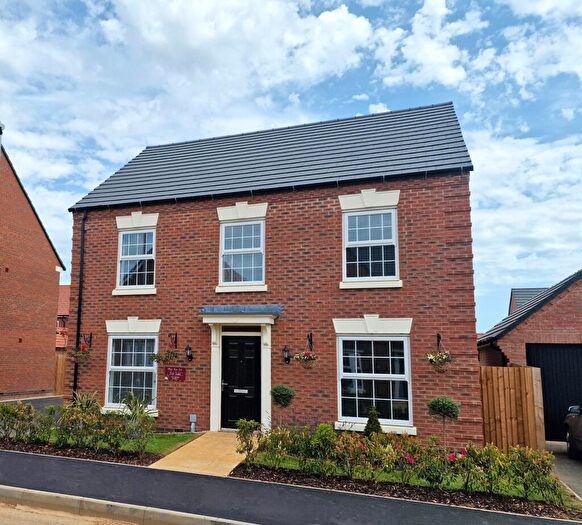
Properties in Lubenham have an average house price of £419,942.00 and had 92 Property Transactions within the last 3 years¹.
Lubenham is an area in Market Harborough, Leicestershire with 712 households², where the most expensive property was sold for £1,000,000.00.
Properties for sale in Lubenham
Roads and Postcodes in Lubenham
Navigate through our locations to find the location of your next house in Lubenham, Market Harborough for sale or to rent.
| Streets | Postcodes |
|---|---|
| Acorn Close | LE16 9SP |
| Airfield Road | LE16 7BY |
| Anson Drive | LE16 7GZ |
| Carroll Street | LE16 7FJ |
| Cheney Avenue | LE16 7GS |
| Church Walk | LE16 9TA |
| Clarkes Avenue | LE16 9NJ |
| Connell Close | LE16 9UT |
| Dalby Lane | LE16 7QY |
| Fishers Farm Lane | LE16 7YN |
| Foxton Road | LE16 9TB LE16 7QZ LE16 7RY |
| Gallow Field Road | LE16 7QB LE16 7QX |
| Grand Union Road | LE16 7FG |
| Guiver Drive | LE16 7DP |
| Gumley Road | LE16 7RR LE16 7RS LE16 7RA |
| Harborough Road | LE16 9SZ |
| Hardy Road | LE16 7AW |
| Harrison Road | LE16 7UL |
| Harvest Road | LE16 7BX |
| Hog Lane | LE16 7SH |
| Johnsons Lane | LE16 9PP |
| Kimble Close | LE16 7EB |
| Laughton Court | LE16 9UW |
| Laughton Road | LE16 7RT LE16 9TE |
| Leicester Road | LE16 7QT |
| Little Plough | LE16 9UY |
| Lord Close | LE16 7FT |
| Main Street | LE16 7RB LE16 7RD LE16 7RU LE16 9TF |
| Martinet Close | LE16 7GB |
| Mccudden Avenue | LE16 7EN |
| Middle Street | LE16 7RE |
| Mill Hill | LE16 9TH |
| Nichols Avenue | LE16 7FX |
| North Lane | LE16 7RF |
| Old Hall Lane | LE16 9TJ |
| Owen Way | LE16 7EA |
| Paget Road | LE16 9TL |
| Palmer Drive | LE16 7FY |
| Park Close | LE16 7RG |
| Raby Drive | LE16 7FB |
| Roberts Close | LE16 7DQ |
| Rushes Lane | LE16 9TN |
| Saunts Close | LE16 9NH |
| School Lane | LE16 9TW |
| Smeeton Road | LE16 7RX |
| Stafford Way | LE16 7EF |
| Stuart Crescent | LE16 7RL |
| Swedish Close | LE16 7RQ |
| Swingbridge Street | LE16 7RH |
| The Green | LE16 9TD |
| The Hawthorns | LE16 9TG |
| Theddingworth Road | LE16 9TP |
| Thomas Avenue | LE16 7BZ |
| Three Corner Close | LE16 9UZ |
| Tower Court | LE16 9SY |
| Vicarage Drive | LE16 7RJ |
| Wadsworth Close | LE16 7GG |
| Welland Avenue | LE16 7RN LE16 7RW |
| Wellington Way | LE16 7WB |
| Westgate Lane | LE16 9TS |
| Westland Close | LE16 9UN |
| Wilson Grove | LE16 7EE |
| Woodgate | LE16 7RZ |
| Woodward Drive | LE16 7GE |
| LE16 7RP |
Transport near Lubenham
-
Market Harborough Station
-
South Wigston Station
-
Narborough Station
-
Corby Station
-
Kettering Station
-
Leicester Station
-
Rugby Station
-
Long Buckby Station
-
Syston Station
- FAQ
- Price Paid By Year
- Property Type Price
Frequently asked questions about Lubenham
What is the average price for a property for sale in Lubenham?
The average price for a property for sale in Lubenham is £419,942. This amount is 11% higher than the average price in Market Harborough. There are 1,156 property listings for sale in Lubenham.
What streets have the most expensive properties for sale in Lubenham?
The streets with the most expensive properties for sale in Lubenham are Swingbridge Street at an average of £699,000, Old Hall Lane at an average of £642,500 and Main Street at an average of £578,357.
What streets have the most affordable properties for sale in Lubenham?
The streets with the most affordable properties for sale in Lubenham are Welland Avenue at an average of £242,125, School Lane at an average of £258,000 and Connell Close at an average of £268,000.
Which train stations are available in or near Lubenham?
Some of the train stations available in or near Lubenham are Market Harborough, South Wigston and Narborough.
Property Price Paid in Lubenham by Year
The average sold property price by year was:
| Year | Average Sold Price | Price Change |
Sold Properties
|
|---|---|---|---|
| 2025 | £478,962 | 14% |
28 Properties |
| 2024 | £410,420 | 9% |
35 Properties |
| 2023 | £374,448 | 5% |
29 Properties |
| 2022 | £353,983 | -8% |
86 Properties |
| 2021 | £381,478 | -7% |
73 Properties |
| 2020 | £407,504 | 5% |
76 Properties |
| 2019 | £389,143 | 4% |
45 Properties |
| 2018 | £375,044 | 4% |
28 Properties |
| 2017 | £360,813 | 9% |
40 Properties |
| 2016 | £326,711 | 6% |
26 Properties |
| 2015 | £308,538 | 17% |
26 Properties |
| 2014 | £255,585 | -9% |
17 Properties |
| 2013 | £278,562 | -17% |
27 Properties |
| 2012 | £326,239 | -5% |
23 Properties |
| 2011 | £343,050 | 13% |
14 Properties |
| 2010 | £299,555 | 36% |
28 Properties |
| 2009 | £192,628 | -64% |
19 Properties |
| 2008 | £315,442 | 8% |
16 Properties |
| 2007 | £290,822 | 18% |
37 Properties |
| 2006 | £238,585 | -10% |
38 Properties |
| 2005 | £262,577 | -19% |
31 Properties |
| 2004 | £312,625 | 36% |
27 Properties |
| 2003 | £200,512 | 5% |
41 Properties |
| 2002 | £190,748 | 18% |
30 Properties |
| 2001 | £156,754 | 34% |
32 Properties |
| 2000 | £103,335 | 4% |
35 Properties |
| 1999 | £98,876 | 21% |
43 Properties |
| 1998 | £78,000 | -10% |
43 Properties |
| 1997 | £85,484 | 27% |
35 Properties |
| 1996 | £62,150 | -42% |
26 Properties |
| 1995 | £88,074 | - |
32 Properties |
Property Price per Property Type in Lubenham
Here you can find historic sold price data in order to help with your property search.
The average Property Paid Price for specific property types in the last three years are:
| Property Type | Average Sold Price | Sold Properties |
|---|---|---|
| Semi Detached House | £335,779.00 | 33 Semi Detached Houses |
| Detached House | £519,161.00 | 46 Detached Houses |
| Terraced House | £279,500.00 | 10 Terraced Houses |
| Flat | £292,500.00 | 3 Flats |

