
Houses for sale & to rent in Market Harborough, Leicestershire
House Prices in Market Harborough
Properties in Market Harborough have an average house price of £377k and had 1,636 Property Transactions within the last 3 years.¹
Market Harborough is an area in Leicestershire with 11,857 households², where the most expensive property was sold for £2.7M.
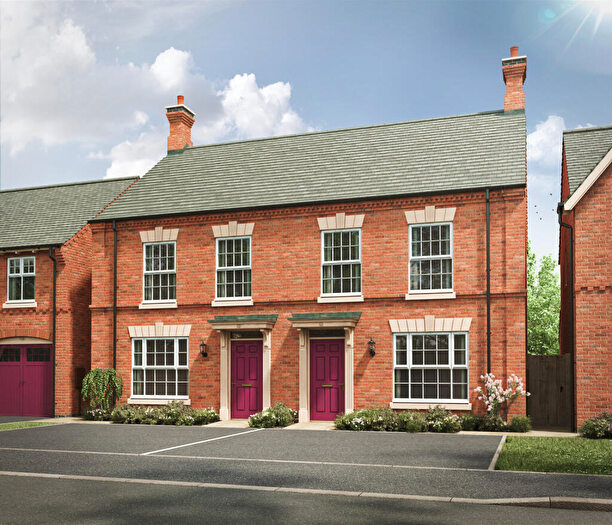
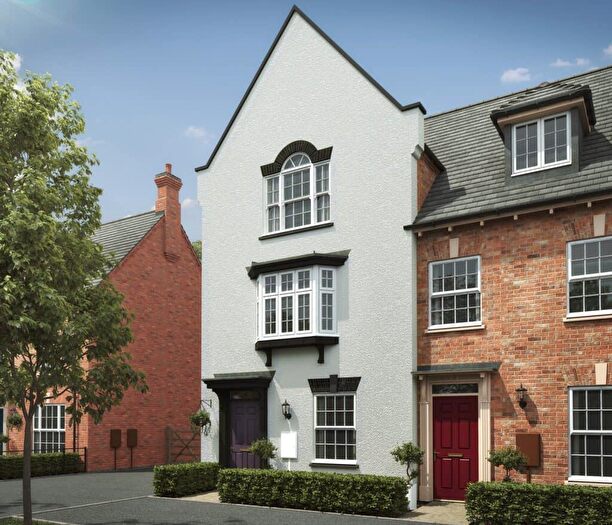
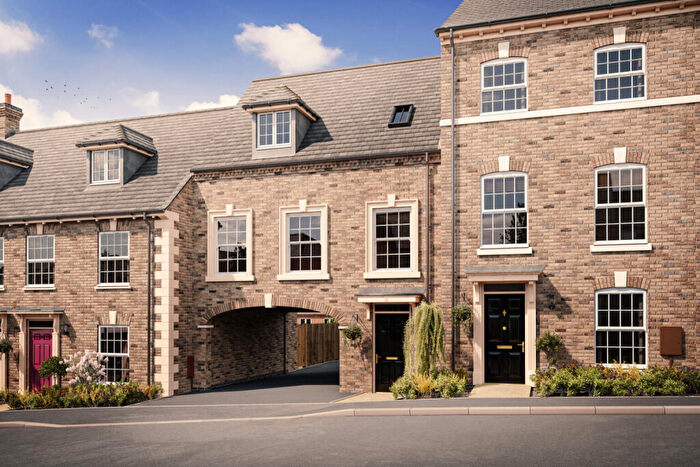
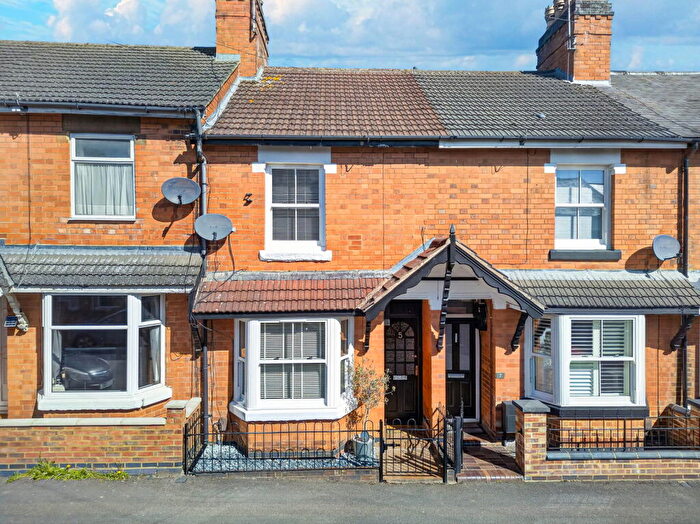
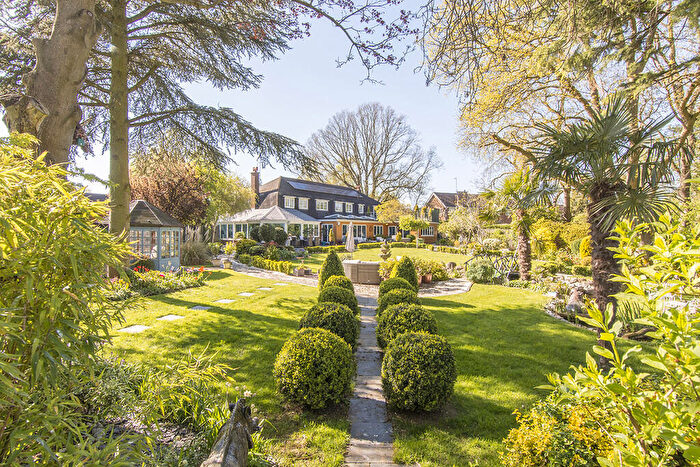
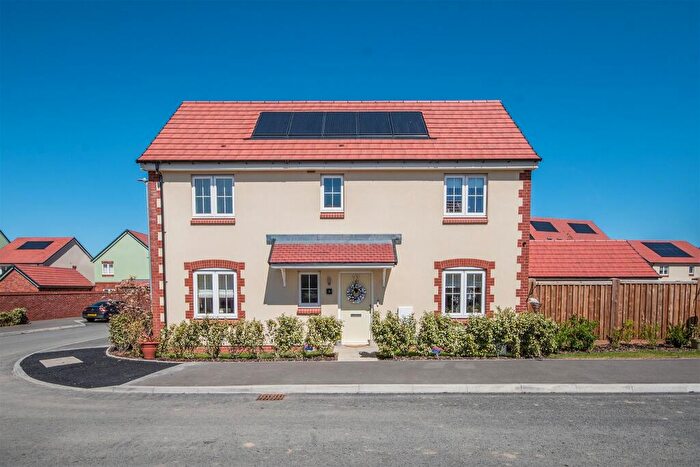
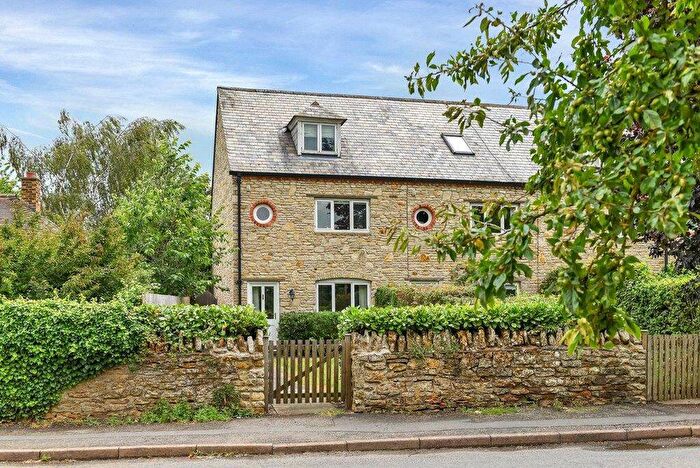
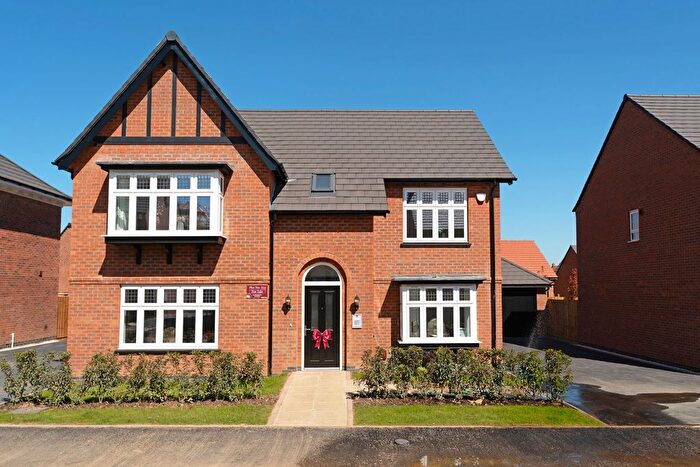
Properties for sale in Market Harborough
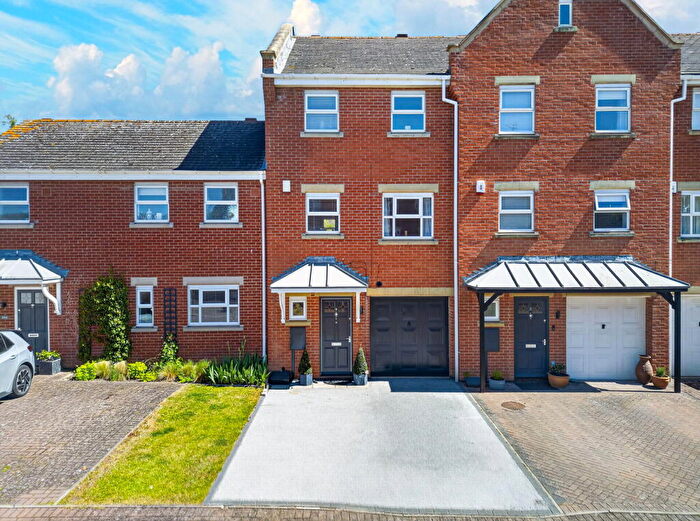
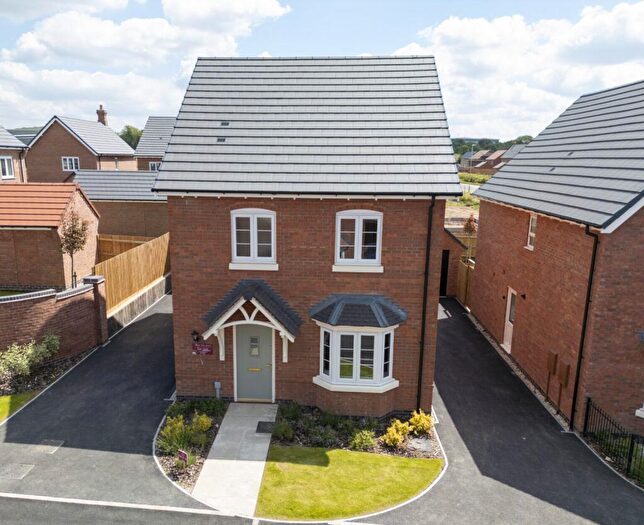
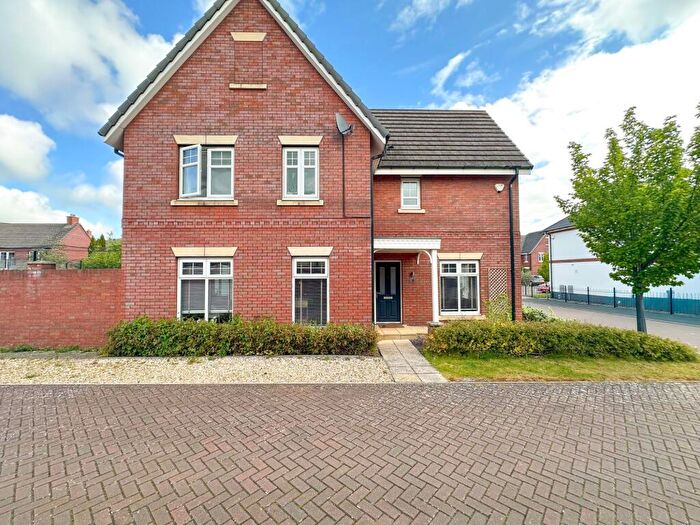
![]()
If you are looking to sell your house, let it out, or receive a property valuation, an expert can help you.
Click the button below to get started.
Neighbourhoods in Market Harborough
Navigate through our locations to find the location of your next house in Market Harborough, Leicestershire for sale or to rent.
Transport in Market Harborough
Please see below transportation links in this area:

- FAQ
- Price Paid By Year
- Property Type Price
Frequently asked questions about Market Harborough
What is the average price for a property for sale in Market Harborough?
The average price for a property for sale in Market Harborough is £377,386. This amount is 24% higher than the average price in Leicestershire. There are 7,281 property listings for sale in Market Harborough.
What locations have the most expensive properties for sale in Market Harborough?
The locations with the most expensive properties for sale in Market Harborough are Kibworths at an average of £1,010,000, Billesdon at an average of £866,750 and Kibworth at an average of £722,795.
What locations have the most affordable properties for sale in Market Harborough?
The locations with the most affordable properties for sale in Market Harborough are Market Harborough-welland at an average of £327,349, Market Harborough-Great Bowden & Arden at an average of £337,250 and Market Harborough-little Bowden at an average of £346,500.
Which train stations are available in or near Market Harborough?
Some of the train stations available in or near Market Harborough are Market Harborough, Corby and Kettering.
Property Price Paid in Market Harborough by Year
The average sold property price by year was:
| Year | Average Sold Price | Price Change |
Sold Properties
|
|---|---|---|---|
| 2026 | £314,675 | -19% |
27 Properties |
| 2025 | £374,517 | - |
483 Properties |
| 2024 | £374,466 | -3% |
588 Properties |
| 2023 | £386,300 | 10% |
538 Properties |
| 2022 | £347,407 | 1% |
695 Properties |
| 2021 | £344,875 | 3% |
845 Properties |
| 2020 | £334,982 | 4% |
653 Properties |
| 2019 | £321,352 | 2% |
714 Properties |
| 2018 | £316,527 | 7% |
658 Properties |
| 2017 | £295,171 | 7% |
635 Properties |
| 2016 | £273,956 | 7% |
620 Properties |
| 2015 | £256,072 | 3% |
782 Properties |
| 2014 | £249,589 | 12% |
810 Properties |
| 2013 | £218,525 | -3% |
664 Properties |
| 2012 | £224,950 | -1% |
533 Properties |
| 2011 | £226,146 | -6% |
449 Properties |
| 2010 | £238,878 | 17% |
516 Properties |
| 2009 | £198,551 | -11% |
486 Properties |
| 2008 | £219,461 | -2% |
444 Properties |
| 2007 | £224,860 | 11% |
750 Properties |
| 2006 | £200,981 | -1% |
833 Properties |
| 2005 | £203,598 | 4% |
631 Properties |
| 2004 | £194,550 | 12% |
641 Properties |
| 2003 | £171,511 | 16% |
715 Properties |
| 2002 | £144,753 | 20% |
886 Properties |
| 2001 | £115,368 | 4% |
933 Properties |
| 2000 | £111,237 | 15% |
939 Properties |
| 1999 | £94,489 | 13% |
956 Properties |
| 1998 | £82,491 | 9% |
629 Properties |
| 1997 | £75,291 | 6% |
681 Properties |
| 1996 | £70,669 | 4% |
637 Properties |
| 1995 | £67,889 | - |
481 Properties |
Property Price per Property Type in Market Harborough
Here you can find historic sold price data in order to help with your property search.
The average Property Paid Price for specific property types in the last three years are:
| Property Type | Average Sold Price | Sold Properties |
|---|---|---|
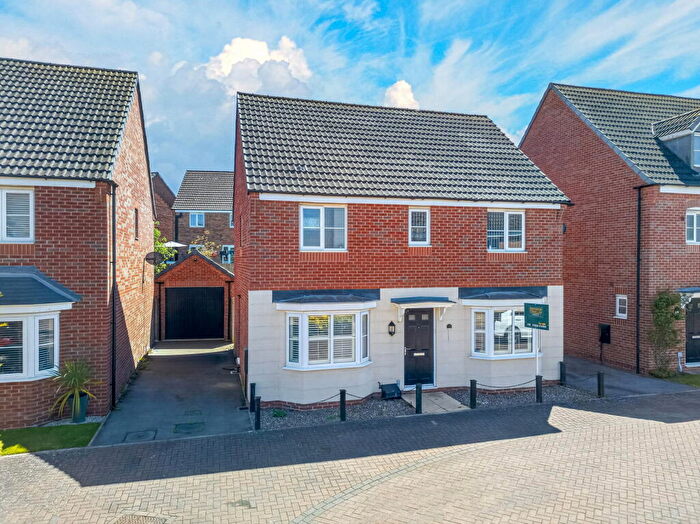
| Semi Detached House | £325,979.00 | 421 Semi Detached Houses |
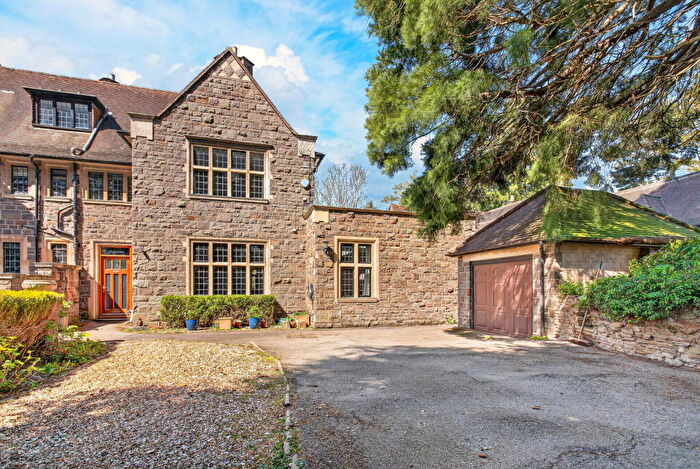
| Detached House | £521,937.00 | 673 Detached Houses |
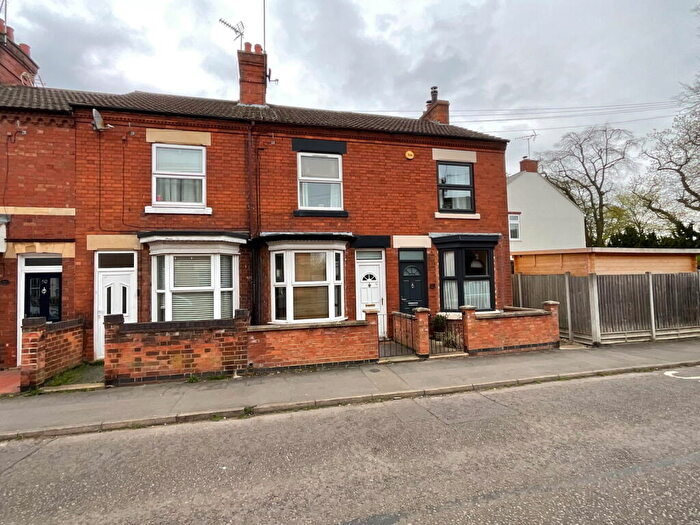
| Terraced House | £266,893.00 | 342 Terraced Houses |
| Flat | £188,126.00 | 200 Flats |