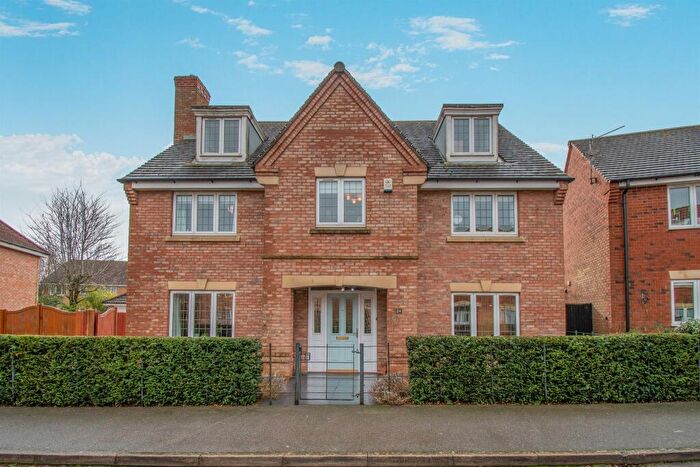
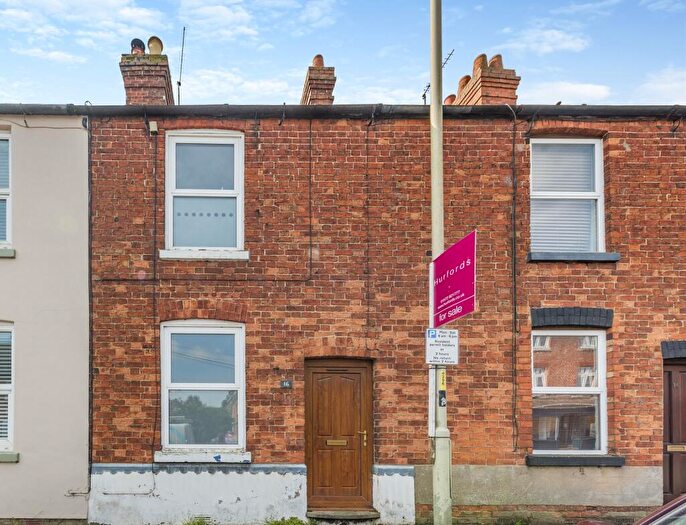
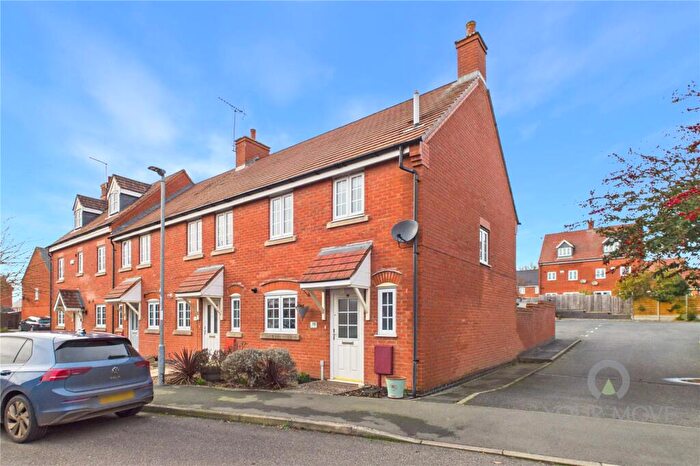
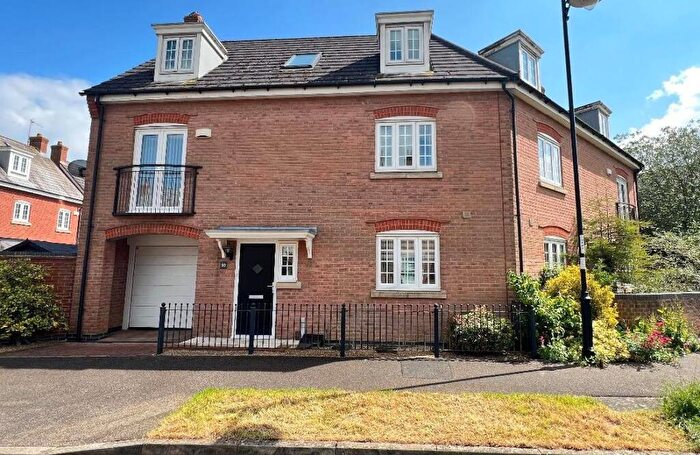
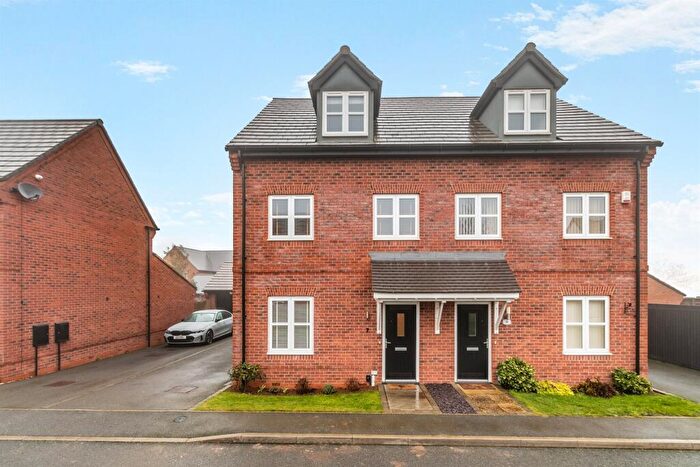
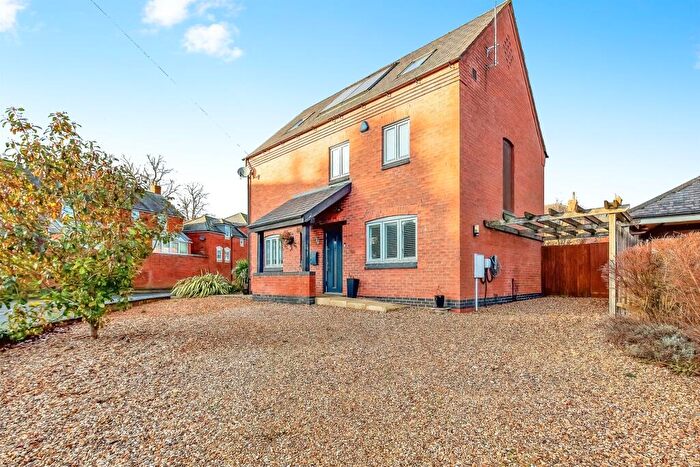
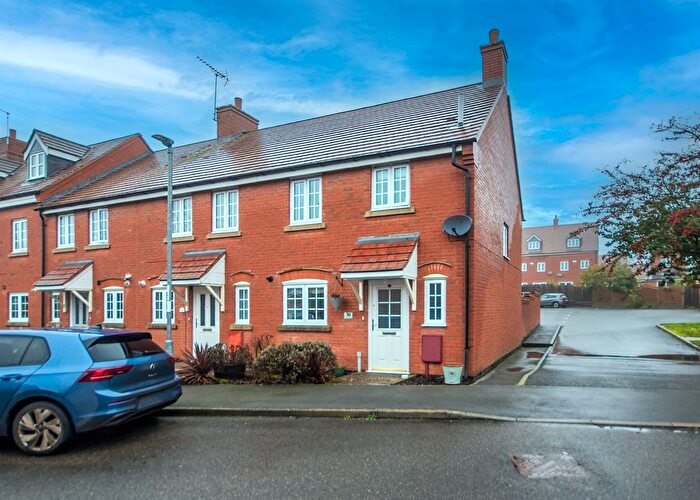
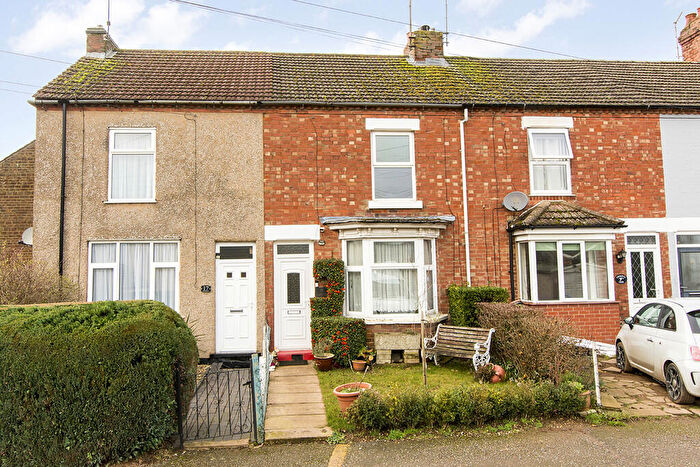
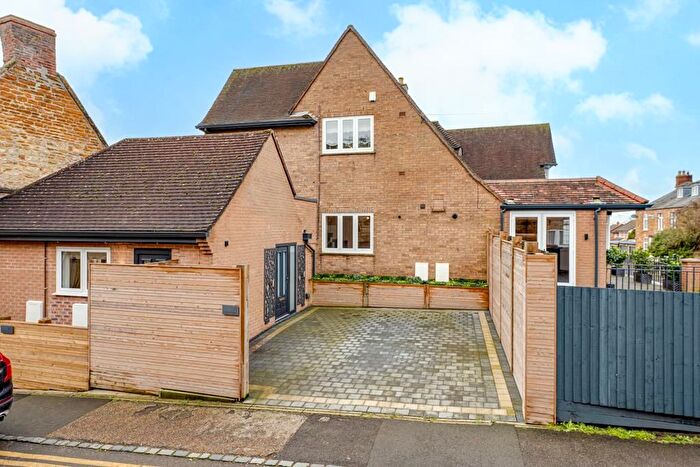
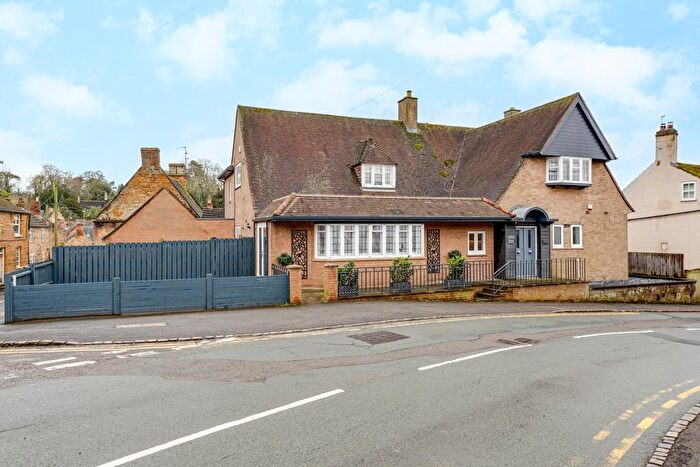
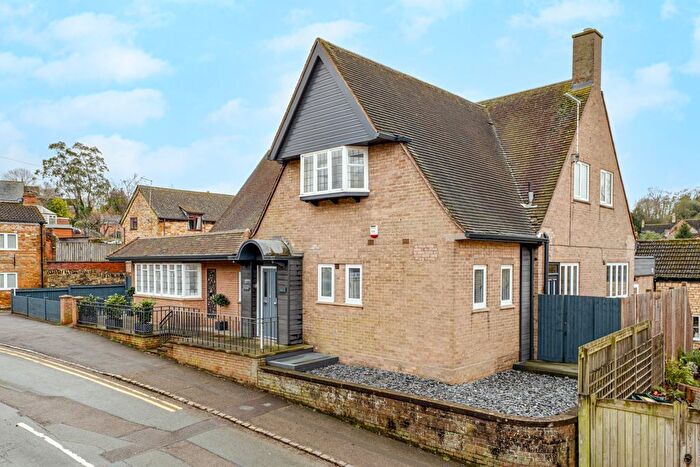
Houses for sale & to rent in Nevill, Market Harborough
House Prices in Nevill
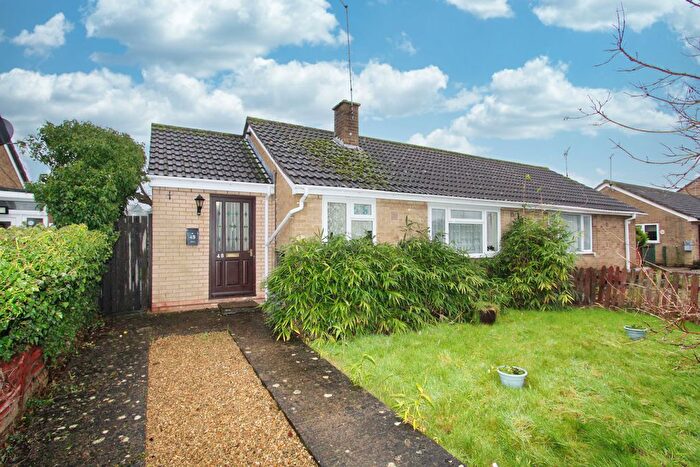
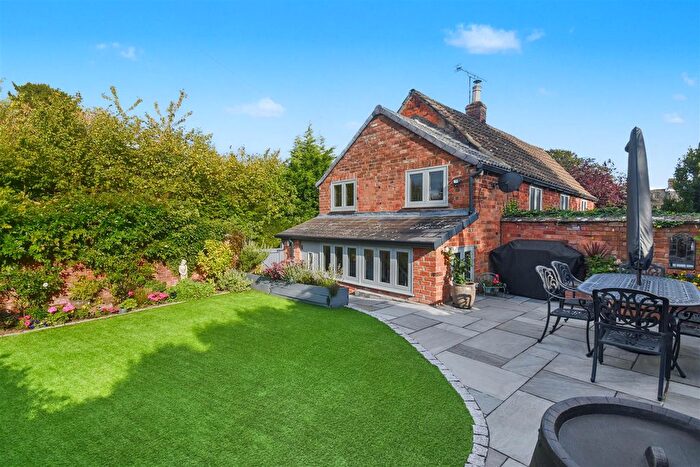
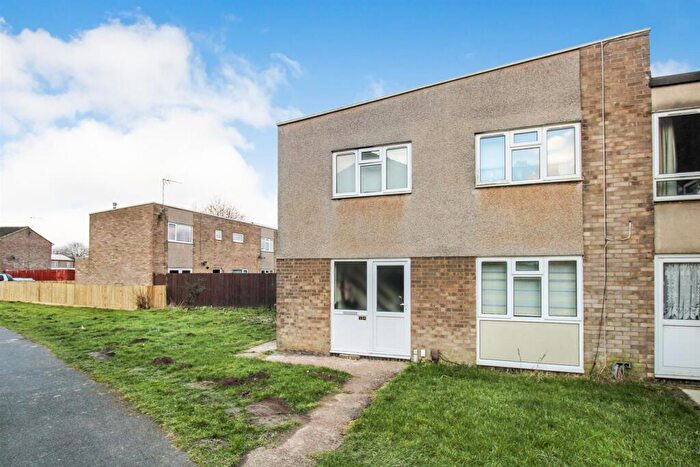
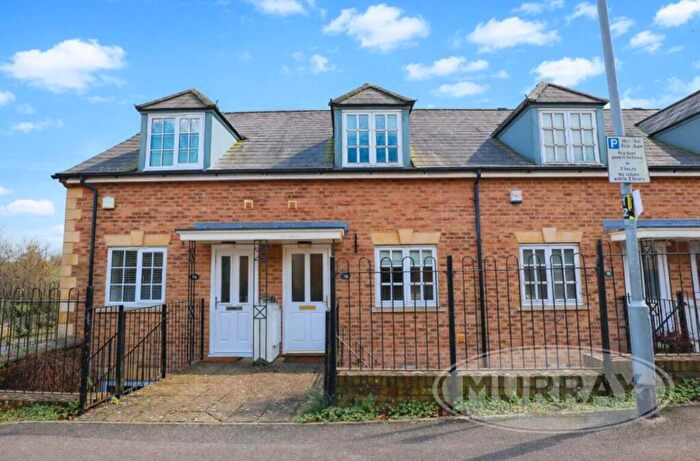
Properties in Nevill have an average house price of £612,380.00 and had 83 Property Transactions within the last 3 years¹.
Nevill is an area in Market Harborough, Leicestershire with 927 households², where the most expensive property was sold for £2,500,000.00.
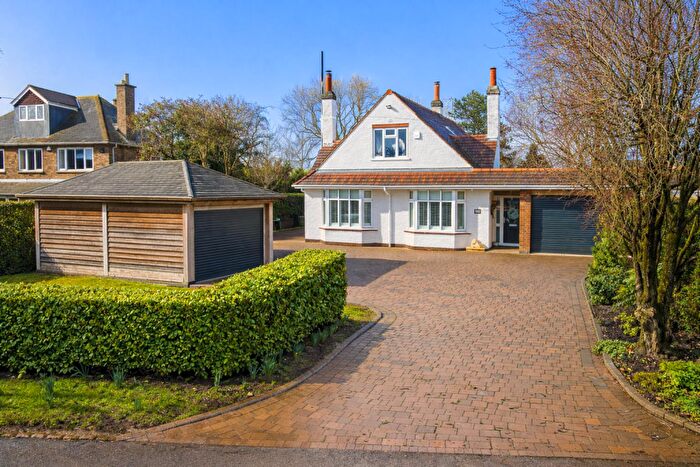
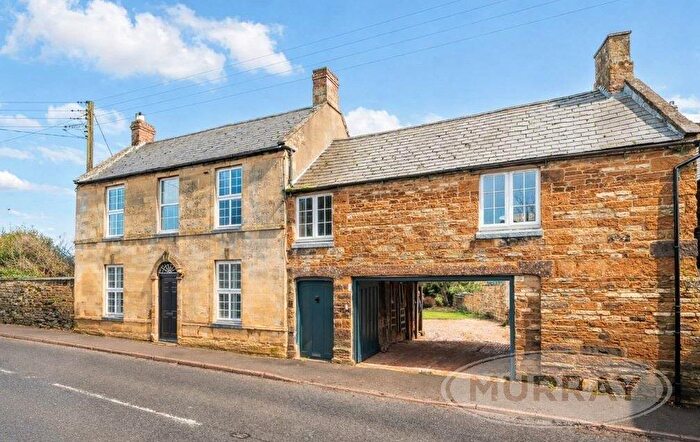
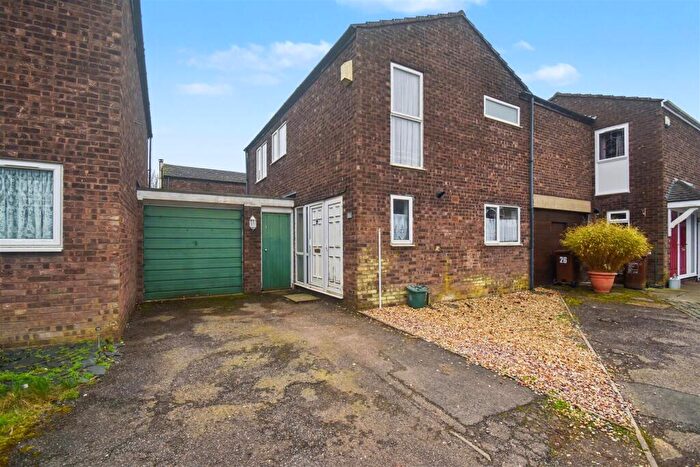
Properties for sale in Nevill
Roads and Postcodes in Nevill
Navigate through our locations to find the location of your next house in Nevill, Market Harborough for sale or to rent.
| Streets | Postcodes |
|---|---|
| Ashley Road | LE16 8DL |
| Banbury Lane | LE16 8SF |
| Barnsdale | LE16 8SG |
| Barnsdale Close | LE16 8SQ |
| Belchers Hill | LE16 8DJ |
| Blaston Road | LE16 8DB |
| Bluebell Lane | LE16 7SQ |
| Bowden Lane | LE16 7UX |
| Broadgate | LE16 8SH |
| Brook Lane | LE16 8SJ |
| Brook Terrace | LE16 8DN |
| Brookdale | LE16 8RB |
| Caldecott Road | LE16 8TB |
| Castle Lane | LE16 8TT |
| Caudle View Lane | LE16 7WA |
| Church Bank | LE16 8SN |
| Churchgate | LE16 8TY |
| Clarkesdale | LE16 8SP |
| Cotton Fields | LE7 9EB |
| Cranoe Road | LE16 7UH LE16 8TZ |
| Cross Bank | LE16 8SR |
| Deepdale | LE16 8SS |
| Doveside Court | LE16 8EQ |
| Drayton Road | LE16 8DP LE16 8DW LE16 8EF LE16 8EG LE16 8ET |
| East Norton Road | LE16 8UP |
| Eastgate | LE16 8UB |
| Eastnorton Road | LE16 8DQ |
| Ford Bank | LE16 8SL |
| Gatehouse Lane | LE16 8FU |
| Goadby Road | LE16 8UZ |
| Great Easton Road | LE16 8RP LE16 8RH |
| Hall Lane | LE16 8SA |
| Hallaton Road | LE16 8DR LE16 7UA LE16 8DD LE16 8FH |
| Hare Pie View | LE16 8UL |
| Hazel Grove | LE16 8UN |
| High Street | LE16 8ST |
| Hogg Lane | LE16 8UE |
| Holt Road | LE16 8DS |
| Holt View | LE16 8TN |
| Home Close | LE16 8RF |
| Horn Lane | LE16 8UG |
| Horninghold Road | LE16 8UF |
| Hunts Lane | LE16 8UQ |
| Langton Road | LE16 7FA |
| Little London | LE16 8SU |
| Lounts Crescent | LE16 8SX |
| Main Street | LE16 8DE LE16 8DT LE16 8RJ LE16 8RT LE16 8SD |
| Manor Farm Lane | LE16 8SW |
| Manor Road | LE16 8DU |
| Medbourne Road | LE16 8SE LE16 8UH |
| Mill Mount | LE16 8UR |
| Moor Hill | LE7 9XF |
| Moulds Lane | LE16 8SZ |
| Mulberry Court | LE16 8RG |
| Musk Close | LE16 8TJ |
| Nevill Holt Road | LE16 8SB |
| North End | LE16 8UJ LE16 8UT |
| Oak Yard | LE16 8UD |
| Old Green | LE16 8DX |
| Old Holt Road | LE16 8DY |
| Palmers Lane | LE7 9GP |
| Paynes Lane | LE16 8EZ |
| Pitchers Lane | LE16 8TA |
| Rectory Lane | LE16 8DZ |
| Sawpit Lane | LE16 8FS |
| School Lane | LE16 7SP |
| Slawston Road | LE16 8EA |
| Spring Terrace | LE16 8ES |
| Springbank | LE16 8EB |
| St Andrews Close | LE16 8SY |
| Stockerston Road | LE16 8DG LE16 8DF |
| Stockerstone Lane | LE16 8TD |
| Stokes Rise | LE16 8TS |
| The Cross | LE16 8UA |
| The Green | LE16 8RQ |
| Thorpe Langton Road | LE16 7TX |
| Tur Langton Road | LE16 7UQ |
| Uppingham Road | LE16 8ED |
| Waterfall Way | LE16 8EE |
| Welham Road | LE16 7SJ |
| LE16 8DH LE16 8FW LE7 9EH |
Transport near Nevill
- FAQ
- Price Paid By Year
- Property Type Price
Frequently asked questions about Nevill
What is the average price for a property for sale in Nevill?
The average price for a property for sale in Nevill is £612,380. This amount is 62% higher than the average price in Market Harborough. There are 2,669 property listings for sale in Nevill.
What streets have the most expensive properties for sale in Nevill?
The streets with the most expensive properties for sale in Nevill are Caldecott Road at an average of £900,000, Ford Bank at an average of £815,000 and Drayton Road at an average of £773,100.
What streets have the most affordable properties for sale in Nevill?
The streets with the most affordable properties for sale in Nevill are Lounts Crescent at an average of £258,000, Hunts Lane at an average of £270,000 and Churchgate at an average of £295,000.
Which train stations are available in or near Nevill?
Some of the train stations available in or near Nevill are Market Harborough, Corby and Oakham.
Property Price Paid in Nevill by Year
The average sold property price by year was:
| Year | Average Sold Price | Price Change |
Sold Properties
|
|---|---|---|---|
| 2025 | £616,676 | 11% |
17 Properties |
| 2024 | £548,194 | -25% |
36 Properties |
| 2023 | £686,970 | 17% |
30 Properties |
| 2022 | £569,209 | -16% |
31 Properties |
| 2021 | £657,827 | 34% |
37 Properties |
| 2020 | £431,350 | -8% |
37 Properties |
| 2019 | £466,629 | -1% |
31 Properties |
| 2018 | £471,798 | -0,1% |
43 Properties |
| 2017 | £472,401 | 9% |
36 Properties |
| 2016 | £431,398 | 5% |
25 Properties |
| 2015 | £410,791 | -2% |
34 Properties |
| 2014 | £420,564 | 22% |
37 Properties |
| 2013 | £325,941 | -26% |
31 Properties |
| 2012 | £409,133 | -20% |
30 Properties |
| 2011 | £489,660 | 32% |
24 Properties |
| 2010 | £332,107 | 1% |
37 Properties |
| 2009 | £329,068 | -8% |
26 Properties |
| 2008 | £355,062 | -3% |
24 Properties |
| 2007 | £366,468 | 8% |
35 Properties |
| 2006 | £336,781 | -1% |
36 Properties |
| 2005 | £341,524 | -2% |
33 Properties |
| 2004 | £348,799 | 37% |
50 Properties |
| 2003 | £218,505 | -11% |
41 Properties |
| 2002 | £242,176 | 13% |
51 Properties |
| 2001 | £210,006 | 14% |
36 Properties |
| 2000 | £180,294 | 7% |
37 Properties |
| 1999 | £167,125 | 17% |
30 Properties |
| 1998 | £138,917 | 12% |
41 Properties |
| 1997 | £122,449 | -1% |
41 Properties |
| 1996 | £123,215 | 3% |
48 Properties |
| 1995 | £119,471 | - |
32 Properties |
Property Price per Property Type in Nevill
Here you can find historic sold price data in order to help with your property search.
The average Property Paid Price for specific property types in the last three years are:
| Property Type | Average Sold Price | Sold Properties |
|---|---|---|
| Semi Detached House | £455,736.00 | 19 Semi Detached Houses |
| Detached House | £746,040.00 | 50 Detached Houses |
| Terraced House | £347,614.00 | 14 Terraced Houses |

