Houses for sale & to rent in Welland, Market Harborough
House Prices in Welland
Properties in Welland have an average house price of £501,518.00 and had 80 Property Transactions within the last 3 years¹.
Welland is an area in Market Harborough, Northamptonshire with 890 households², where the most expensive property was sold for £1,445,000.00.
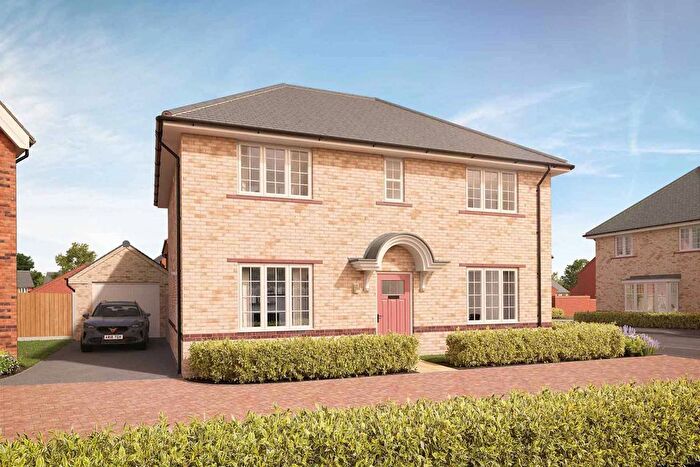
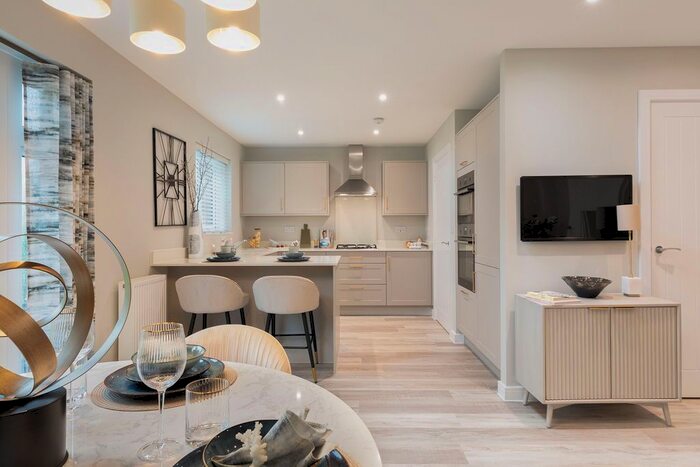
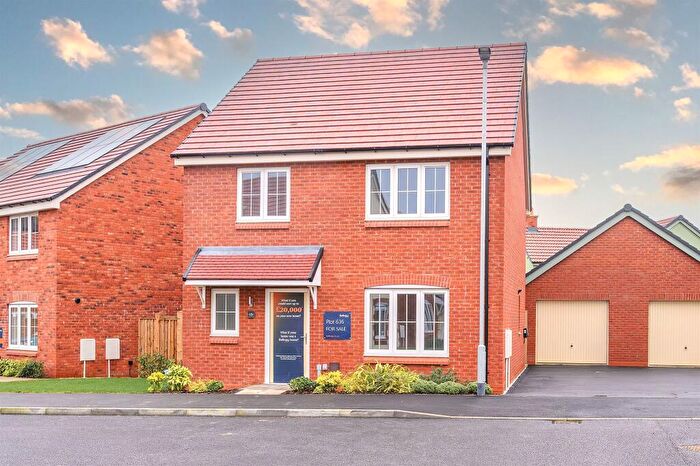
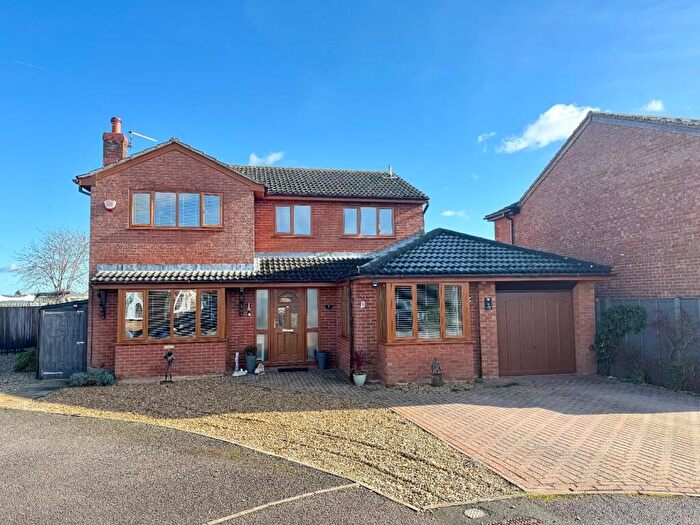
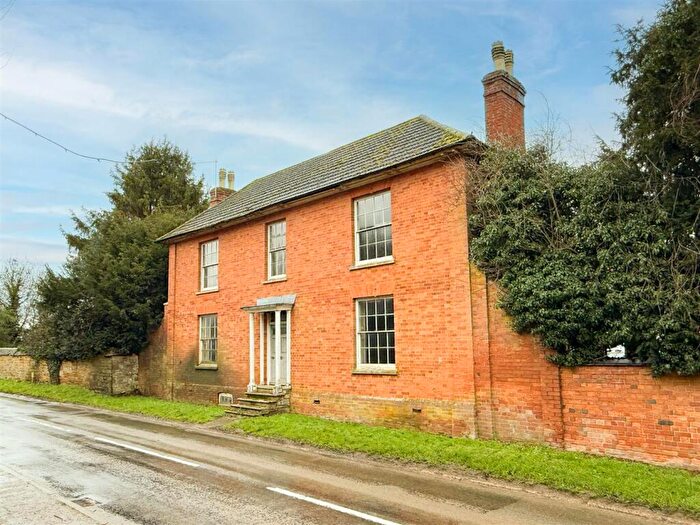
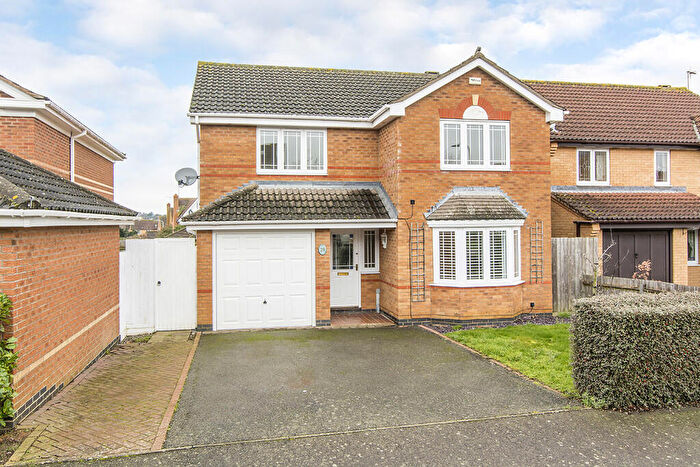
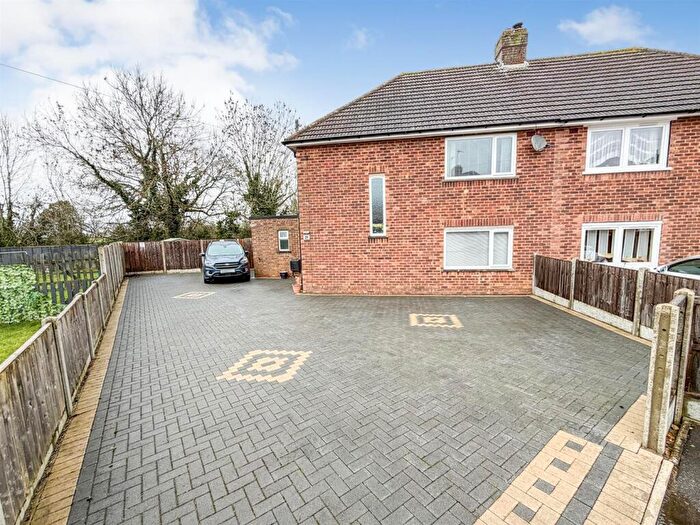
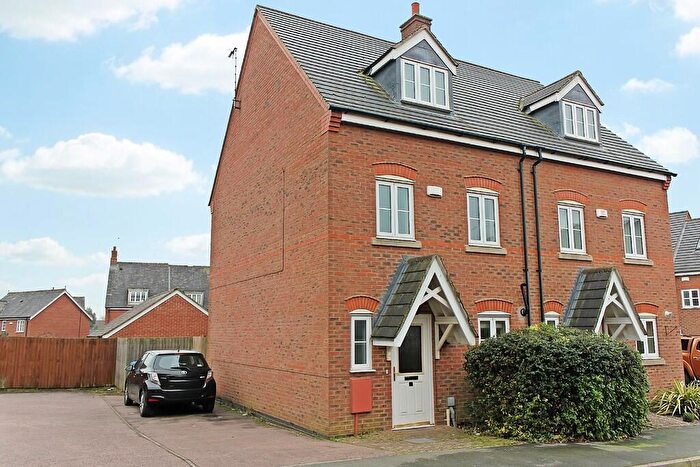
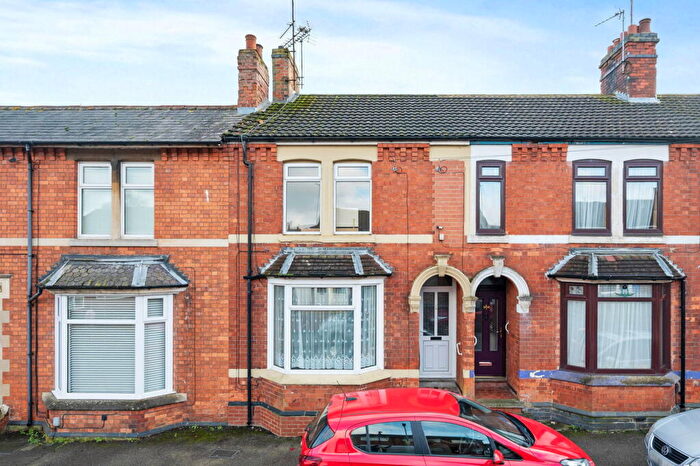
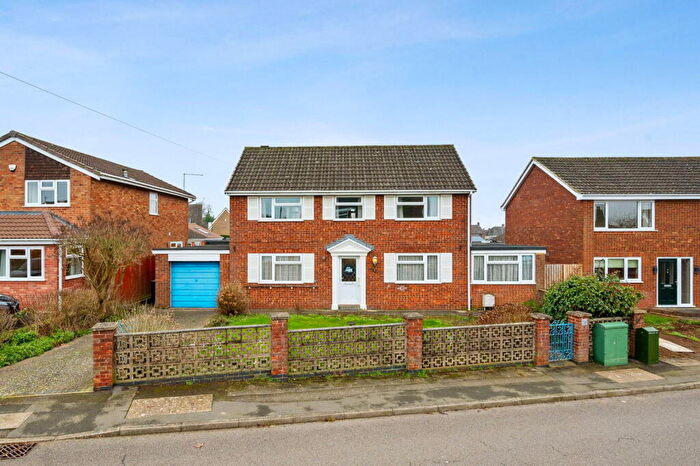
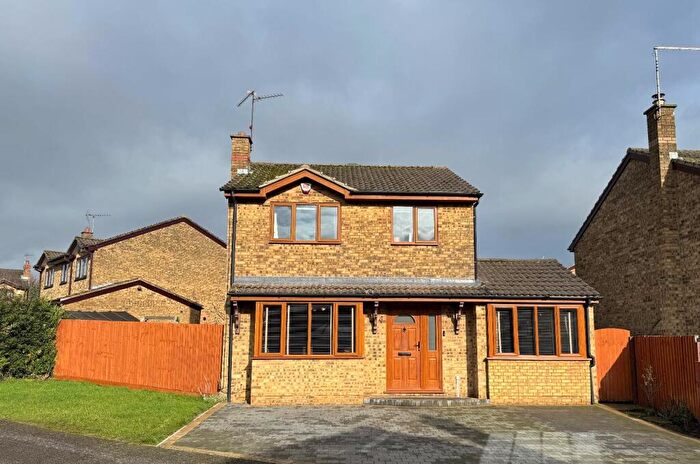
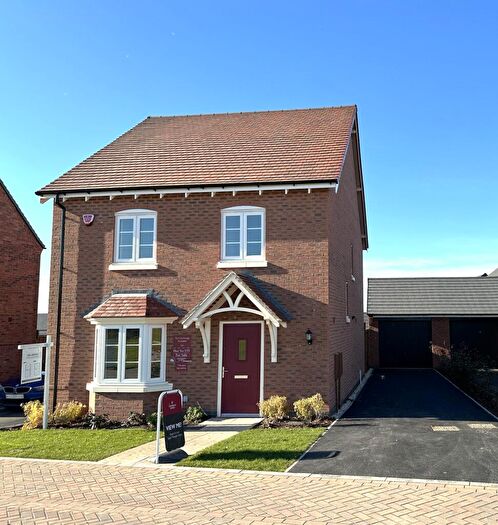
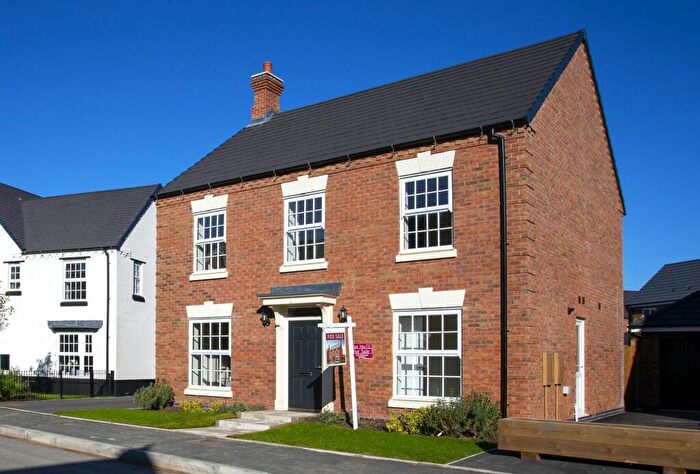
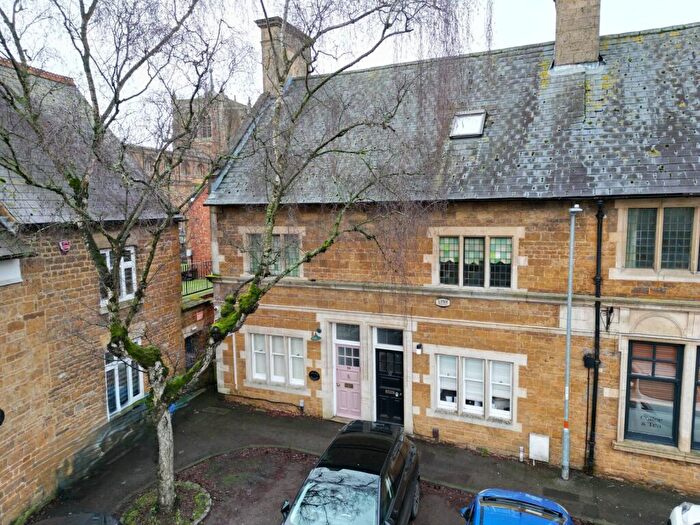
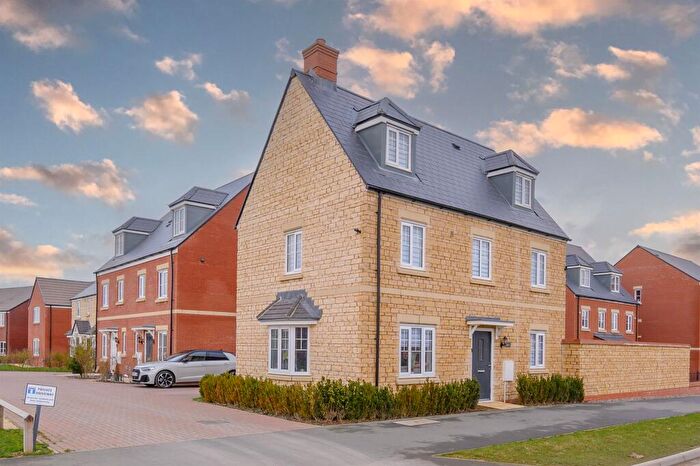
Properties for sale in Welland
Roads and Postcodes in Welland
Navigate through our locations to find the location of your next house in Welland, Market Harborough for sale or to rent.
| Streets | Postcodes |
|---|---|
| All Saints Terrace | LE16 8QP |
| Ashley Road | LE16 8HR LE16 8PL |
| Barlows Lane | LE16 8QB |
| Bottom Lane | LE16 8PN |
| Braybrooke Road | LE16 8PF |
| Carlton Road | LE16 8QD LE16 8QE |
| Castle Bank | LE16 8LE |
| Chapel Lane | LE16 8PW LE16 8QF |
| Chapmans Close | LE16 8NY |
| Church Close | LE16 8LD |
| Church Lane | LE16 8PG |
| Church Street | LE16 8QG |
| Dalbini Close | LE16 8PP |
| Dallacre Drive | LE16 8QS LE16 8FE |
| De Roos Way | LE16 8PR |
| Debdale | LE16 8NX |
| Denman Close | LE16 8RE |
| Desborough Road | LE16 8HB LE16 8LG LE16 8PS LE16 8PT LE16 8GP LE16 8HA LE16 8LF |
| Dingley Dell | LE16 8HH |
| Dove Cote Close | LE16 8HN |
| Green Lane | LE16 8HD LE16 8LQ LE16 8PX |
| Griffin Road | LE16 8LH |
| Hall Close | LE16 8HT |
| Hall Lane | LE16 8HE |
| Harborough Road | LE16 8LJ LE16 8PH LE16 8PJ LE16 8PQ LE16 8PY LE16 8LL LE16 8PB LE16 8PD |
| Hermitage Road | LE16 8PE |
| Holme Close | LE16 8RA |
| Home Close | LE16 8QU |
| Kendalls Close | LE16 8RD |
| Latymer Close | LE16 8LN |
| Lower Road | LE16 8PZ |
| Main Street | LE16 8HF LE16 8HG LE16 8HP LE16 8QQ |
| Mapletoft Close | LE16 8NQ |
| Medbourne Road | LE16 8DA |
| Mickleborough Close | LE16 8HX |
| Middle Lane | LE16 8QA |
| Newland Street | LE16 8LW |
| Newton Way | LE16 8LR |
| Northlea | LE16 8HY |
| Orchard Close | LE16 8QY |
| Park Lane | LE16 8LP |
| Pipewell Road | LE16 8TX |
| Queens Close | LE16 8QH |
| Queens Road | LE16 8QJ |
| Rushton Road | LE16 8QL |
| School Lane | LE16 8LS LE16 8QN |
| Scots Lane | LE16 8QW |
| Springfield Road | LE16 8QR |
| Stoke Albany Road | LE16 8FG |
| Sutton Lane | LE16 8HJ LE16 8HL |
| The Green | LE16 8HS |
| The Lane | LE16 8HU |
| The Maltings | LE16 8HW |
| Valley Road | LE16 8HZ |
| Weinahr Close | LE16 8QX |
| Westhorpe | LE16 8HQ |
| Windsor Close | LE16 8QT |
| LE16 8JW |
Transport near Welland
- FAQ
- Price Paid By Year
- Property Type Price
Frequently asked questions about Welland
What is the average price for a property for sale in Welland?
The average price for a property for sale in Welland is £501,518. This amount is 9% higher than the average price in Market Harborough. There are 3,213 property listings for sale in Welland.
What streets have the most expensive properties for sale in Welland?
The streets with the most expensive properties for sale in Welland are School Lane at an average of £776,666, Newland Street at an average of £730,000 and Griffin Road at an average of £721,666.
What streets have the most affordable properties for sale in Welland?
The streets with the most affordable properties for sale in Welland are De Roos Way at an average of £270,000, Queens Road at an average of £315,000 and Springfield Road at an average of £338,333.
Which train stations are available in or near Welland?
Some of the train stations available in or near Welland are Market Harborough, Corby and Kettering.
Property Price Paid in Welland by Year
The average sold property price by year was:
| Year | Average Sold Price | Price Change |
Sold Properties
|
|---|---|---|---|
| 2025 | £441,875 | -21% |
24 Properties |
| 2024 | £534,140 | 3% |
32 Properties |
| 2023 | £517,666 | -13% |
24 Properties |
| 2022 | £582,897 | 26% |
36 Properties |
| 2021 | £432,862 | -6% |
53 Properties |
| 2020 | £460,967 | 10% |
32 Properties |
| 2019 | £416,358 | -5% |
41 Properties |
| 2018 | £436,758 | 5% |
27 Properties |
| 2017 | £414,924 | 16% |
53 Properties |
| 2016 | £348,391 | -6% |
28 Properties |
| 2015 | £370,755 | 2% |
42 Properties |
| 2014 | £364,608 | -5% |
41 Properties |
| 2013 | £381,730 | 25% |
33 Properties |
| 2012 | £287,618 | -6% |
33 Properties |
| 2011 | £306,309 | -10% |
16 Properties |
| 2010 | £338,347 | 16% |
20 Properties |
| 2009 | £284,576 | -5% |
25 Properties |
| 2008 | £298,530 | -28% |
15 Properties |
| 2007 | £381,382 | 9% |
45 Properties |
| 2006 | £347,804 | 20% |
41 Properties |
| 2005 | £277,919 | -10% |
38 Properties |
| 2004 | £306,807 | 19% |
39 Properties |
| 2003 | £248,480 | 19% |
44 Properties |
| 2002 | £200,813 | 10% |
38 Properties |
| 2001 | £181,034 | 26% |
33 Properties |
| 2000 | £133,536 | -12% |
36 Properties |
| 1999 | £149,594 | 6% |
40 Properties |
| 1998 | £141,043 | 11% |
29 Properties |
| 1997 | £125,294 | -4% |
49 Properties |
| 1996 | £130,602 | 28% |
36 Properties |
| 1995 | £94,250 | - |
22 Properties |
Property Price per Property Type in Welland
Here you can find historic sold price data in order to help with your property search.
The average Property Paid Price for specific property types in the last three years are:
| Property Type | Average Sold Price | Sold Properties |
|---|---|---|
| Semi Detached House | £366,041.00 | 24 Semi Detached Houses |
| Detached House | £577,970.00 | 51 Detached Houses |
| Terraced House | £372,000.00 | 5 Terraced Houses |

