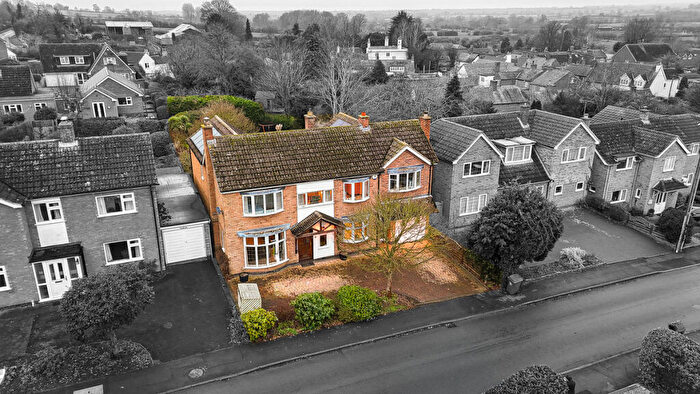
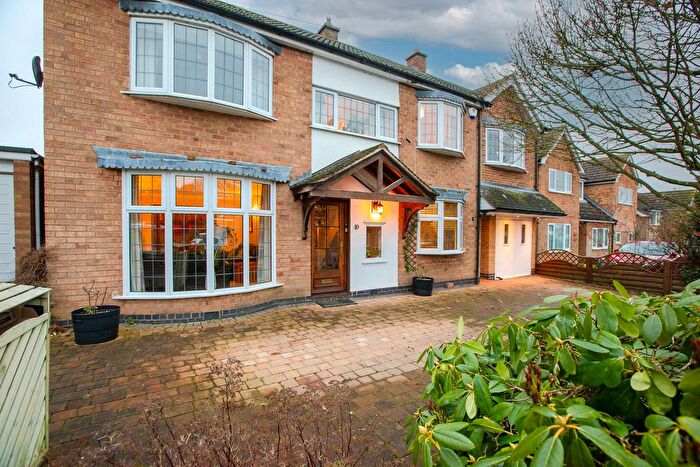
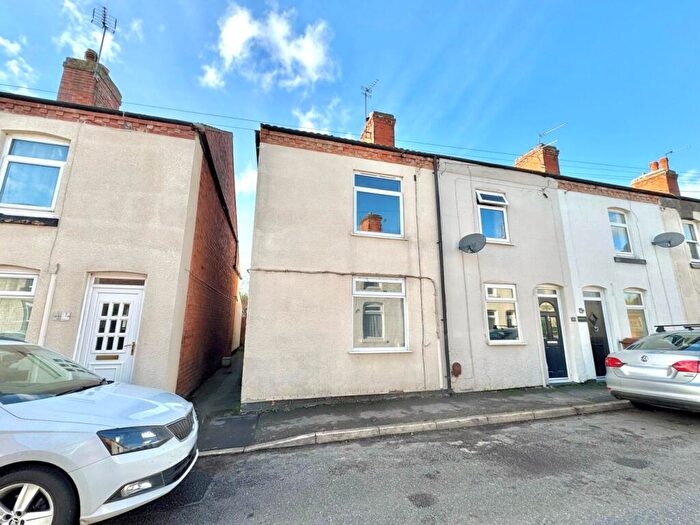
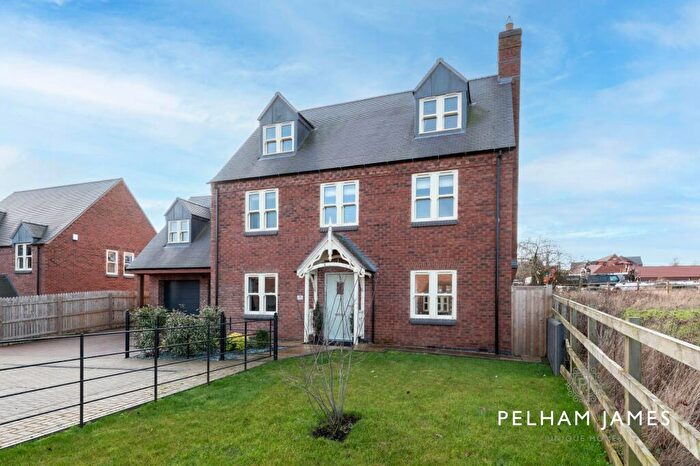
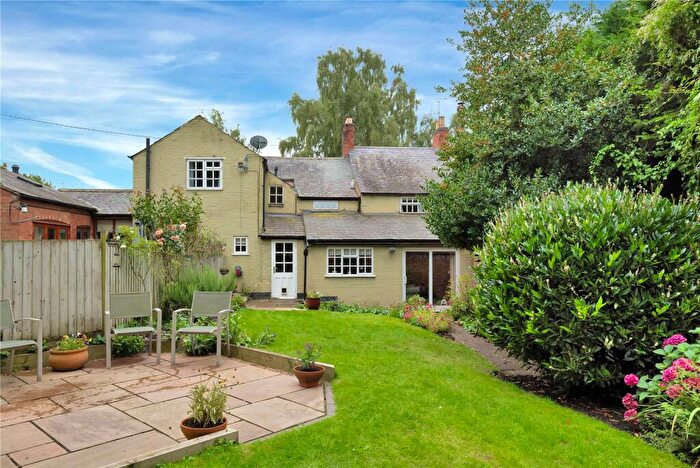
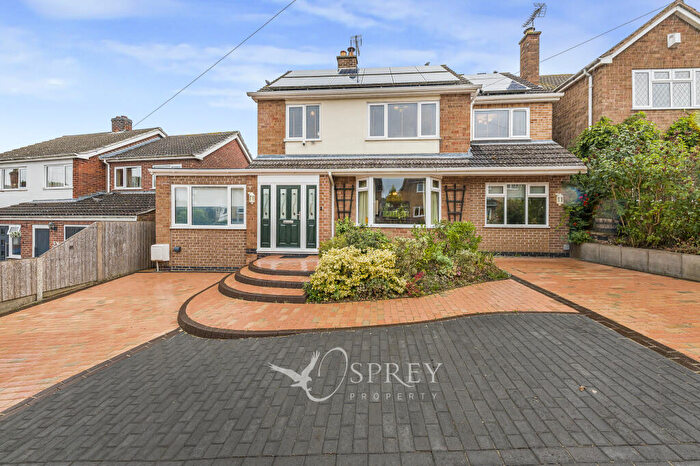
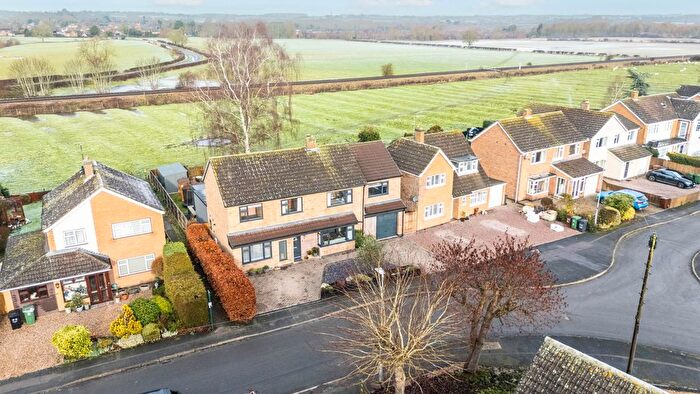
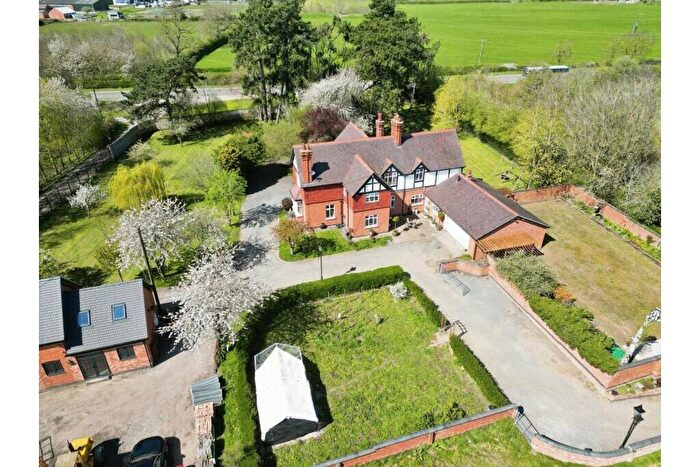
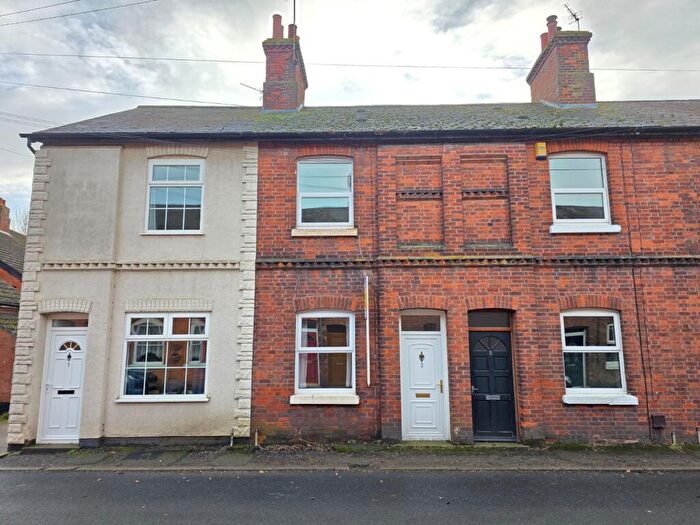
Houses for sale & to rent in Frisby-on-the-wreake, Melton Mowbray
House Prices in Frisby-on-the-wreake
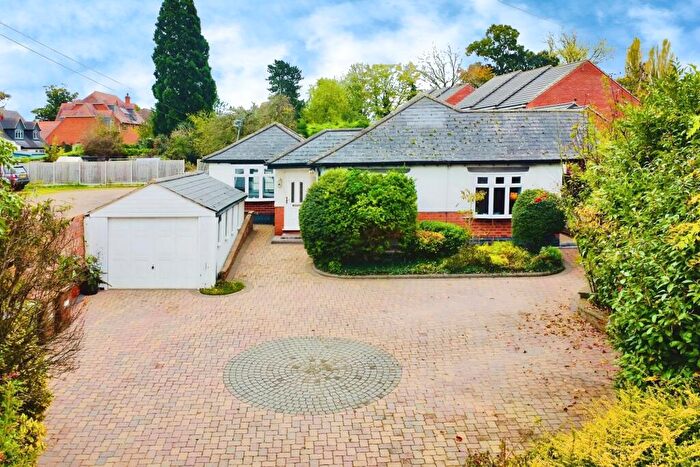
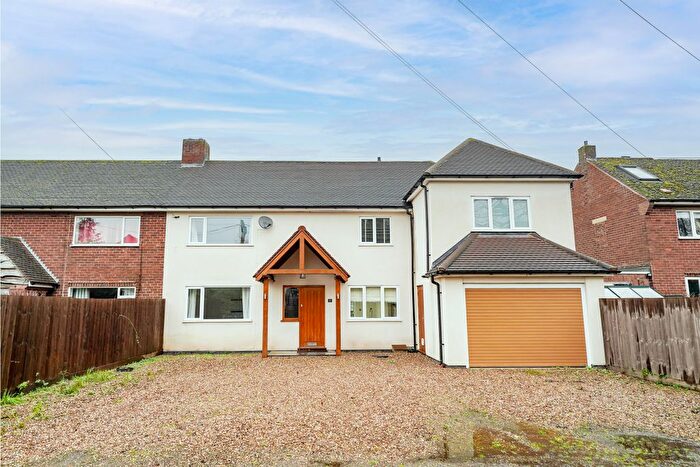
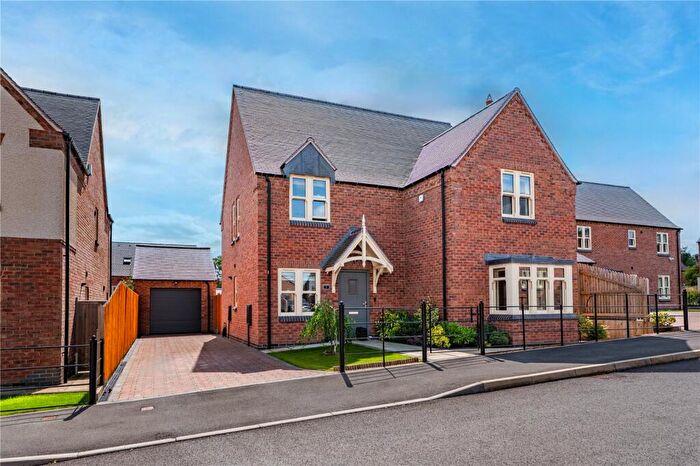
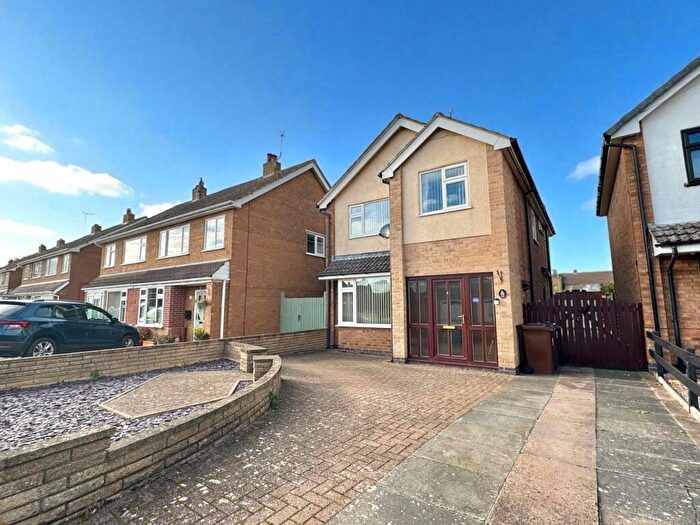
Properties in Frisby-on-the-wreake have an average house price of £426,938.00 and had 48 Property Transactions within the last 3 years¹.
Frisby-on-the-wreake is an area in Melton Mowbray, Leicestershire with 734 households², where the most expensive property was sold for £1,500,000.00.
Properties for sale in Frisby-on-the-wreake
Roads and Postcodes in Frisby-on-the-wreake
Navigate through our locations to find the location of your next house in Frisby-on-the-wreake, Melton Mowbray for sale or to rent.
| Streets | Postcodes |
|---|---|
| Angel Way | LE14 2DL |
| Ash Way | LE14 2NG |
| Back Lane | LE14 3DY |
| Brooksby Road | LE14 3EA |
| Carrfields Lane | LE14 2NT |
| Chapel Lane | LE14 3DW |
| Church Lane | LE14 2NQ LE14 3BY LE14 3DR LE14 3PA |
| Frisby Road | LE14 3DS |
| Gaddesby Lane | LE14 2PA LE14 2TQ LE14 2LL |
| Great Dalby Road | LE14 2TN |
| Great Lane | LE14 2PB |
| Greenhouse Road | LE14 2DB |
| Hall Orchard Lane | LE14 2NH |
| Hillside Close | LE14 3PT |
| Hoby Road | LE14 3PE LE14 2LE |
| Hollow Lane | LE14 2PJ |
| Holmfield | LE14 3ED |
| Hunters Rise | LE14 2DT |
| Leicester Road | LE14 2PD LE14 2PE |
| Loughborough Road | LE14 3PF |
| Main Road | LE14 2DU LE14 2LN LE14 2DX LE14 2LW |
| Main Street | LE14 2EA LE14 2LP LE14 2NJ LE14 3BZ LE14 3DT LE14 3PG LE14 3PQ LE14 3PJ |
| Melton Road | LE7 4YT |
| Mill Lane | LE14 2NN LE14 3DN |
| Oak Way | LE14 2NF |
| Ostler Lane | LE14 3PL |
| Perkins Lane | LE14 3DB |
| Priory View | LE14 2TR |
| Regent Road | LE14 3DU |
| Robert Street | LE14 2BX |
| Rotherby Lane | LE14 2NW |
| Rotherby Top | LE14 2LY |
| Saxelby Park Road | LE14 3PN |
| Saxelby Road | LE14 3NA LE14 3PS |
| Shoby Lane | LE14 3DD |
| Six Hills Road | LE14 3PP |
| St Thomas Way | LE14 2PF |
| Station Lane | LE14 2ED |
| Station Road | LE14 3DE |
| Steeple Drive | LE14 2DA |
| The Lane | LE14 2LU |
| The Row | LE14 2LQ |
| Thorpe Satchville Road | LE14 2TH |
| Thrussington Road | LE14 3EB |
| Valley View | LE14 2PH |
| Washdyke Lane | LE14 2EE |
| Water Lane | LE14 2NP |
| Wellfield Lane | LE14 2NR |
| LE14 2LH LE14 2LJ LE14 3PB |
Transport near Frisby-on-the-wreake
- FAQ
- Price Paid By Year
- Property Type Price
Frequently asked questions about Frisby-on-the-wreake
What is the average price for a property for sale in Frisby-on-the-wreake?
The average price for a property for sale in Frisby-on-the-wreake is £426,938. This amount is 46% higher than the average price in Melton Mowbray. There are 872 property listings for sale in Frisby-on-the-wreake.
What streets have the most expensive properties for sale in Frisby-on-the-wreake?
The streets with the most expensive properties for sale in Frisby-on-the-wreake are Thrussington Road at an average of £1,500,000, Six Hills Road at an average of £643,750 and Rotherby Lane at an average of £540,000.
What streets have the most affordable properties for sale in Frisby-on-the-wreake?
The streets with the most affordable properties for sale in Frisby-on-the-wreake are Wellfield Lane at an average of £190,000, Valley View at an average of £232,583 and Gaddesby Lane at an average of £260,000.
Which train stations are available in or near Frisby-on-the-wreake?
Some of the train stations available in or near Frisby-on-the-wreake are Melton Mowbray, Sileby and Syston.
Property Price Paid in Frisby-on-the-wreake by Year
The average sold property price by year was:
| Year | Average Sold Price | Price Change |
Sold Properties
|
|---|---|---|---|
| 2025 | £507,000 | 20% |
11 Properties |
| 2024 | £407,902 | 2% |
19 Properties |
| 2023 | £398,105 | -54% |
18 Properties |
| 2022 | £612,727 | 24% |
11 Properties |
| 2021 | £468,468 | 15% |
36 Properties |
| 2020 | £397,101 | 11% |
47 Properties |
| 2019 | £352,908 | -20% |
37 Properties |
| 2018 | £422,120 | 6% |
26 Properties |
| 2017 | £396,598 | 10% |
26 Properties |
| 2016 | £357,879 | 14% |
29 Properties |
| 2015 | £306,082 | -21% |
28 Properties |
| 2014 | £369,538 | 4% |
25 Properties |
| 2013 | £354,495 | 18% |
20 Properties |
| 2012 | £292,365 | 15% |
19 Properties |
| 2011 | £247,882 | -4% |
26 Properties |
| 2010 | £256,625 | -27% |
12 Properties |
| 2009 | £324,663 | 10% |
21 Properties |
| 2008 | £290,636 | -24% |
18 Properties |
| 2007 | £360,998 | 7% |
28 Properties |
| 2006 | £334,282 | 11% |
23 Properties |
| 2005 | £297,172 | 7% |
27 Properties |
| 2004 | £276,553 | 6% |
26 Properties |
| 2003 | £260,494 | 9% |
26 Properties |
| 2002 | £237,553 | 16% |
29 Properties |
| 2001 | £199,504 | 18% |
33 Properties |
| 2000 | £164,503 | 8% |
33 Properties |
| 1999 | £151,573 | 12% |
44 Properties |
| 1998 | £133,747 | 19% |
31 Properties |
| 1997 | £107,758 | -13% |
42 Properties |
| 1996 | £121,934 | 29% |
24 Properties |
| 1995 | £86,250 | - |
14 Properties |
Property Price per Property Type in Frisby-on-the-wreake
Here you can find historic sold price data in order to help with your property search.
The average Property Paid Price for specific property types in the last three years are:
| Property Type | Average Sold Price | Sold Properties |
|---|---|---|
| Semi Detached House | £265,642.00 | 14 Semi Detached Houses |
| Detached House | £517,967.00 | 29 Detached Houses |
| Terraced House | £288,250.00 | 4 Terraced Houses |
| Flat | £600,000.00 | 1 Flat |

