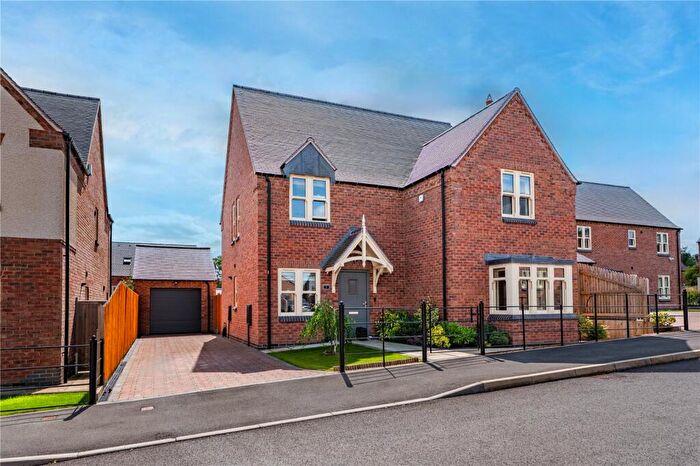
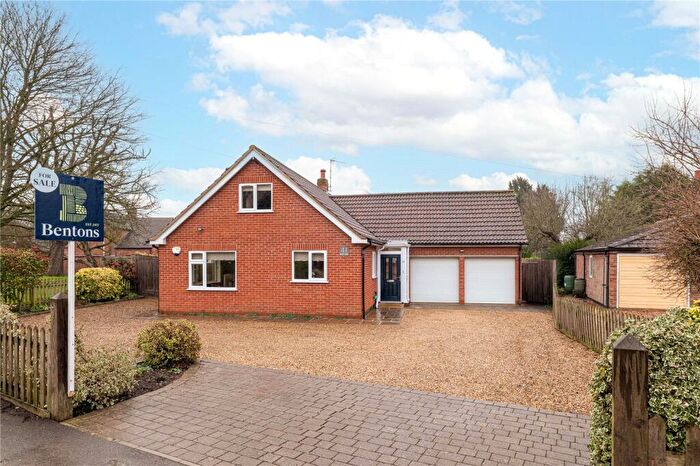
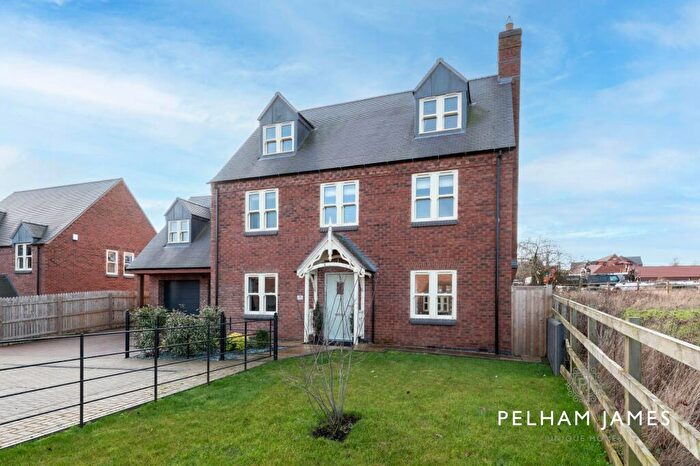
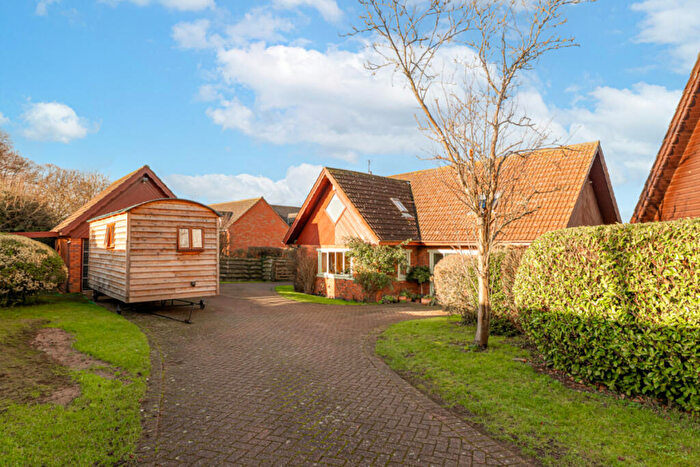
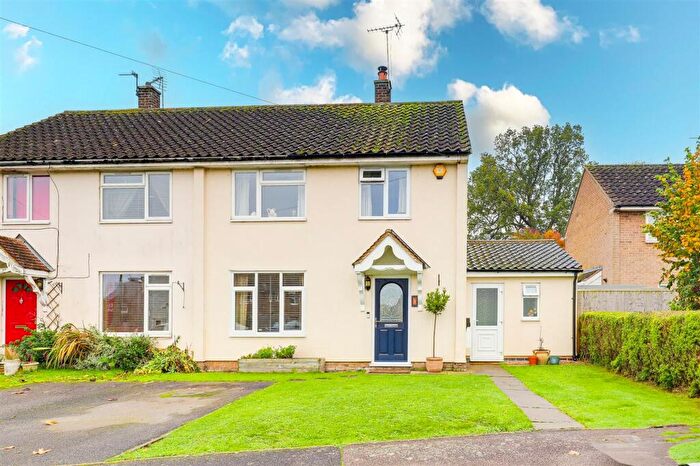
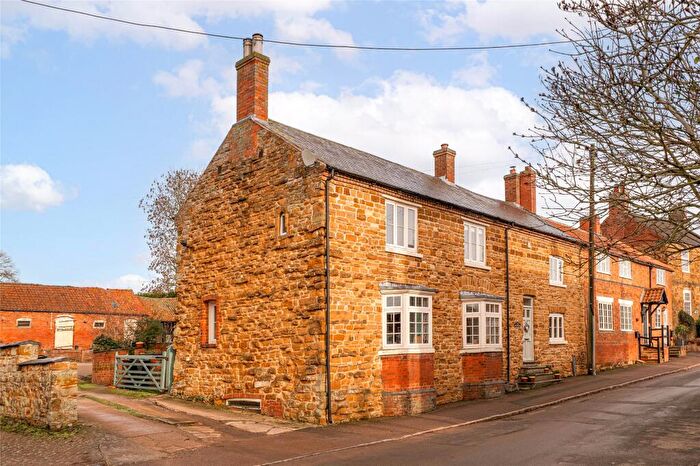
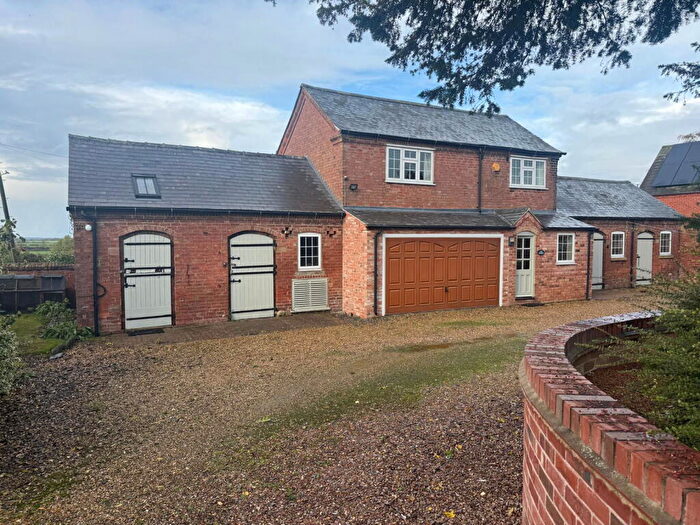
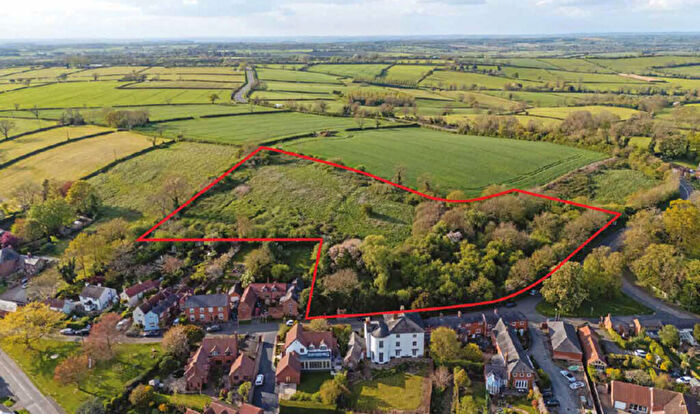
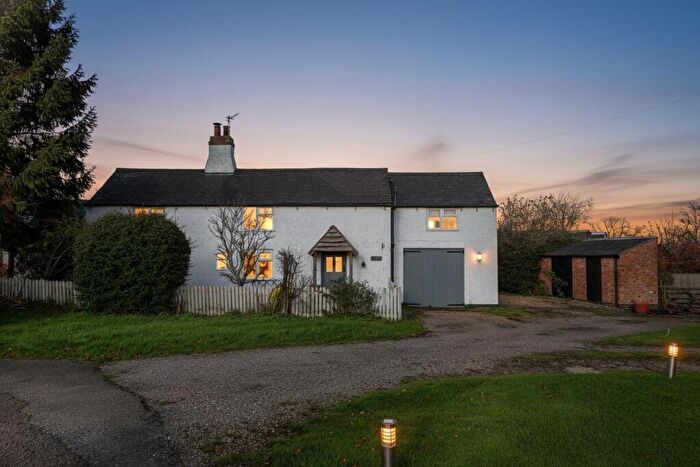
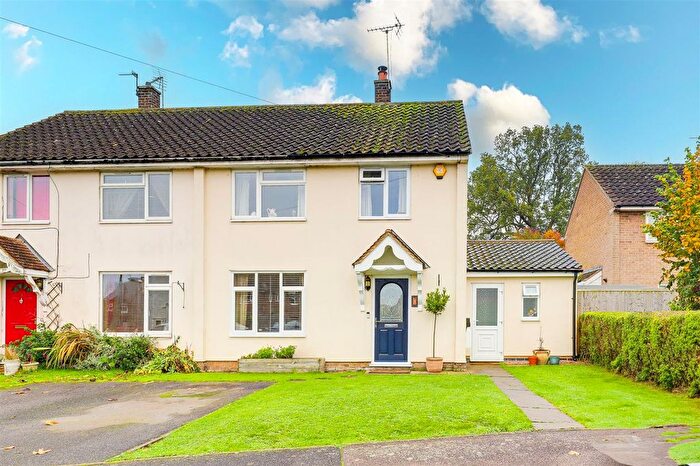
Houses for sale & to rent in Old Dalby, Melton Mowbray
House Prices in Old Dalby
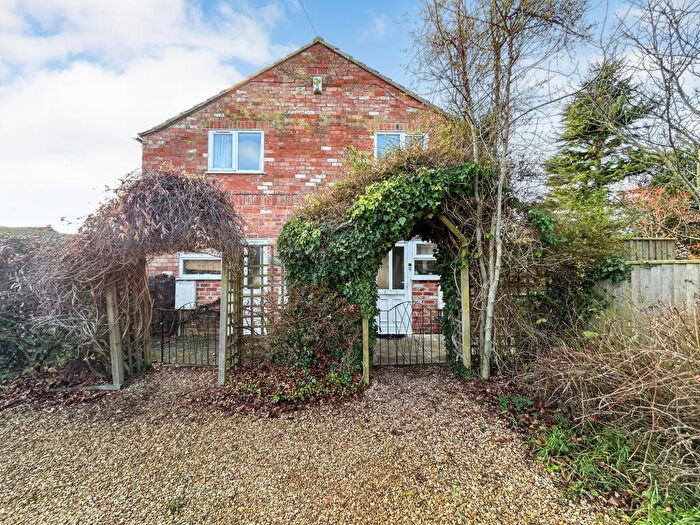
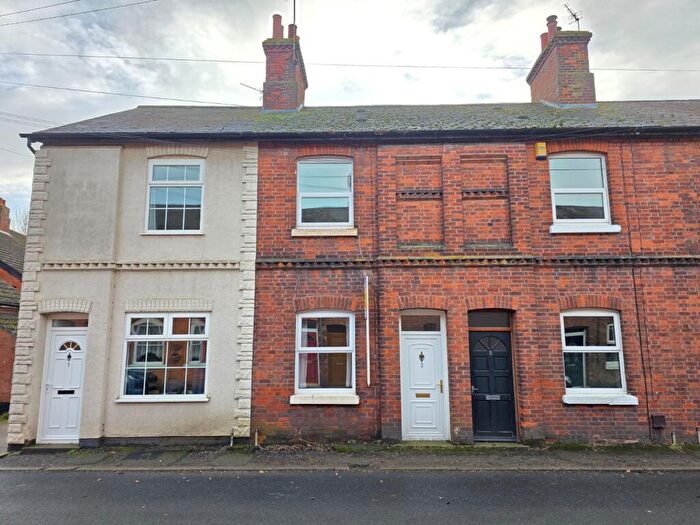
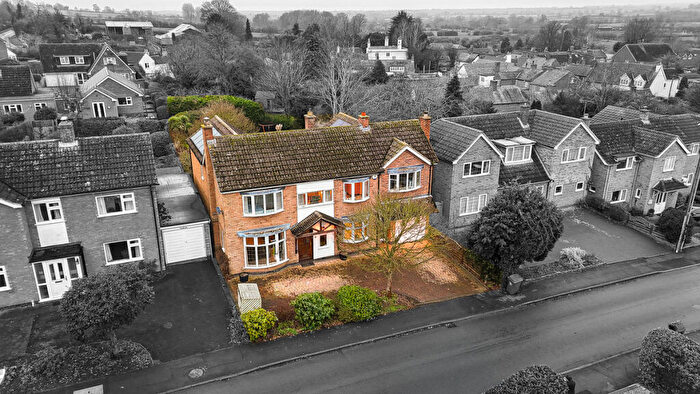
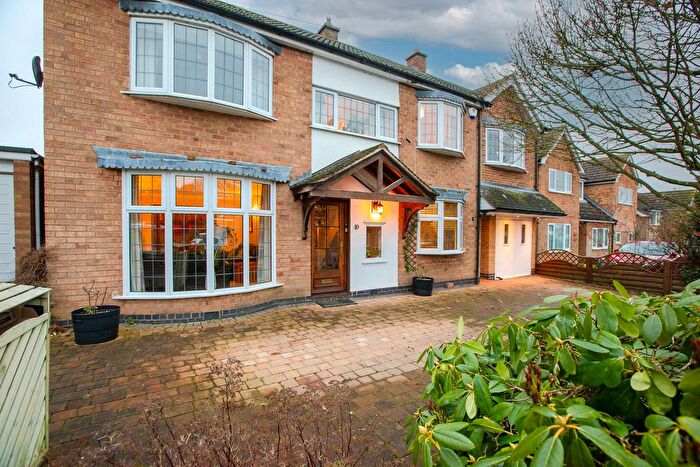
Properties in Old Dalby have an average house price of £377,182.00 and had 66 Property Transactions within the last 3 years¹.
Old Dalby is an area in Melton Mowbray, Leicestershire with 823 households², where the most expensive property was sold for £1,200,000.00.
Properties for sale in Old Dalby
Roads and Postcodes in Old Dalby
Navigate through our locations to find the location of your next house in Old Dalby, Melton Mowbray for sale or to rent.
| Streets | Postcodes |
|---|---|
| Belvoir Avenue | LE14 3HP |
| Blacksmiths Close | LE14 3EW |
| Chapel Close | LE14 3HW |
| Chapel Lane | LE14 3EN LE14 3LA LE14 3HS |
| Church End | LE14 3ET |
| Church Lane | LE14 3HT LE14 3LB LE14 3HU |
| Clawson Lane | LE14 3HX |
| Clawson Road | LE14 4SP LE14 4SW |
| Croft Gardens | LE14 3LE |
| Dairy Lane | LE14 3EU |
| Dalby Road | LE14 3EX LE14 3EY |
| Debdale Hill | LE14 3LF |
| Dukes Road | LE14 3LG |
| Earls Road | LE14 3LQ |
| Gibsons Lane | LE14 3LH |
| Greaves Avenue | LE14 3QE |
| Green Hill | LE14 3LJ |
| Hawthorne Close | LE14 3LN |
| Hecadeck Lane | LE14 3EZ |
| Hedgerow Close | LE14 3JS |
| Holwell Lane | LE14 4ET |
| Home Farm Court | LE14 3AU |
| Ironstone Lane | LE14 4SU |
| King Street | LE14 3HA |
| Kingsway Close | LE14 3NG |
| Knights Road | LE14 3NF |
| Landyke Lane | LE14 4SX |
| Lawn Lane | LE14 3LW |
| Longcliff Close | LE14 3LU |
| Longcliff Hill | LE14 3JY |
| Longcliffe Hill | LE14 3LP |
| Lower Enterprise Road | LE14 3AY |
| Main Road | LE14 3HB LE14 3LR LE14 3LT LE14 3LS |
| Main Street | LE14 3HY LE14 4SZ LE14 3HZ |
| Melton Road | LE14 3JA LE14 3ES |
| Middle Enterprise Road | LE14 3BU |
| Middle Lane | LE14 3HD |
| North Drive | LE14 3HQ |
| North Lodge Road | LE14 3JT |
| Nottingham Lane | LE14 3LX |
| Nottingham Road | LE14 3JB LE14 3JD |
| Nursery Lane | LE14 4UF |
| Old Dalby Trading Estate | LE14 3NJ |
| Oval Way | LE14 3DJ |
| Paddys Lane | LE14 3LY |
| Paradise Lane | LE14 3NH |
| Parnhams Close | LE14 3HF |
| Potter Hill | LE14 3JE |
| Princes Road | LE14 3LZ |
| Queensway | LE14 3QH LE14 3QQ |
| Quorn Avenue | LE14 3JF |
| Saxilby Road | LE14 3JG LE14 3AS |
| Six Hills Lane | LE14 3NB |
| Six Hills Road | LE14 3JQ LE14 3PR |
| Spring Lane | LE14 3HR |
| Station Lane | LE14 3ND |
| Station Road | LE14 3NE |
| Stone Penn Lane | LE14 4SJ |
| The Crescent | LE14 3LD |
| The Crown Business Park | LE14 3NQ |
| The Green | LE14 3LL |
| The Paddock | LE14 3AT |
| Thompson Close | LE14 3DH |
| Upper Enterprise Road | LE14 3DA LE14 3DZ |
| Wartnaby Road | LE14 3JJ |
| Welby Lane | LE14 3JR |
Transport near Old Dalby
- FAQ
- Price Paid By Year
- Property Type Price
Frequently asked questions about Old Dalby
What is the average price for a property for sale in Old Dalby?
The average price for a property for sale in Old Dalby is £377,182. This amount is 29% higher than the average price in Melton Mowbray. There are 641 property listings for sale in Old Dalby.
What streets have the most expensive properties for sale in Old Dalby?
The streets with the most expensive properties for sale in Old Dalby are Nottingham Road at an average of £1,192,500, Dairy Lane at an average of £950,000 and Church Lane at an average of £750,250.
What streets have the most affordable properties for sale in Old Dalby?
The streets with the most affordable properties for sale in Old Dalby are Station Lane at an average of £190,000, Clawson Lane at an average of £210,000 and Parnhams Close at an average of £214,500.
Which train stations are available in or near Old Dalby?
Some of the train stations available in or near Old Dalby are Melton Mowbray, Sileby and Barrow-Upon-Soar.
Property Price Paid in Old Dalby by Year
The average sold property price by year was:
| Year | Average Sold Price | Price Change |
Sold Properties
|
|---|---|---|---|
| 2025 | £412,450 | 1% |
20 Properties |
| 2024 | £409,664 | 21% |
21 Properties |
| 2023 | £321,684 | -49% |
25 Properties |
| 2022 | £479,150 | 11% |
36 Properties |
| 2021 | £425,510 | 25% |
49 Properties |
| 2020 | £318,997 | 1% |
23 Properties |
| 2019 | £315,038 | 6% |
26 Properties |
| 2018 | £295,077 | 14% |
29 Properties |
| 2017 | £253,365 | 10% |
27 Properties |
| 2016 | £229,020 | -40% |
24 Properties |
| 2015 | £321,638 | 17% |
35 Properties |
| 2014 | £268,284 | 2% |
35 Properties |
| 2013 | £262,424 | -14% |
27 Properties |
| 2012 | £299,933 | 30% |
24 Properties |
| 2011 | £209,413 | -17% |
23 Properties |
| 2010 | £245,845 | -2% |
26 Properties |
| 2009 | £249,545 | 7% |
21 Properties |
| 2008 | £232,937 | -48% |
16 Properties |
| 2007 | £345,539 | 26% |
34 Properties |
| 2006 | £255,785 | 12% |
35 Properties |
| 2005 | £224,714 | 4% |
27 Properties |
| 2004 | £215,946 | 3% |
31 Properties |
| 2003 | £210,403 | 22% |
38 Properties |
| 2002 | £164,358 | 0,3% |
46 Properties |
| 2001 | £163,884 | 47% |
42 Properties |
| 2000 | £87,634 | -43% |
69 Properties |
| 1999 | £125,741 | 21% |
39 Properties |
| 1998 | £98,765 | -0,2% |
30 Properties |
| 1997 | £98,962 | -4% |
30 Properties |
| 1996 | £103,141 | 12% |
24 Properties |
| 1995 | £90,905 | - |
19 Properties |
Property Price per Property Type in Old Dalby
Here you can find historic sold price data in order to help with your property search.
The average Property Paid Price for specific property types in the last three years are:
| Property Type | Average Sold Price | Sold Properties |
|---|---|---|
| Semi Detached House | £270,866.00 | 29 Semi Detached Houses |
| Detached House | £549,111.00 | 27 Detached Houses |
| Terraced House | £240,868.00 | 8 Terraced Houses |
| Flat | £143,000.00 | 2 Flats |

