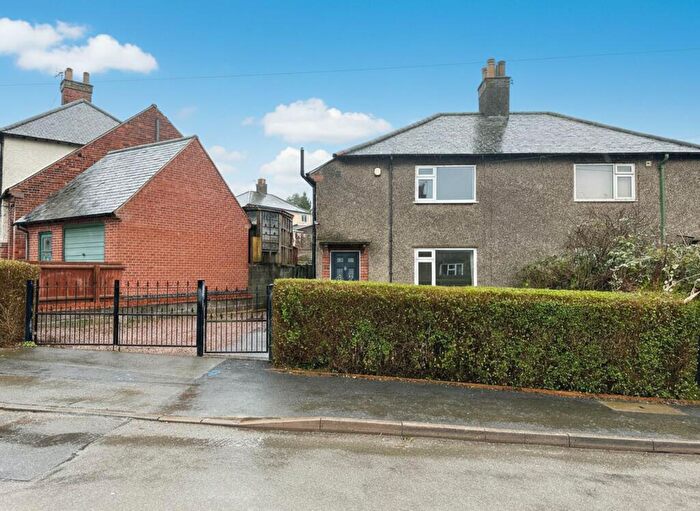
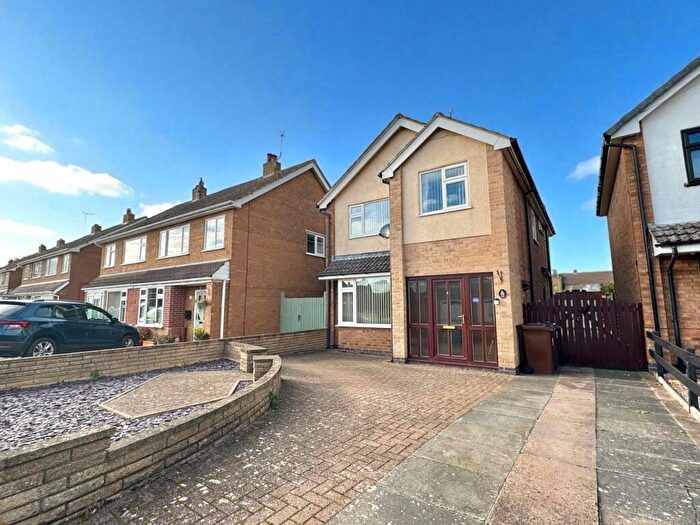
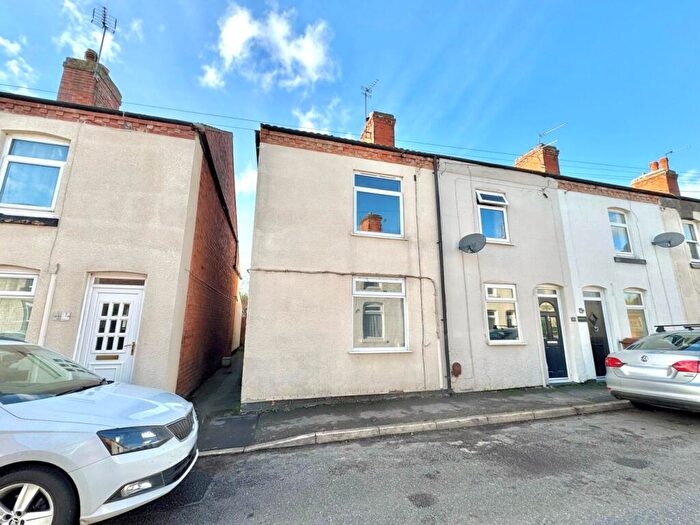
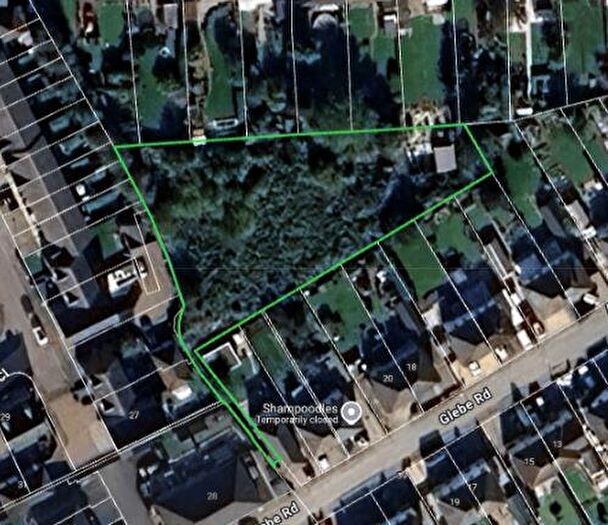
Houses for sale & to rent in Asfordby, Melton Mowbray
House Prices in Asfordby
Properties in Asfordby have an average house price of £233,646.00 and had 173 Property Transactions within the last 3 years¹.
Asfordby is an area in Melton Mowbray, Leicestershire with 1,453 households², where the most expensive property was sold for £640,000.00.
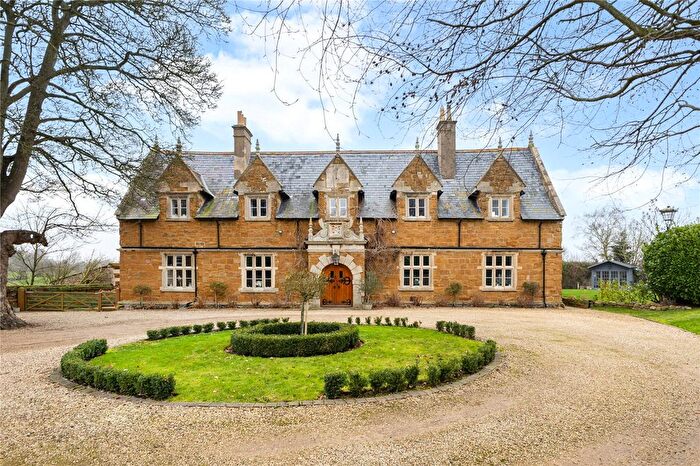
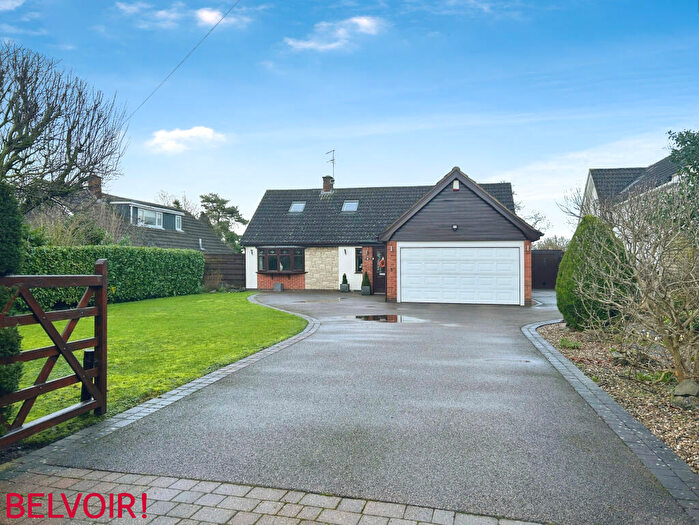
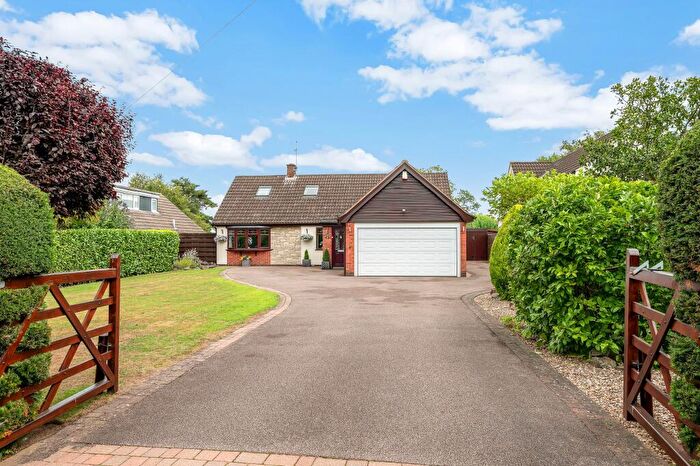
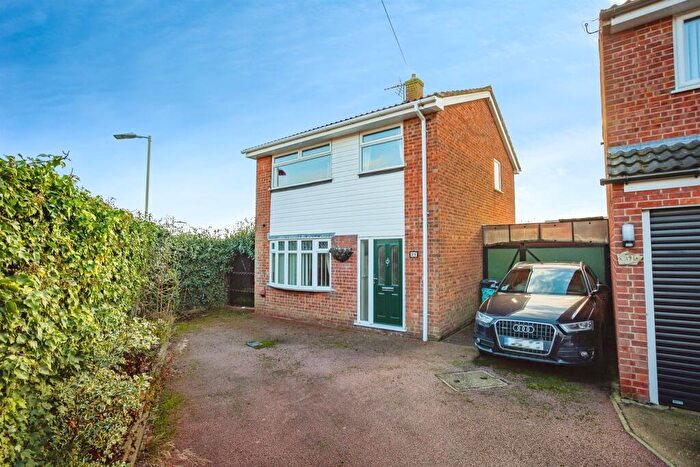
Properties for sale in Asfordby
Previously listed properties in Asfordby
Roads and Postcodes in Asfordby
Navigate through our locations to find the location of your next house in Asfordby, Melton Mowbray for sale or to rent.
| Streets | Postcodes |
|---|---|
| All Saints Close | LE14 3TF |
| Antill Close | LE14 3YT |
| Asfordby Place | LE14 3TG |
| Bradgate Lane | LE14 3YB LE14 3YD LE14 3YA LE14 3YE LE14 3YS |
| Brook Crescent | LE14 3RS |
| Brook Lane | LE14 3RT |
| Burnaby Place | LE14 3YF |
| Bypass Road | LE14 3YU |
| Chadwell Close | LE14 3TQ |
| Charnwood Avenue | LE14 3YG |
| Church Lane | LE14 3RU |
| Cowman Close | LE14 3RW |
| Crompton Road | LE14 3QS |
| Dalgliesh Way | LE14 3RX |
| Debdale Place | LE14 3TH |
| Dwyers Close | LE14 3RG |
| Field Close | LE14 3XZ |
| Finch Walk | LE14 3UA |
| Flint Drive | LE14 3UH |
| Glebe Road | LE14 3QT |
| Glendon Close | LE14 3TJ |
| Hall Drive | LE14 3SU |
| Harland Close | LE14 3SE |
| Hazlewood Crescent | LE14 3UB |
| Hoby Road | LE14 2NS LE14 3TL |
| Houghton Close | LE14 3QL |
| Jubilee Avenue | LE14 3RY |
| Klondyke Way | LE14 3TN LE14 3TW |
| Leah Way | LE14 3XY |
| Loughborough Road | LE14 3TP LE14 3TR |
| Main Road | LE14 3SP LE14 3SW LE14 3AX |
| Main Street | LE14 3RZ LE14 3SA LE14 3TS LE14 3TT LE14 3SY |
| Marriott Close | LE14 3RH |
| Meadow Close | LE14 3SB |
| Melton Road | LE14 3QX |
| Mill Lane | LE14 3SF |
| Moncrief Drive | LE14 3BP |
| Morris Cam Walk | LE14 3UD |
| New Street | LE14 3SG |
| North Street | LE14 3SQ |
| North View Close | LE14 3NL |
| Park View | LE14 3BS |
| Prince Charles Street | LE14 3YJ |
| Princess Ann Square | LE14 3YH |
| Pump Lane | LE14 3SH |
| Red Deer Close | LE14 3UJ |
| Regency Road | LE14 3YL LE14 3YN LE14 3YW |
| Ridings Close | LE14 3TA |
| River Close | LE14 3BT |
| Riverside Walk | LE14 3SD |
| Rosebery Avenue | LE14 3SJ |
| Sarson Close | LE14 3UG |
| Saxelby Road | LE14 3TU LE14 3DF |
| South Street | LE14 3QZ |
| Southview | LE14 3TX |
| St Bartholomews Way | LE14 3JP |
| St Johns Road | LE14 3QY |
| Stanton Road | LE14 3RA |
| Station Lane | LE14 3SL |
| Sunset Drive | LE14 3XW |
| The Crescent | LE14 3YQ |
| The Grove | LE14 3UF |
| Townend Close | LE14 3TY |
| Welby Road | LE14 3RB LE14 3RD LE14 3JL LE14 3RE LE14 3EF |
| West Side | LE14 3RF |
| Western Road | LE14 3UE |
| Whitlock Way | LE14 3YP |
| Woodhouse Road | LE14 3YR |
| Wreake Crescent | LE14 3TZ |
Transport near Asfordby
- FAQ
- Price Paid By Year
- Property Type Price
Frequently asked questions about Asfordby
What is the average price for a property for sale in Asfordby?
The average price for a property for sale in Asfordby is £233,646. This amount is 20% lower than the average price in Melton Mowbray. There are 452 property listings for sale in Asfordby.
What streets have the most expensive properties for sale in Asfordby?
The streets with the most expensive properties for sale in Asfordby are Church Lane at an average of £640,000, Meadow Close at an average of £425,000 and Station Lane at an average of £418,333.
What streets have the most affordable properties for sale in Asfordby?
The streets with the most affordable properties for sale in Asfordby are Brook Crescent at an average of £110,000, New Street at an average of £149,600 and Dwyers Close at an average of £162,000.
Which train stations are available in or near Asfordby?
Some of the train stations available in or near Asfordby are Melton Mowbray, Sileby and Syston.
Property Price Paid in Asfordby by Year
The average sold property price by year was:
| Year | Average Sold Price | Price Change |
Sold Properties
|
|---|---|---|---|
| 2025 | £231,564 | 1% |
45 Properties |
| 2024 | £229,477 | -5% |
70 Properties |
| 2023 | £240,293 | 6% |
58 Properties |
| 2022 | £226,071 | 7% |
63 Properties |
| 2021 | £209,227 | 11% |
93 Properties |
| 2020 | £186,613 | -10% |
78 Properties |
| 2019 | £205,202 | 8% |
83 Properties |
| 2018 | £189,614 | 17% |
55 Properties |
| 2017 | £158,016 | -5% |
59 Properties |
| 2016 | £166,184 | 5% |
59 Properties |
| 2015 | £158,227 | 5% |
54 Properties |
| 2014 | £150,090 | 9% |
85 Properties |
| 2013 | £136,091 | -4% |
75 Properties |
| 2012 | £141,505 | -4% |
55 Properties |
| 2011 | £147,367 | -7% |
59 Properties |
| 2010 | £157,591 | 8% |
59 Properties |
| 2009 | £144,235 | 3% |
58 Properties |
| 2008 | £139,254 | -10% |
42 Properties |
| 2007 | £153,494 | 11% |
86 Properties |
| 2006 | £137,262 | 6% |
77 Properties |
| 2005 | £128,379 | 11% |
54 Properties |
| 2004 | £114,740 | 12% |
67 Properties |
| 2003 | £100,668 | 21% |
79 Properties |
| 2002 | £79,381 | 11% |
84 Properties |
| 2001 | £70,420 | 21% |
101 Properties |
| 2000 | £55,351 | 0,5% |
76 Properties |
| 1999 | £55,089 | 2% |
50 Properties |
| 1998 | £54,006 | 14% |
75 Properties |
| 1997 | £46,332 | 6% |
91 Properties |
| 1996 | £43,714 | 0,4% |
51 Properties |
| 1995 | £43,540 | - |
52 Properties |
Property Price per Property Type in Asfordby
Here you can find historic sold price data in order to help with your property search.
The average Property Paid Price for specific property types in the last three years are:
| Property Type | Average Sold Price | Sold Properties |
|---|---|---|
| Semi Detached House | £220,274.00 | 89 Semi Detached Houses |
| Detached House | £353,203.00 | 34 Detached Houses |
| Terraced House | £178,061.00 | 49 Terraced Houses |
| Flat | £82,500.00 | 1 Flat |

