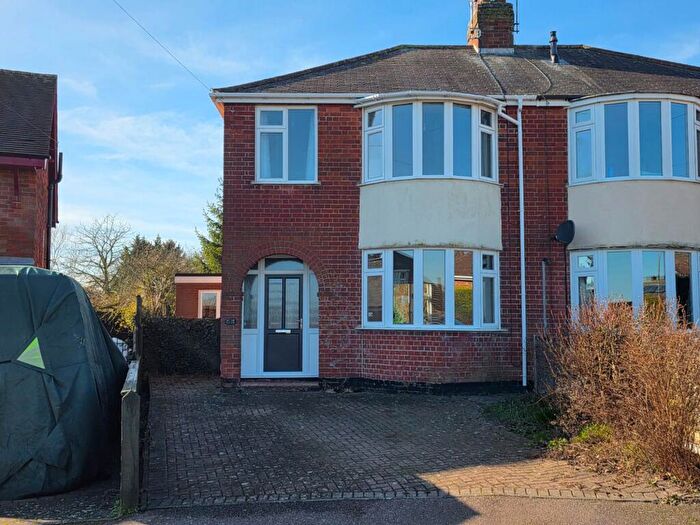
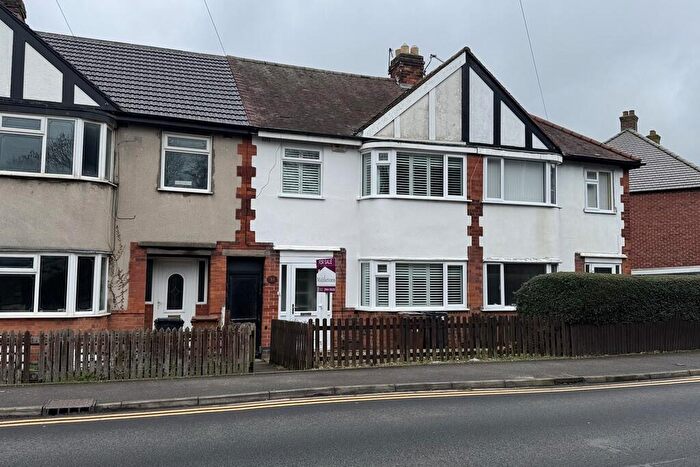
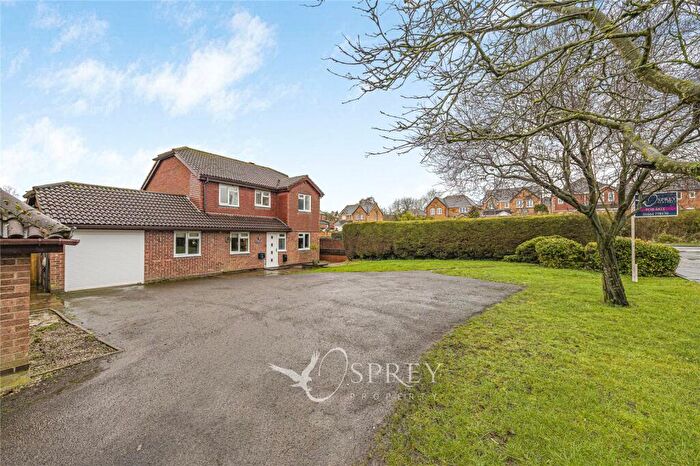
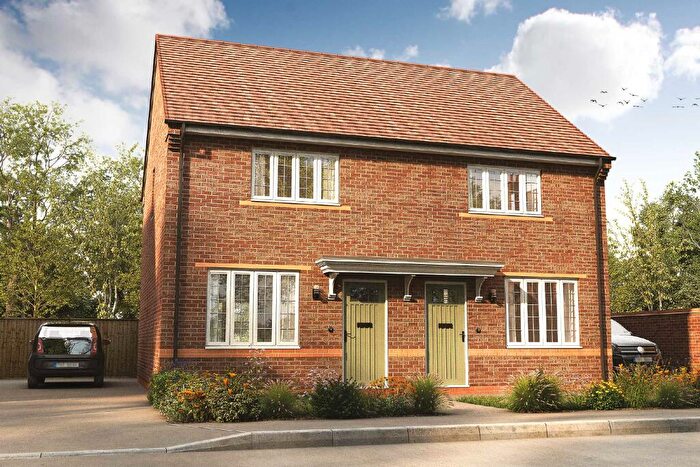
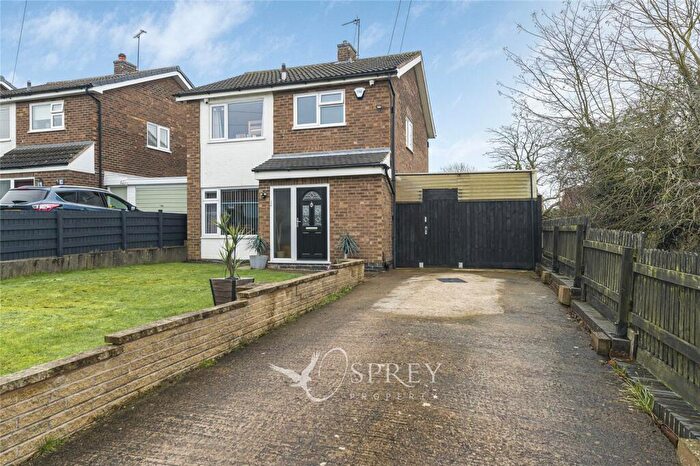
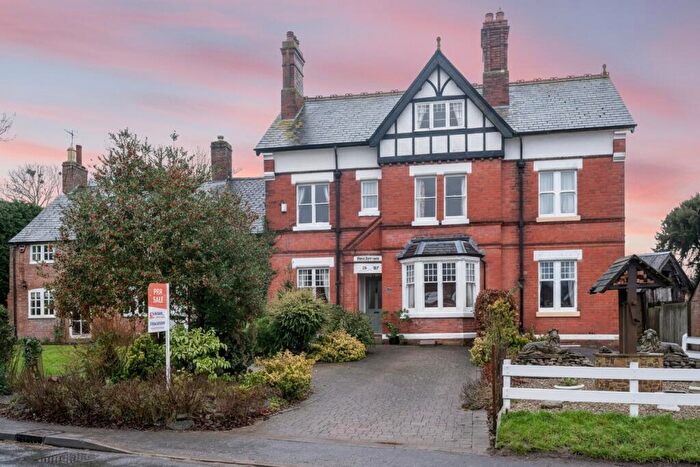
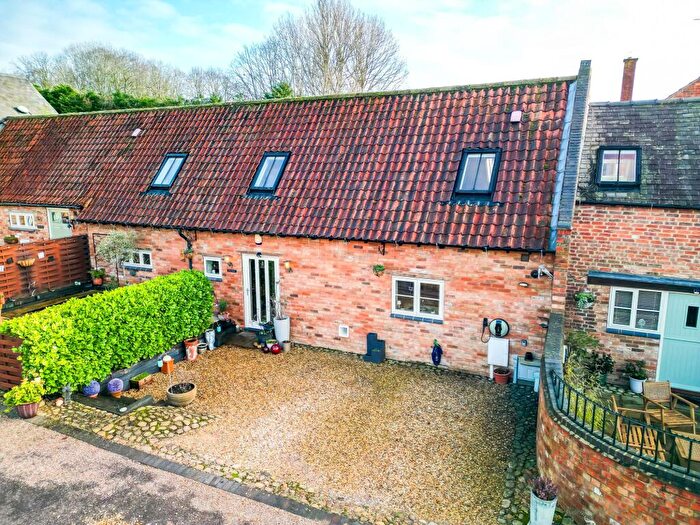
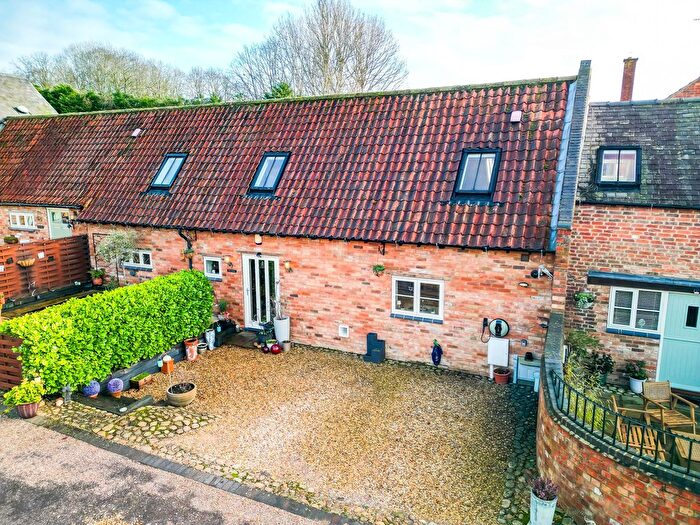
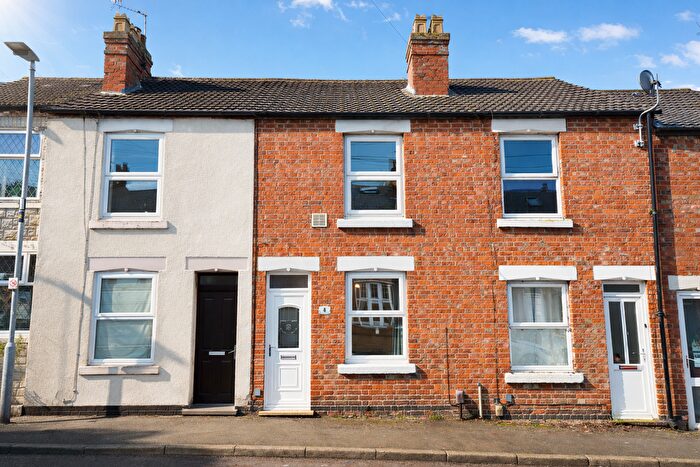
Houses for sale & to rent in Gaddesby, Melton Mowbray
House Prices in Gaddesby
Properties in Gaddesby have an average house price of £464,371.00 and had 32 Property Transactions within the last 3 years¹.
Gaddesby is an area in Melton Mowbray, Leicestershire with 451 households², where the most expensive property was sold for £885,000.00.
Properties for sale in Gaddesby
Roads and Postcodes in Gaddesby
Navigate through our locations to find the location of your next house in Gaddesby, Melton Mowbray for sale or to rent.
| Streets | Postcodes |
|---|---|
| Barnard Close | LE14 2XU |
| Benskin Close | LE14 2UF |
| Burdetts Close | LE14 2EN |
| Burrough End | LE14 2EW |
| Burrough Road | LE14 2EP LE14 2UG |
| Child Close | LE14 2UT |
| Church Lane | LE14 2TA |
| Church Lea | LE14 2UB |
| Church Walk | LE14 2UQ |
| Cross Lane | LE14 2UH |
| Crown Hill | LE14 2ER |
| Folville Street | LE14 2TE |
| Gaddesby Lane | LE14 2TG |
| Gartree Hill Road | LE14 2UL LE14 2UJ |
| Glebe Court | LE14 2FA |
| Great Dalby Road | LE14 2TL LE14 2TU |
| Hall Drive | LE14 2UN |
| Highfield End | LE14 2TP |
| Hollow Lane | LE14 2UW |
| Kirby Road | LE14 2HD |
| Lime Street | LE14 2UP |
| Little Dalby Road | LE14 2ES |
| Main Street | LE14 2ET LE14 2EU |
| Melton Road | LE14 2UR |
| Nether End | LE14 2EY |
| New Road | LE14 2UU |
| Pasture Lane | LE14 2TT |
| Pebble Yard | LE14 2HB |
| Peppers Lane | LE14 2XA |
| Pickwell Lane | LE14 2BQ |
| Racecourse Lane | LE14 2UY |
| Sandy Lane | LE14 2BH |
| Sawgate Road | LE14 2XL |
| Station Road | LE14 2EZ |
| The Close | LE14 2UX |
| The Green | LE14 2EX |
| The Yews | LE14 2EH |
| Thorpe Satchville Road | LE14 2EL |
| Top End | LE14 2HA |
| Woodgate Hill | LE14 2BJ |
Transport near Gaddesby
- FAQ
- Price Paid By Year
- Property Type Price
Frequently asked questions about Gaddesby
What is the average price for a property for sale in Gaddesby?
The average price for a property for sale in Gaddesby is £464,371. This amount is 59% higher than the average price in Melton Mowbray. There are 2,505 property listings for sale in Gaddesby.
What streets have the most expensive properties for sale in Gaddesby?
The streets with the most expensive properties for sale in Gaddesby are Lime Street at an average of £679,950, The Yews at an average of £560,000 and Child Close at an average of £540,000.
What streets have the most affordable properties for sale in Gaddesby?
The streets with the most affordable properties for sale in Gaddesby are Hall Drive at an average of £118,650, Racecourse Lane at an average of £265,000 and Nether End at an average of £375,000.
Which train stations are available in or near Gaddesby?
Some of the train stations available in or near Gaddesby are Melton Mowbray, Oakham and Syston.
Property Price Paid in Gaddesby by Year
The average sold property price by year was:
| Year | Average Sold Price | Price Change |
Sold Properties
|
|---|---|---|---|
| 2025 | £408,214 | -12% |
14 Properties |
| 2024 | £455,240 | -26% |
10 Properties |
| 2023 | £574,062 | 32% |
8 Properties |
| 2022 | £388,966 | -127% |
22 Properties |
| 2021 | £881,585 | 56% |
17 Properties |
| 2020 | £387,015 | -10% |
13 Properties |
| 2019 | £426,409 | 7% |
11 Properties |
| 2018 | £396,768 | 21% |
24 Properties |
| 2017 | £314,736 | -46% |
15 Properties |
| 2016 | £459,139 | 19% |
14 Properties |
| 2015 | £373,020 | 15% |
20 Properties |
| 2014 | £316,560 | -24% |
23 Properties |
| 2013 | £393,023 | 30% |
19 Properties |
| 2012 | £277,023 | -36% |
13 Properties |
| 2011 | £377,207 | 15% |
7 Properties |
| 2010 | £318,916 | 4% |
12 Properties |
| 2009 | £306,883 | -5% |
9 Properties |
| 2008 | £321,599 | 4% |
5 Properties |
| 2007 | £309,227 | 8% |
24 Properties |
| 2006 | £283,518 | 14% |
25 Properties |
| 2005 | £243,900 | 5% |
15 Properties |
| 2004 | £231,212 | -1% |
16 Properties |
| 2003 | £233,678 | 21% |
19 Properties |
| 2002 | £184,130 | 14% |
18 Properties |
| 2001 | £157,432 | 6% |
17 Properties |
| 2000 | £148,698 | 10% |
25 Properties |
| 1999 | £133,579 | 4% |
22 Properties |
| 1998 | £128,161 | 14% |
19 Properties |
| 1997 | £110,632 | -14% |
17 Properties |
| 1996 | £126,052 | 24% |
18 Properties |
| 1995 | £95,966 | - |
15 Properties |
Property Price per Property Type in Gaddesby
Here you can find historic sold price data in order to help with your property search.
The average Property Paid Price for specific property types in the last three years are:
| Property Type | Average Sold Price | Sold Properties |
|---|---|---|
| Semi Detached House | £314,333.00 | 3 Semi Detached Houses |
| Detached House | £520,456.00 | 24 Detached Houses |
| Terraced House | £535,000.00 | 2 Terraced Houses |
| Flat | £118,650.00 | 3 Flats |

