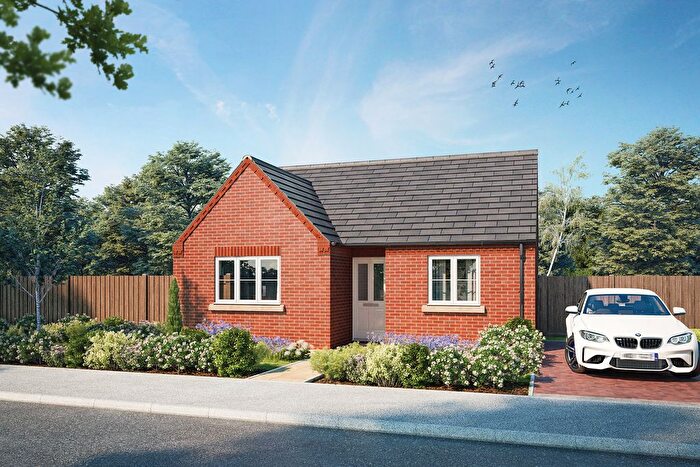
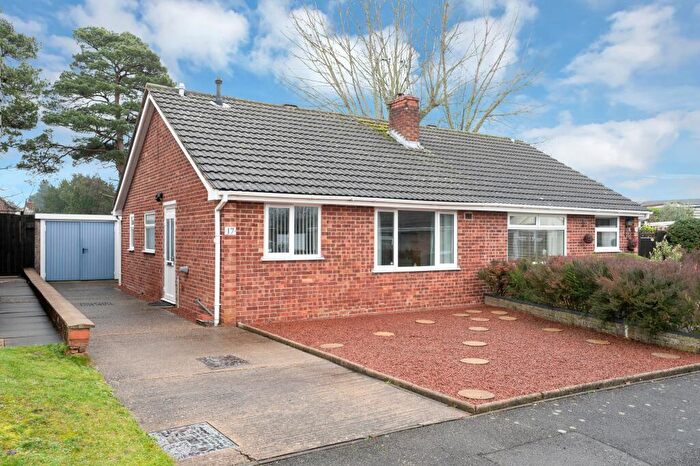
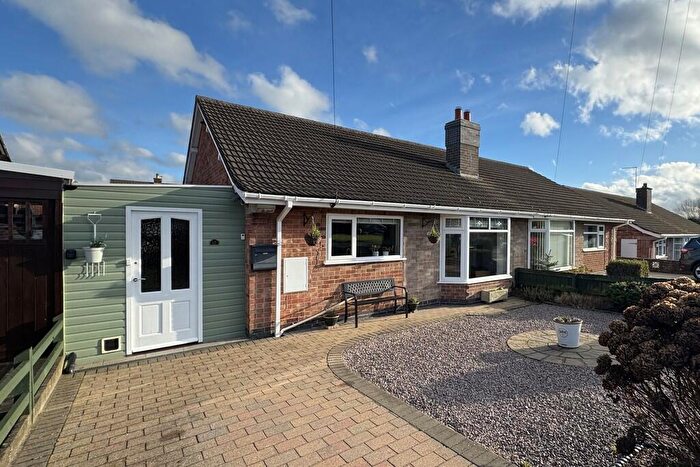
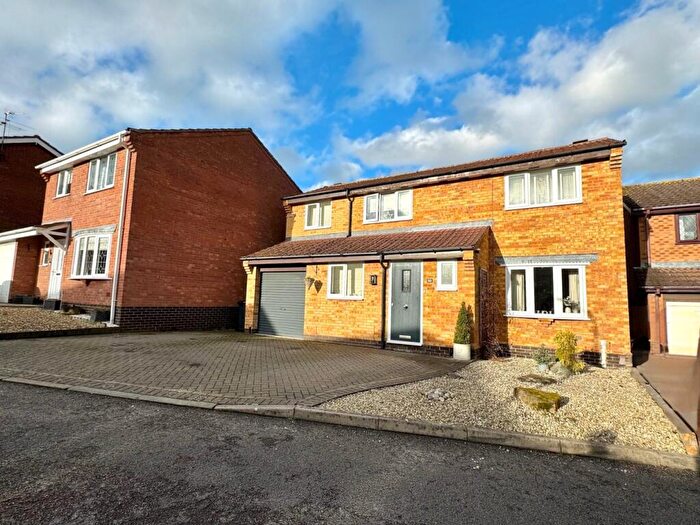
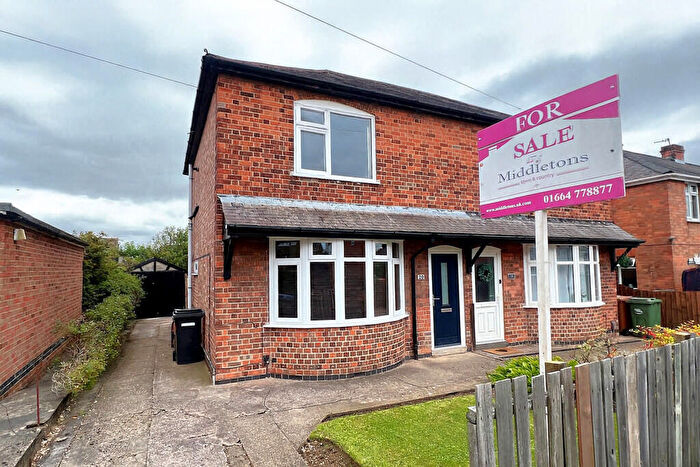
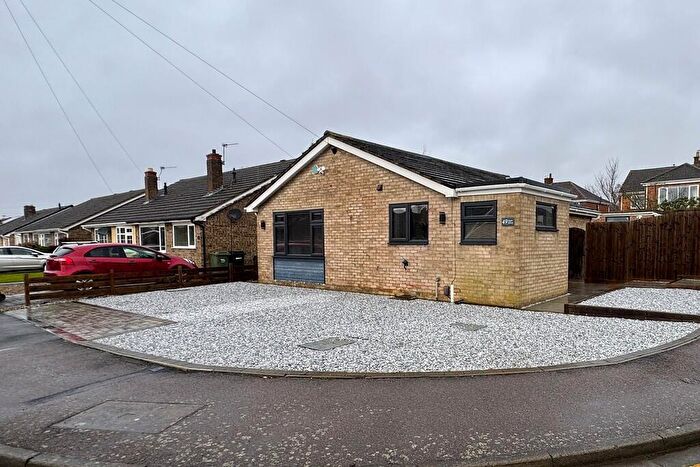
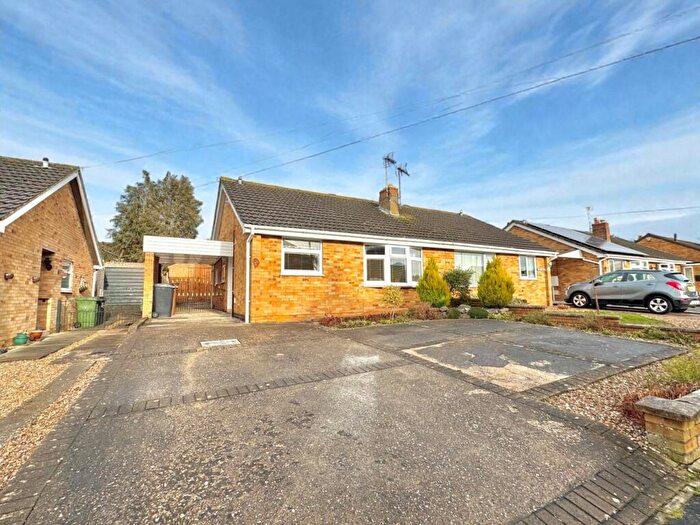
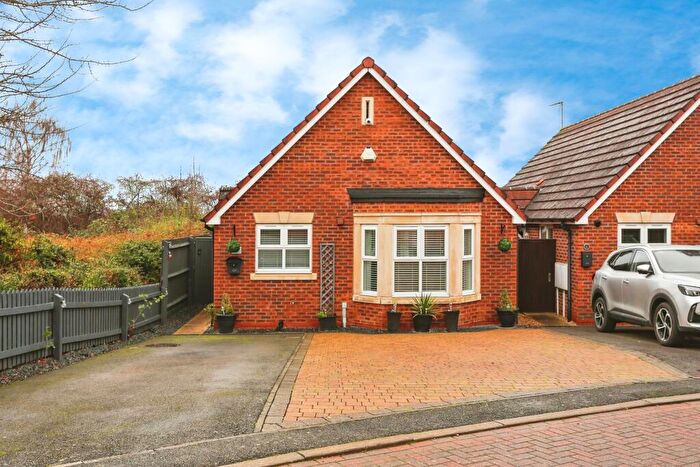
Houses for sale & to rent in Melton Egerton, Melton Mowbray
House Prices in Melton Egerton
Properties in Melton Egerton have an average house price of £224,480.00 and had 118 Property Transactions within the last 3 years¹.
Melton Egerton is an area in Melton Mowbray, Leicestershire with 1,647 households², where the most expensive property was sold for £580,000.00.
Properties for sale in Melton Egerton
Roads and Postcodes in Melton Egerton
Navigate through our locations to find the location of your next house in Melton Egerton, Melton Mowbray for sale or to rent.
| Streets | Postcodes |
|---|---|
| Arden Drive | LE13 0JX |
| Asfordby Road | LE13 0HN LE13 0HP LE13 0HR LE13 0HS LE13 0HW LE13 0HJ LE13 0HT LE13 0UT |
| Ash Grove | LE13 0PL |
| Birch Close | LE13 0QA |
| Bowmans Close | LE13 0RP |
| Brightside Avenue | LE13 0JY |
| Cedar Drive | LE13 0PA |
| Charnwood Drive | LE13 0JZ |
| Chetwynd Drive | LE13 0HU |
| Cleves Close | LE13 0LZ |
| Clumber Street | LE13 0ND |
| Collingwood Close | LE13 0JU |
| Collingwood Crescent | LE13 0HX |
| Cottesmore Avenue | LE13 0HY |
| Dorothy Avenue | LE13 0LA LE13 0LB |
| Douglas Jane Close | LE13 0LY |
| East Avenue | LE13 0LD |
| Fernie Avenue | LE13 0HZ |
| Greaves Avenue | LE13 0LE |
| Hawthorn Drive | LE13 0PQ |
| High Street | LE13 0TR LE13 0TU |
| Holland Road | LE13 0LU |
| Horse Field View | LE13 0TF |
| Jarvis Drive | LE13 0LF |
| Jaya Close | LE13 0UU |
| Kingfisher Court | LE13 0HL |
| Lilac Way | LE13 0PJ |
| Maple Close | LE13 0PH |
| Melbourne Drive | LE13 0JA |
| Melton Road | LE14 3QU |
| Morley Close | LE13 0LG |
| Nevada Park | LE13 0JD |
| Nottingham Road | LE13 0NP LE13 0GP LE13 0PB LE13 9SA LE13 9SD LE13 9SE LE13 9SF LE13 9SG LE13 9SH LE13 9SJ LE13 9SL LE13 9SN LE13 9SP LE13 9SQ LE13 9SR LE13 9SS LE13 9ST LE13 9SU LE13 9SW LE13 9SX LE13 9SY LE13 0UL |
| Nottingham Street | LE13 1NN LE13 1NT |
| Park Avenue | LE13 0JB |
| Park Road | LE13 1TT LE13 1TX LE13 1TY |
| Petersfield Road | LE13 0UE |
| Quorn Avenue | LE13 0JE |
| Riverside Road | LE13 0JF |
| Rockingham Drive | LE13 0LQ |
| Rossiter Close | LE13 0NZ |
| Rudbeck Avenue | LE13 0LH LE13 0LJ |
| Scalford Road | LE13 1JY |
| Sherwood Drive | LE13 0LL |
| St Leonards Close | LE13 0RN |
| St Peters Walk | LE13 0XW |
| Station Approach | LE13 9SB |
| Staveley Road | LE13 0LN LE13 0LW |
| Stirling Road | LE13 0UF LE13 0UG LE13 0UQ |
| Sycamore Close | LE13 0PX |
| Sysonby Grange Lane | LE13 0JG |
| Sysonby Street | LE13 0LP LE13 0GJ |
| The Crescent | LE13 0NF |
| Weaver Green | LE13 0UH |
| Welby Lane | LE13 0ST LE13 0TA |
| Wellington Way | LE13 0TG |
| West Avenue | LE13 0JH LE13 0JJ LE13 0JQ LE13 0JL |
| Wilton Road | LE13 0UJ LE13 0UD |
| Wilton Terrace | LE13 0UN |
Transport near Melton Egerton
- FAQ
- Price Paid By Year
- Property Type Price
Frequently asked questions about Melton Egerton
What is the average price for a property for sale in Melton Egerton?
The average price for a property for sale in Melton Egerton is £224,480. This amount is 23% lower than the average price in Melton Mowbray. There are 763 property listings for sale in Melton Egerton.
What streets have the most expensive properties for sale in Melton Egerton?
The streets with the most expensive properties for sale in Melton Egerton are St Leonards Close at an average of £575,000, Melton Road at an average of £375,000 and Holland Road at an average of £360,000.
What streets have the most affordable properties for sale in Melton Egerton?
The streets with the most affordable properties for sale in Melton Egerton are Wellington Way at an average of £123,500, Wilton Terrace at an average of £135,000 and High Street at an average of £155,000.
Which train stations are available in or near Melton Egerton?
Some of the train stations available in or near Melton Egerton are Melton Mowbray, Sileby and Syston.
Property Price Paid in Melton Egerton by Year
The average sold property price by year was:
| Year | Average Sold Price | Price Change |
Sold Properties
|
|---|---|---|---|
| 2025 | £223,883 | 6% |
36 Properties |
| 2024 | £210,542 | -15% |
44 Properties |
| 2023 | £241,186 | 5% |
38 Properties |
| 2022 | £230,140 | 8% |
52 Properties |
| 2021 | £212,229 | 4% |
62 Properties |
| 2020 | £204,278 | 9% |
55 Properties |
| 2019 | £186,130 | 1% |
58 Properties |
| 2018 | £184,758 | 6% |
65 Properties |
| 2017 | £173,439 | 11% |
50 Properties |
| 2016 | £154,095 | -9% |
58 Properties |
| 2015 | £168,494 | 9% |
81 Properties |
| 2014 | £153,145 | 3% |
56 Properties |
| 2013 | £149,231 | -2% |
61 Properties |
| 2012 | £152,746 | -2% |
51 Properties |
| 2011 | £155,511 | 5% |
61 Properties |
| 2010 | £147,315 | 1% |
61 Properties |
| 2009 | £146,479 | 3% |
58 Properties |
| 2008 | £142,289 | -3% |
61 Properties |
| 2007 | £147,000 | 16% |
67 Properties |
| 2006 | £123,943 | -9% |
73 Properties |
| 2005 | £135,189 | 11% |
75 Properties |
| 2004 | £120,532 | 20% |
81 Properties |
| 2003 | £96,897 | 12% |
74 Properties |
| 2002 | £85,391 | 23% |
90 Properties |
| 2001 | £65,597 | 11% |
102 Properties |
| 2000 | £58,603 | 5% |
63 Properties |
| 1999 | £55,428 | -8% |
74 Properties |
| 1998 | £59,855 | 14% |
64 Properties |
| 1997 | £51,551 | 21% |
70 Properties |
| 1996 | £40,644 | -11% |
50 Properties |
| 1995 | £45,097 | - |
37 Properties |
Property Price per Property Type in Melton Egerton
Here you can find historic sold price data in order to help with your property search.
The average Property Paid Price for specific property types in the last three years are:
| Property Type | Average Sold Price | Sold Properties |
|---|---|---|
| Semi Detached House | £212,829.00 | 52 Semi Detached Houses |
| Detached House | £364,776.00 | 17 Detached Houses |
| Terraced House | £193,342.00 | 45 Terraced Houses |
| Flat | £130,000.00 | 4 Flats |

