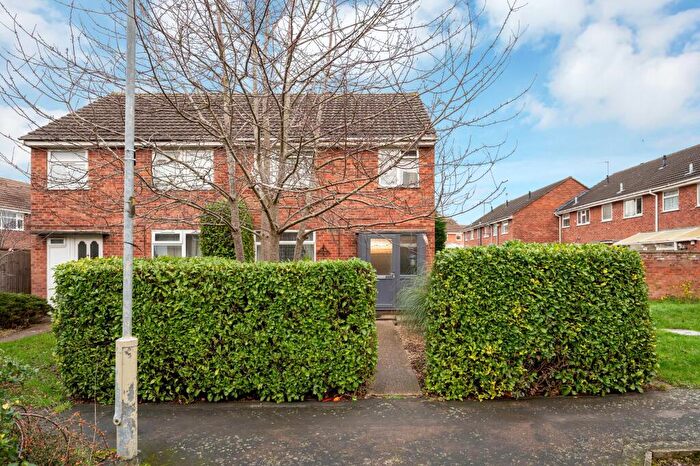
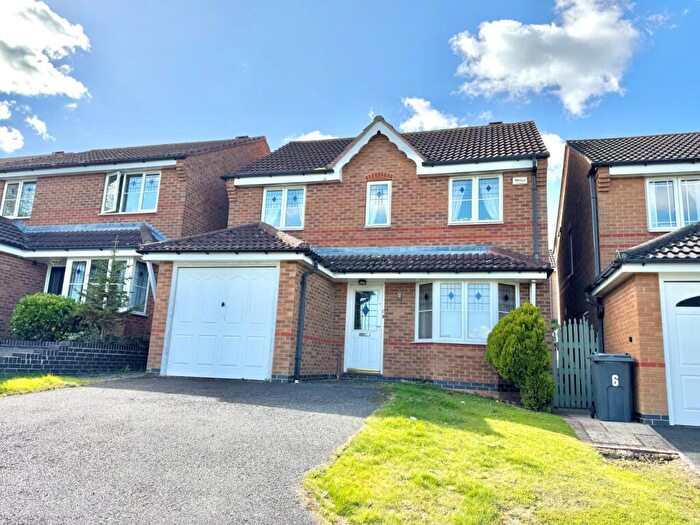
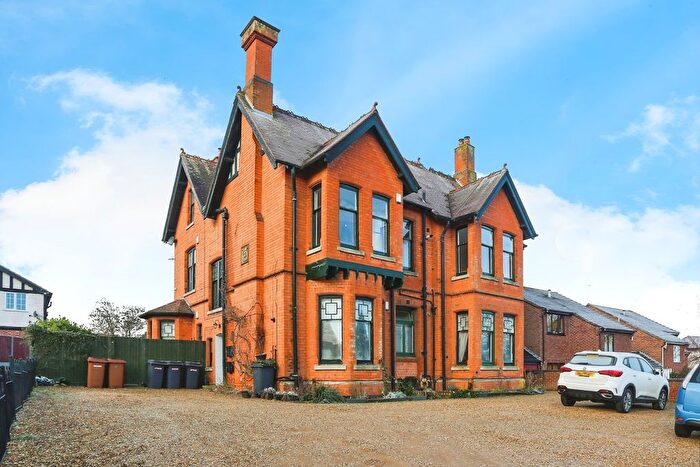
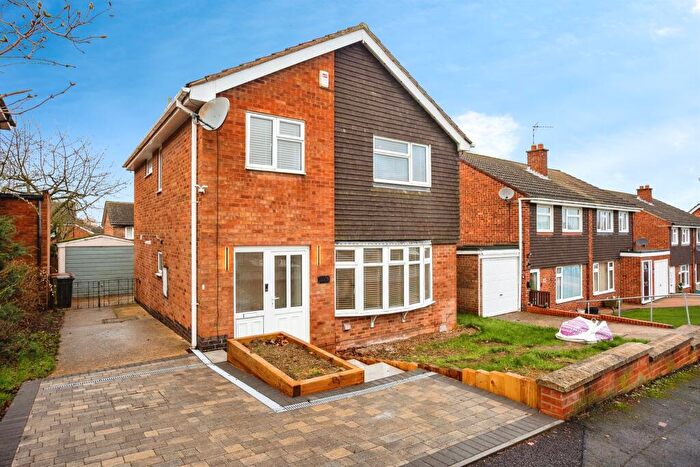
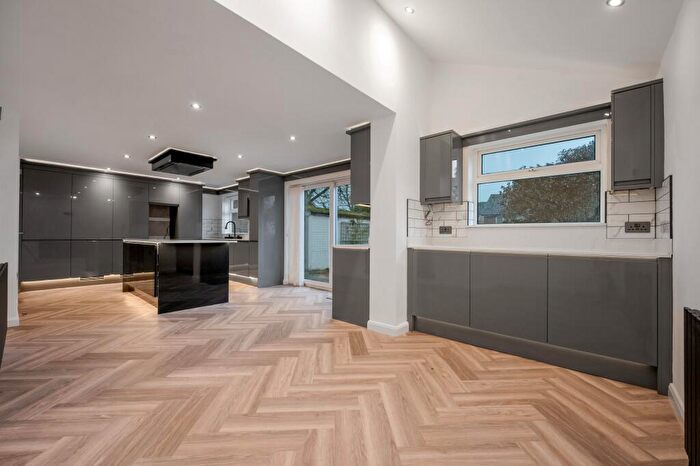
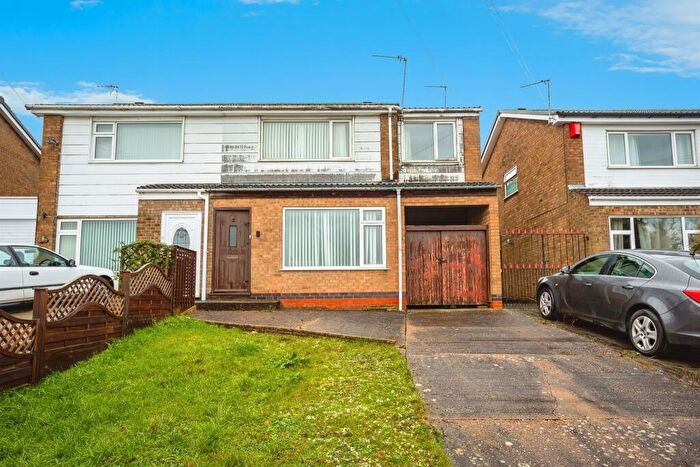
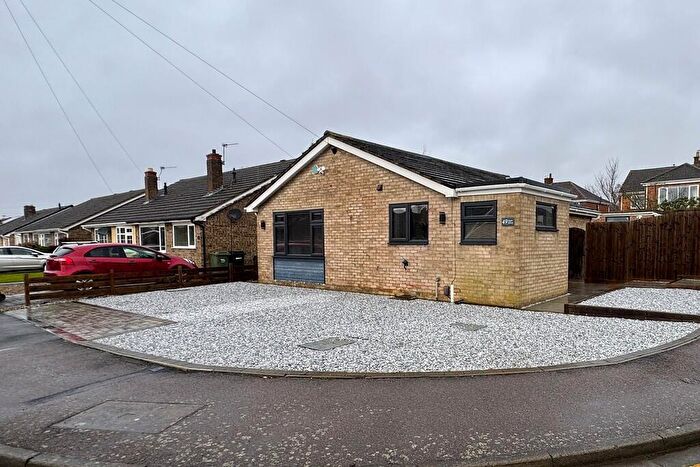
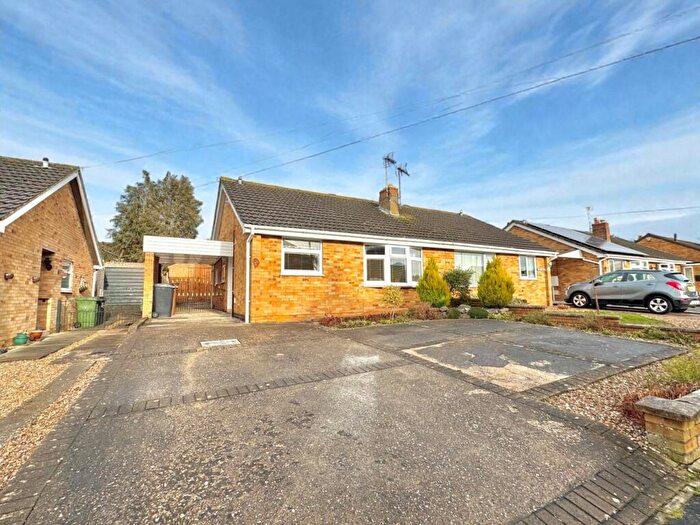
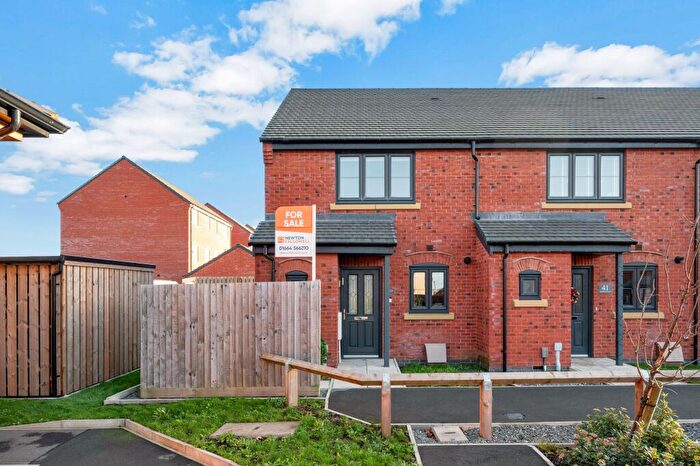
Houses for sale & to rent in Melton Warwick, Melton Mowbray
House Prices in Melton Warwick
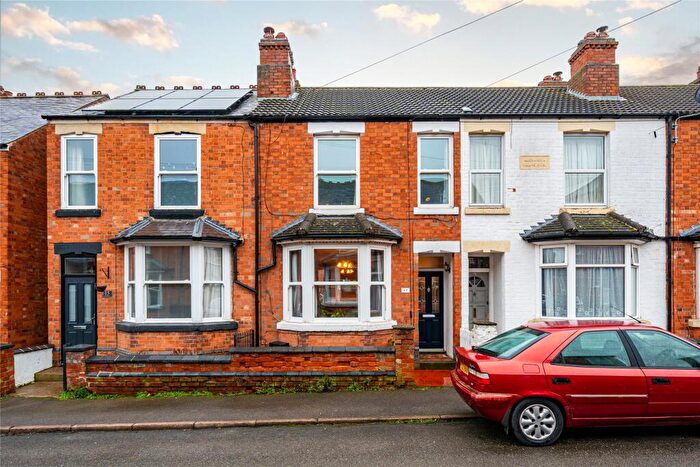
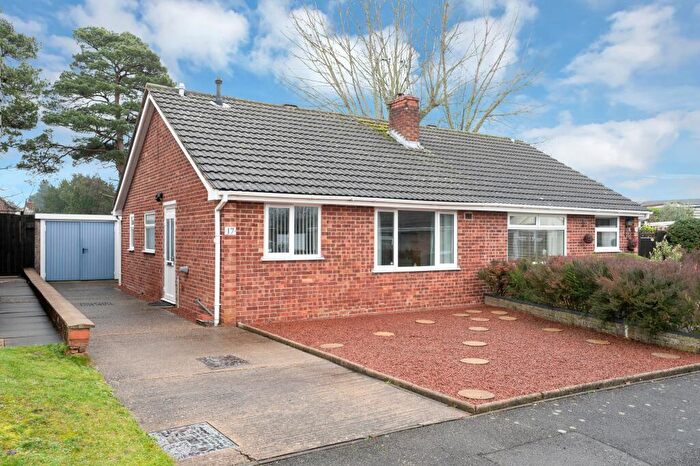
Properties in Melton Warwick have an average house price of £309,698.00 and had 141 Property Transactions within the last 3 years¹.
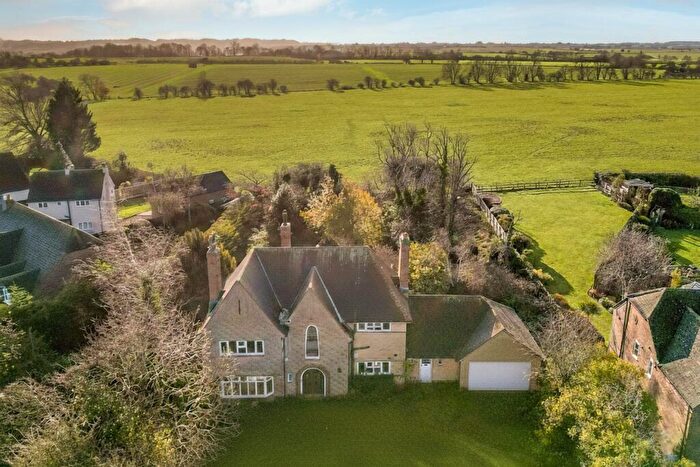
Melton Warwick is an area in Melton Mowbray, Leicestershire with 1,426 households², where the most expensive property was sold for £1,040,000.00.
Properties for sale in Melton Warwick
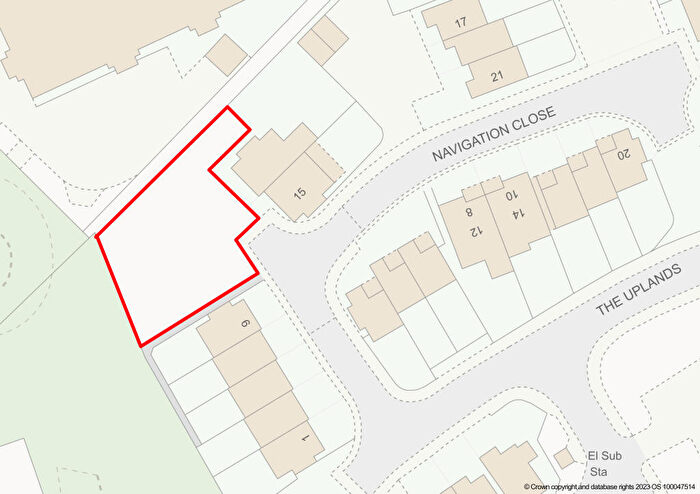
Roads and Postcodes in Melton Warwick
Navigate through our locations to find the location of your next house in Melton Warwick, Melton Mowbray for sale or to rent.
| Streets | Postcodes |
|---|---|
| Albert Street | LE13 0QH |
| Alfred Close | LE13 0RX |
| Ankle Hill | LE13 0QJ |
| Banbury Drive | LE13 0JR |
| Barker Crescent | LE13 0QN LE13 0QW |
| Blakeney Crescent | LE13 0QP LE13 0QR |
| Brownlow Crescent | LE13 0QS |
| Burgh Lodge Mews | LE13 0AE |
| Burmese Walk | LE13 0GN |
| Burton Road | LE13 1DJ LE13 1DL |
| Cambridge Avenue | LE13 0AA |
| Chalfont Close | LE13 0JW |
| Cheapside | LE13 0TP |
| Church Street | LE13 0PN |
| Church Terrace | LE13 0PW |
| College Avenue | LE13 0AB |
| Cornwall Place | LE13 0BE |
| Cotswold Close | LE13 0JT |
| Craven Street | LE13 0QT LE13 0QU |
| Cromwell Road | LE13 0AD |
| Dalby Road | LE13 0BG LE13 0BQ |
| Dorset Drive | LE13 0JN |
| Durham Close | LE13 0RJ |
| Essex Close | LE13 1AP |
| Gartree Court | LE13 0RF |
| Gloucester Avenue | LE13 0AG |
| Gloucester Crescent | LE13 0AQ |
| Goldspink Close | LE13 0QX |
| Hamilton Drive | LE13 0QY |
| Hamilton Place | LE13 0LX |
| Hartland Drive | LE13 0BX |
| Hartopp Road | LE13 0QZ |
| High Street | LE13 0TS LE13 0TT LE13 0TX LE13 0TY LE13 0TZ |
| Iris Place | LE13 0GS |
| Kennelmore Road | LE13 0RT LE13 0RU |
| Kirby Lane | LE13 0BY |
| Leicester Place | LE13 0PR |
| Leicester Street | LE13 0PP |
| Lincoln Drive | LE13 0AH |
| Market Place | LE13 1XD |
| Meynell Close | LE13 0RA |
| Norfolk Drive | LE13 0AJ LE13 0AZ |
| Oxford Drive | LE13 0AL |
| Park Lane | LE13 0PT |
| Princess Drive | LE13 0DJ LE13 0DL |
| Queensway | LE13 0DN LE13 0DW |
| Richmond Drive | LE13 0JP |
| Sandy Lane | LE13 0AN LE13 0AW LE13 0GR |
| Somerset Close | LE13 0JS |
| Station Approach | LE13 1GH |
| Sussex Avenue | LE13 0AP |
| Tennis Avenue | LE13 0RB |
| The Drive | LE13 0BT |
| Tudor Hill | LE13 0DT |
| Victoria Street | LE13 0AR LE13 0AS |
| Warwick Road | LE13 0RD |
| Worcester Drive | LE13 0AT |
| Wyndham Avenue | LE13 0RE |
Transport near Melton Warwick
- FAQ
- Price Paid By Year
- Property Type Price
Frequently asked questions about Melton Warwick
What is the average price for a property for sale in Melton Warwick?
The average price for a property for sale in Melton Warwick is £309,698. This amount is 6% higher than the average price in Melton Mowbray. There are 874 property listings for sale in Melton Warwick.
What streets have the most expensive properties for sale in Melton Warwick?
The streets with the most expensive properties for sale in Melton Warwick are Burgh Lodge Mews at an average of £665,000, Essex Close at an average of £575,000 and Lincoln Drive at an average of £450,000.
What streets have the most affordable properties for sale in Melton Warwick?
The streets with the most affordable properties for sale in Melton Warwick are Cromwell Road at an average of £155,000, Victoria Street at an average of £167,583 and Hartopp Road at an average of £168,333.
Which train stations are available in or near Melton Warwick?
Some of the train stations available in or near Melton Warwick are Melton Mowbray, Oakham and Syston.
Property Price Paid in Melton Warwick by Year
The average sold property price by year was:
| Year | Average Sold Price | Price Change |
Sold Properties
|
|---|---|---|---|
| 2025 | £299,307 | 3% |
51 Properties |
| 2024 | £291,532 | -16% |
44 Properties |
| 2023 | £338,594 | 10% |
46 Properties |
| 2022 | £303,650 | 2% |
62 Properties |
| 2021 | £298,207 | 1% |
69 Properties |
| 2020 | £296,041 | 15% |
41 Properties |
| 2019 | £250,192 | -4% |
65 Properties |
| 2018 | £260,075 | 6% |
68 Properties |
| 2017 | £243,563 | -6% |
56 Properties |
| 2016 | £257,920 | 20% |
44 Properties |
| 2015 | £205,242 | 3% |
62 Properties |
| 2014 | £198,286 | -2% |
51 Properties |
| 2013 | £202,049 | -12% |
45 Properties |
| 2012 | £226,945 | 19% |
37 Properties |
| 2011 | £182,757 | -11% |
34 Properties |
| 2010 | £202,612 | -18% |
24 Properties |
| 2009 | £238,129 | 18% |
37 Properties |
| 2008 | £194,748 | -5% |
28 Properties |
| 2007 | £203,749 | 0,3% |
63 Properties |
| 2006 | £203,139 | 15% |
72 Properties |
| 2005 | £172,132 | -12% |
74 Properties |
| 2004 | £192,794 | 19% |
62 Properties |
| 2003 | £155,586 | 25% |
65 Properties |
| 2002 | £117,094 | 15% |
63 Properties |
| 2001 | £99,746 | 6% |
63 Properties |
| 2000 | £94,096 | 22% |
54 Properties |
| 1999 | £73,580 | -11% |
72 Properties |
| 1998 | £81,544 | -0,5% |
58 Properties |
| 1997 | £81,925 | 13% |
52 Properties |
| 1996 | £70,916 | 18% |
49 Properties |
| 1995 | £57,999 | - |
55 Properties |
Property Price per Property Type in Melton Warwick
Here you can find historic sold price data in order to help with your property search.
The average Property Paid Price for specific property types in the last three years are:
| Property Type | Average Sold Price | Sold Properties |
|---|---|---|
| Semi Detached House | £229,509.00 | 50 Semi Detached Houses |
| Detached House | £416,083.00 | 67 Detached Houses |
| Terraced House | £179,222.00 | 20 Terraced Houses |
| Flat | £182,500.00 | 4 Flats |

