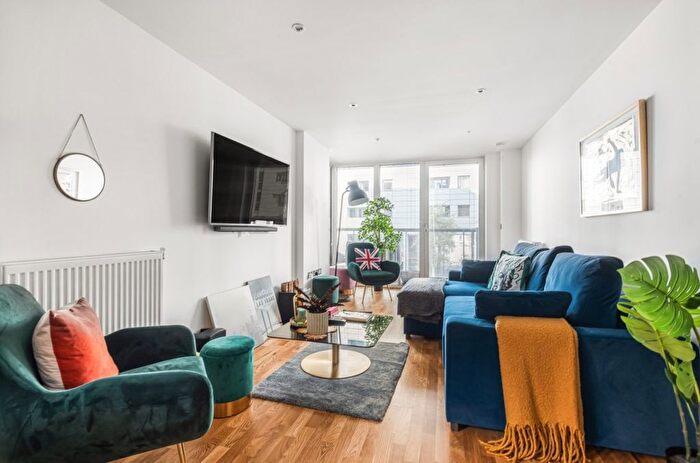
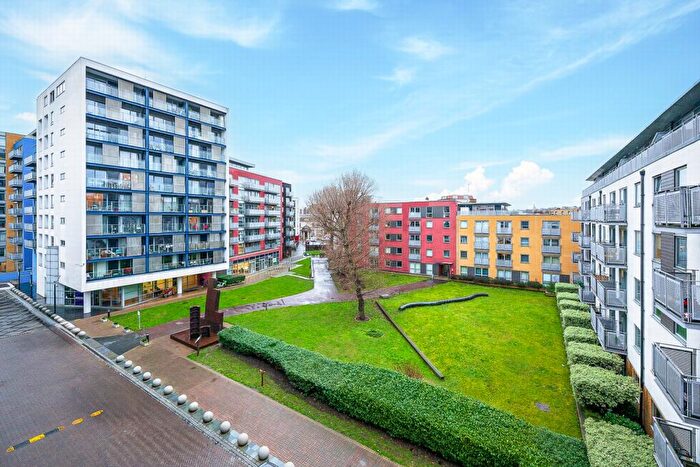
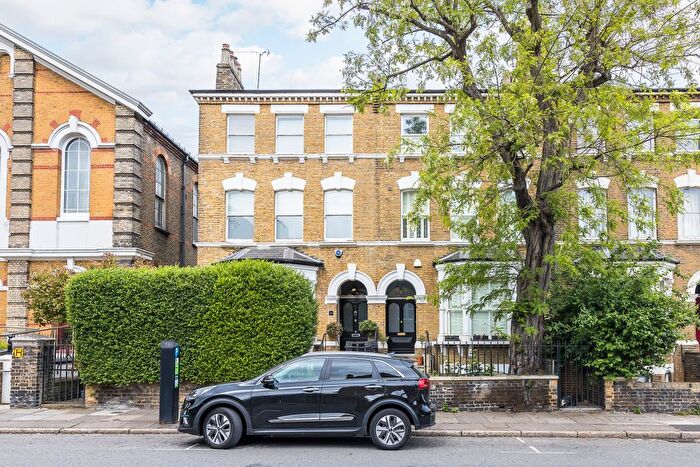
Houses for sale & to rent in Greenwich West, London
House Prices in Greenwich West
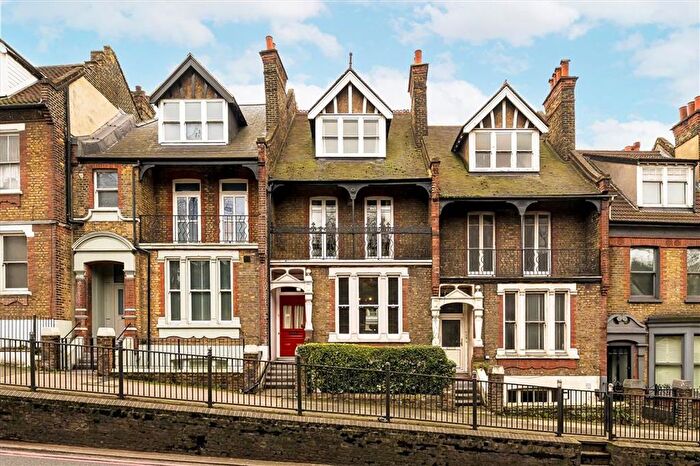
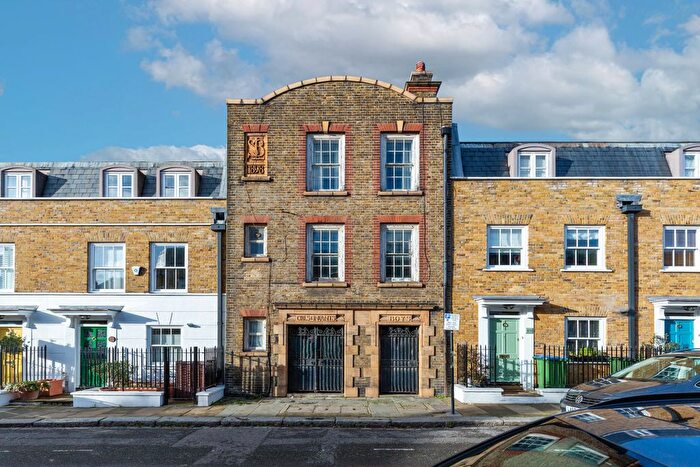
Properties in this part of Greenwich West within London have an average house price of £623,289.00 and had 861 Property Transactions within the last 3 years¹. This area has 7,046 households² , where the most expensive property was sold for £3,500,000.00.
Properties for sale in Greenwich West
Roads and Postcodes in Greenwich West
Navigate through our locations to find the location of your next house in Greenwich West, London for sale or to rent.
Transport near Greenwich West
-
Greenwich Station
-
Cutty Sark for Maritime Greenwich Station
-
Deptford Bridge Station
-
Deptford Station
-
Elverson Road Station
-
St.John's Station
-
Island Gardens Station
-
St Johns Station
-
New Cross Station
-
Maze Hill Station
- FAQ
- Price Paid By Year
- Property Type Price
Frequently asked questions about Greenwich West
What is the average price for a property for sale in Greenwich West?
The average price for a property for sale in Greenwich West is £623,289. This amount is 24% higher than the average price in London. There are 5,096 property listings for sale in Greenwich West.
What streets have the most expensive properties for sale in Greenwich West?
The streets with the most expensive properties for sale in Greenwich West are Gloucester Circus at an average of £1,586,638, Hyde Vale at an average of £1,296,470 and West Grove Lane at an average of £1,293,750.
What streets have the most affordable properties for sale in Greenwich West?
The streets with the most affordable properties for sale in Greenwich West are Norway Street at an average of £205,208, Merryweather Place at an average of £225,000 and Coldbath Street at an average of £312,333.
Which train stations are available in or near Greenwich West?
Some of the train stations available in or near Greenwich West are Greenwich, Deptford and St.John's.
Property Price Paid in Greenwich West by Year
The average sold property price by year was:
| Year | Average Sold Price | Price Change |
Sold Properties
|
|---|---|---|---|
| 2025 | £579,310 | -5% |
167 Properties |
| 2024 | £606,912 | -11% |
246 Properties |
| 2023 | £673,316 | 6% |
182 Properties |
| 2022 | £631,817 | -2% |
266 Properties |
| 2021 | £641,740 | -8% |
335 Properties |
| 2020 | £693,638 | 17% |
186 Properties |
| 2019 | £577,996 | 0,3% |
330 Properties |
| 2018 | £576,045 | 2% |
259 Properties |
| 2017 | £565,167 | 1% |
362 Properties |
| 2016 | £561,212 | -1% |
286 Properties |
| 2015 | £565,948 | 14% |
426 Properties |
| 2014 | £485,476 | 4% |
936 Properties |
| 2013 | £465,228 | 15% |
638 Properties |
| 2012 | £396,819 | 0,5% |
401 Properties |
| 2011 | £394,903 | -3% |
399 Properties |
| 2010 | £407,194 | 5% |
235 Properties |
| 2009 | £386,030 | 9% |
195 Properties |
| 2008 | £350,970 | -10% |
254 Properties |
| 2007 | £386,837 | 7% |
412 Properties |
| 2006 | £361,515 | 7% |
392 Properties |
| 2005 | £335,137 | 11% |
251 Properties |
| 2004 | £296,722 | 6% |
350 Properties |
| 2003 | £280,007 | 3% |
336 Properties |
| 2002 | £271,612 | 8% |
486 Properties |
| 2001 | £249,920 | 6% |
390 Properties |
| 2000 | £233,704 | 20% |
277 Properties |
| 1999 | £186,418 | 22% |
442 Properties |
| 1998 | £145,816 | -9% |
190 Properties |
| 1997 | £158,397 | 23% |
211 Properties |
| 1996 | £121,505 | 10% |
219 Properties |
| 1995 | £109,864 | - |
179 Properties |
Property Price per Property Type in Greenwich West
Here you can find historic sold price data in order to help with your property search.
The average Property Paid Price for specific property types in the last three years are:
| Property Type | Average Sold Price | Sold Properties |
|---|---|---|
| Semi Detached House | £1,111,275.00 | 20 Semi Detached Houses |
| Terraced House | £993,814.00 | 207 Terraced Houses |
| Flat | £464,922.00 | 621 Flats |
| Detached House | £1,537,692.00 | 13 Detached Houses |

