
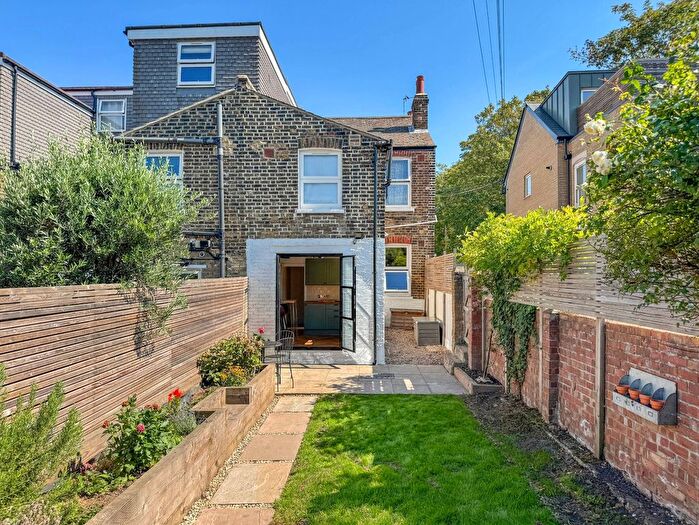
Houses for sale & to rent in SE23 1QA, Brockley Rise, Crofton Park, London
House Prices in SE23 1QA, Brockley Rise, Crofton Park
Properties in SE23 1QA have no sales history available within the last 3 years. SE23 1QA is a postcode in Brockley Rise located in Crofton Park, an area in London, Lewisham London Borough, with 3 households².
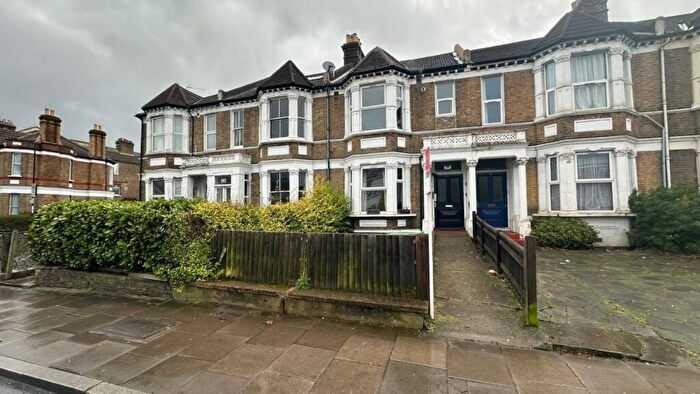
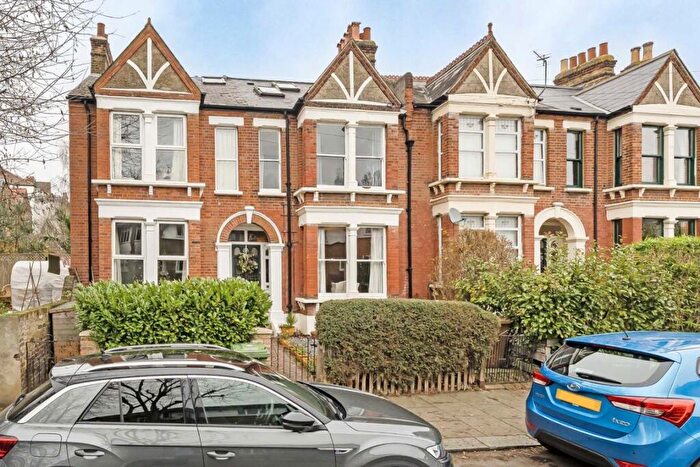
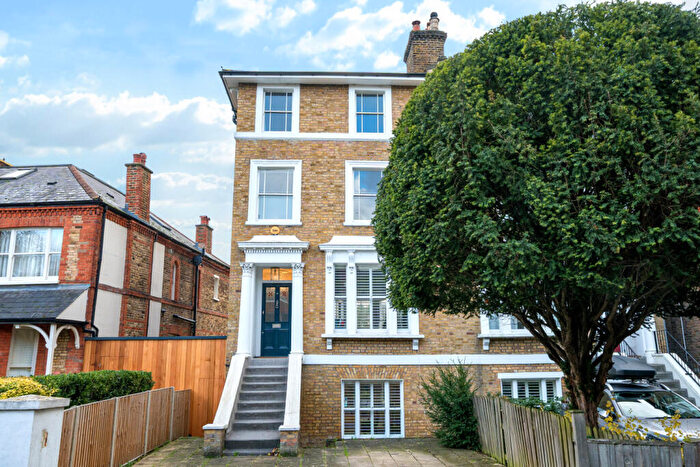
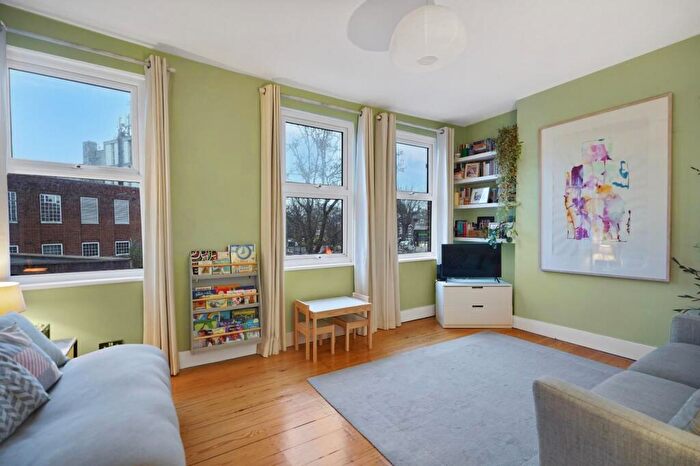
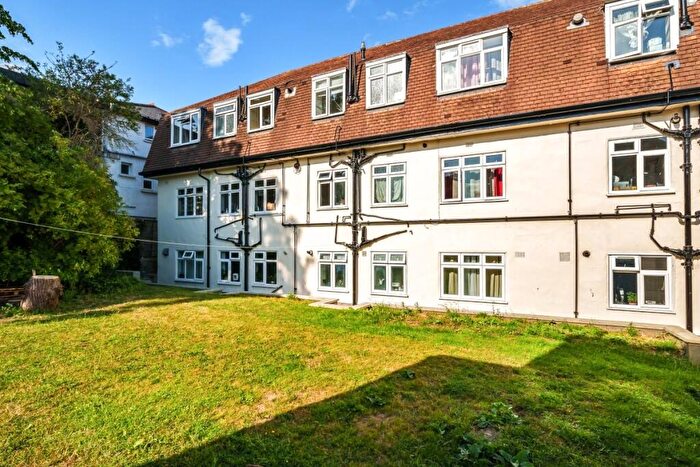
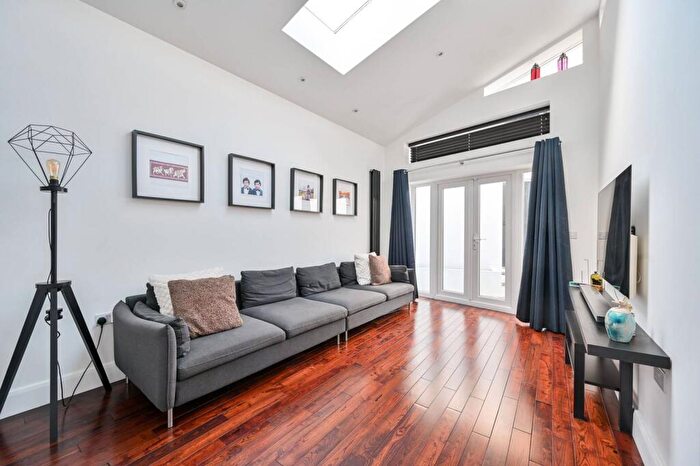
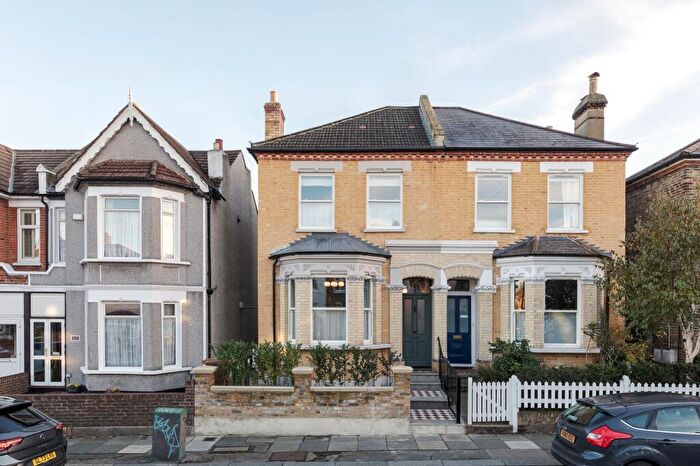
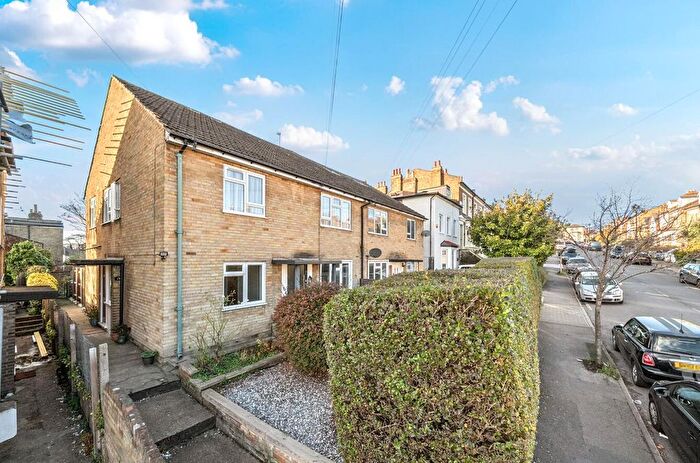
Properties for sale near SE23 1QA, Brockley Rise

![]()
If you are looking to sell your house, let it out, or receive a property valuation, an expert can help you.
Click the button below to get started.


Price Paid in Brockley Rise, SE23 1QA, Crofton Park
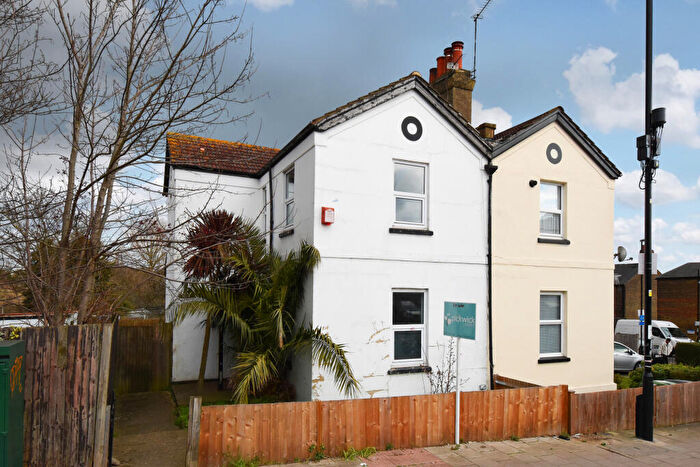
38 Brockley Rise, SE23 1QA, Crofton Park London
Property 38 has been sold 1 time. The last time it was sold was in 15/06/2018 and the sold price was £670,000.00.
This flat, sold as a freehold on 15/06/2018, is a 61 sqm ground-floor flat with an EPC rating of E.
| Date | Price | Property Type | Tenure | Classification |
|---|---|---|---|---|
| 15/06/2018 | £670,000.00 | Flat | freehold | Established Building |
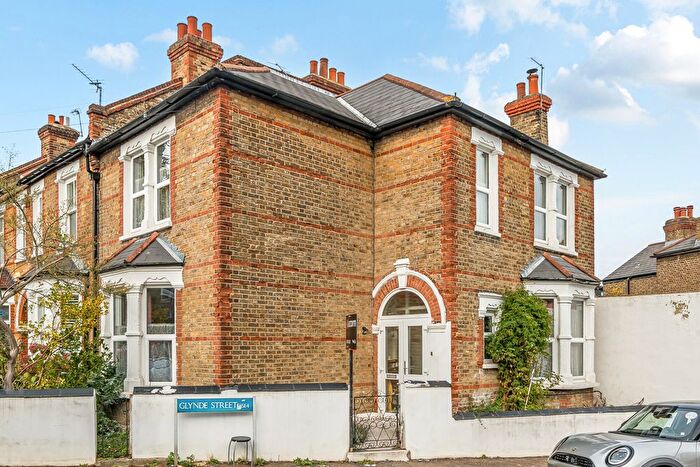
40 Brockley Rise, SE23 1QA, Crofton Park London
Property 40 has been sold 3 times. The last time it was sold was in 07/10/2005 and the sold price was £238,000.00.
This is a Semi Detached House which was sold as a freehold in 07/10/2005
| Date | Price | Property Type | Tenure | Classification |
|---|---|---|---|---|
| 07/10/2005 | £238,000.00 | Semi Detached House | freehold | Established Building |
| 20/09/2002 | £190,000.00 | Semi Detached House | freehold | Established Building |
| 24/10/1995 | £68,000.00 | Semi Detached House | freehold | New Build |
Postcodes in Brockley Rise, Crofton Park
Navigate through other locations in Brockley Rise, Crofton Park, London to see more property listings for sale or to rent.
Transport near SE23 1QA, Brockley Rise
-

 Honor Oak Park Station
 -
Forest Hill Station
-
Crofton Park Station
-
Catford Station
-
Catford Bridge Station
-
Ladywell Station
-
Bellingham Station
-
Brockley Station
-
Sydenham Station
-
Nunhead Station
House price paid reports for SE23 1QA, Brockley Rise
Click on the buttons below to see price paid reports by year or property price:
- Price Paid By Year
Property Price Paid in SE23 1QA, Brockley Rise by Year
The average sold property price by year was:
| Year | Average Sold Price | Price Change |
Sold Properties
|
|---|---|---|---|
| 2018 | £670,000 | 64% |
1 Property |
| 2005 | £238,000 | 20% |
1 Property |
| 2002 | £190,000 | 64% |
1 Property |
| 1995 | £68,000 | - |
1 Property |