Houses for sale & to rent in Sibsey, Boston
House Prices in Sibsey
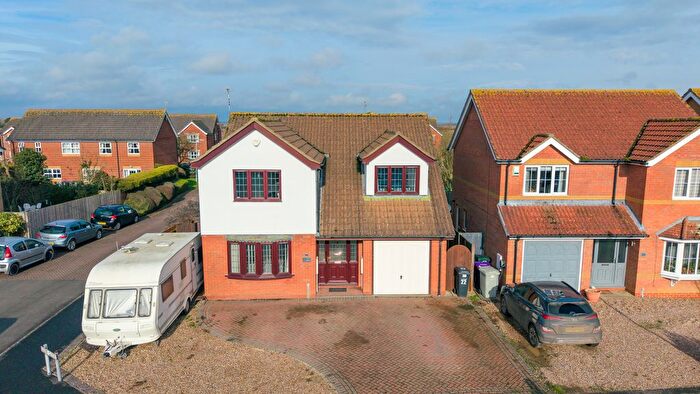
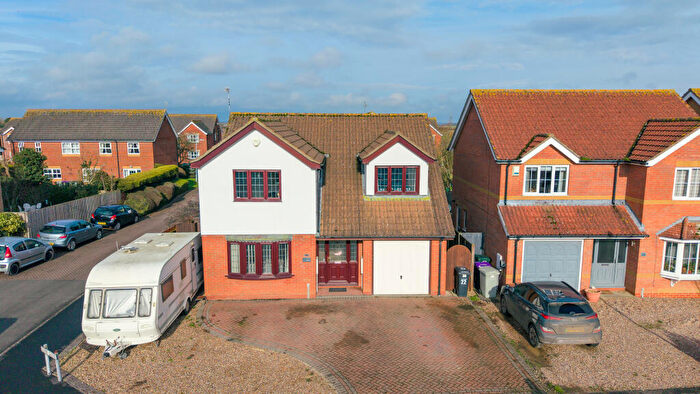
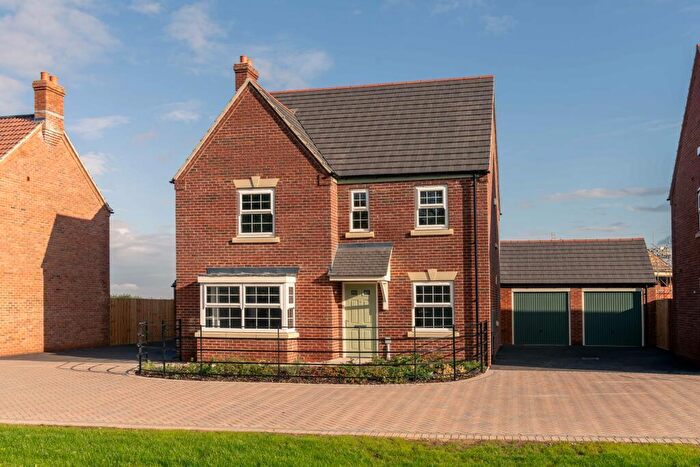
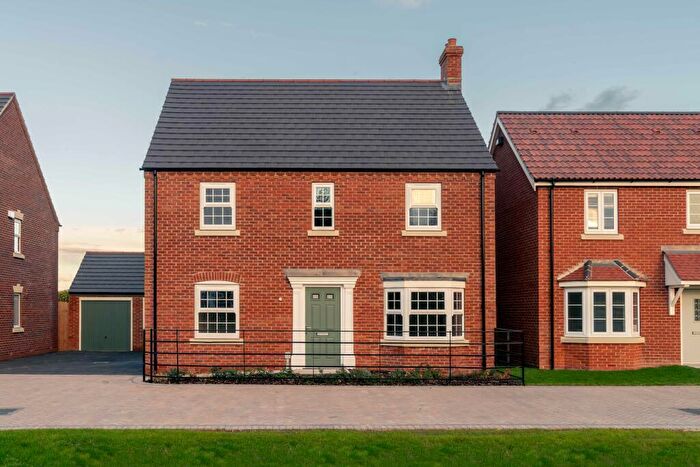
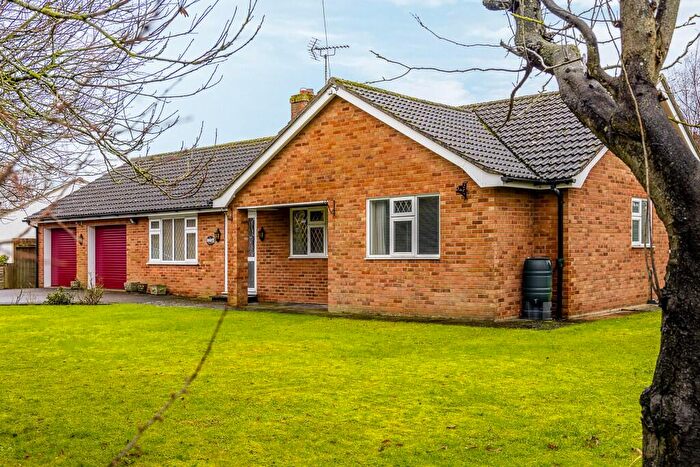
Properties in Sibsey have an average house price of £258,390.00 and had 89 Property Transactions within the last 3 years¹.
Sibsey is an area in Boston, Lincolnshire with 827 households², where the most expensive property was sold for £775,000.00.
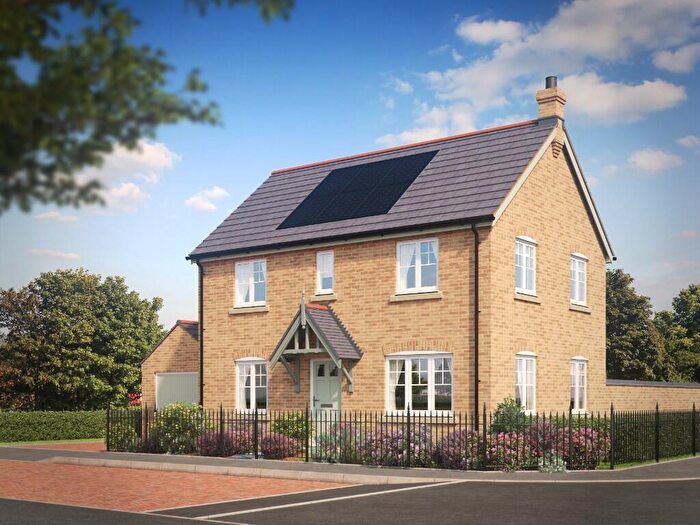
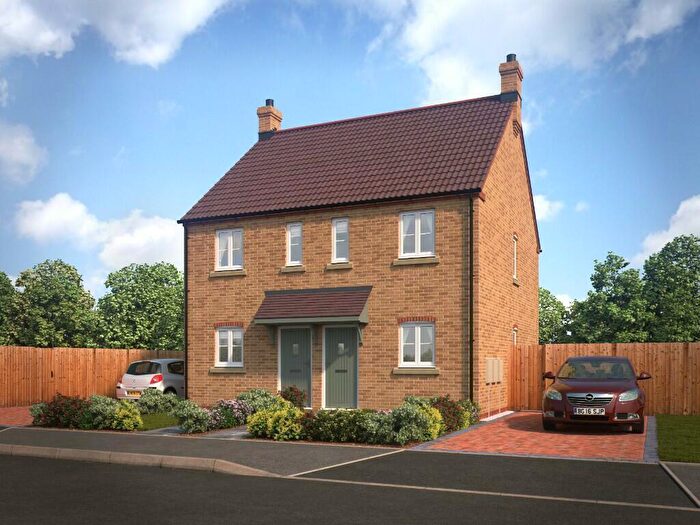
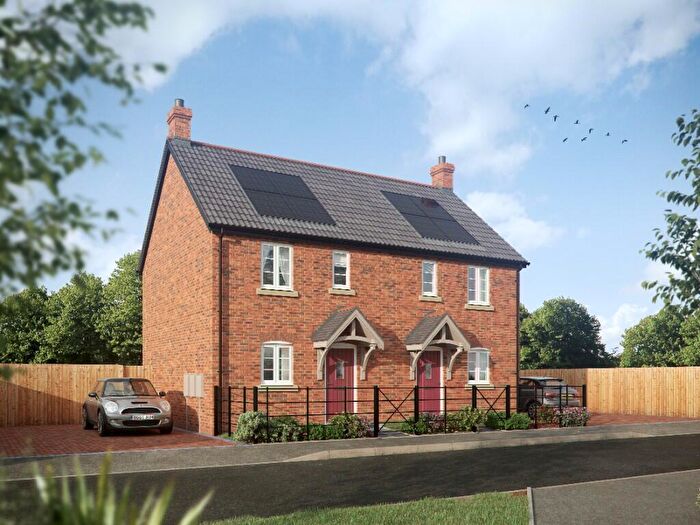
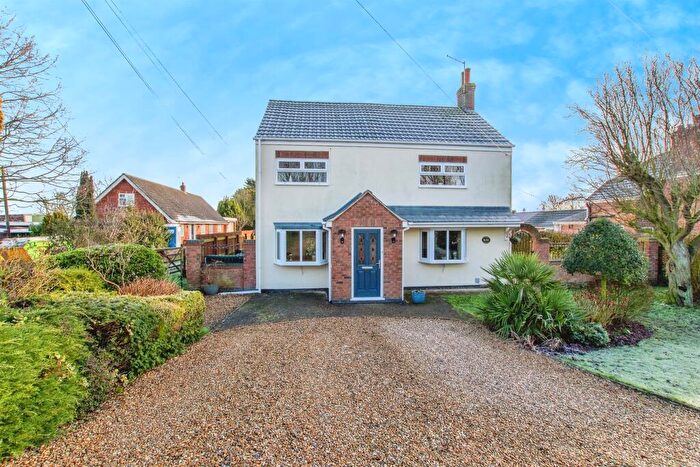
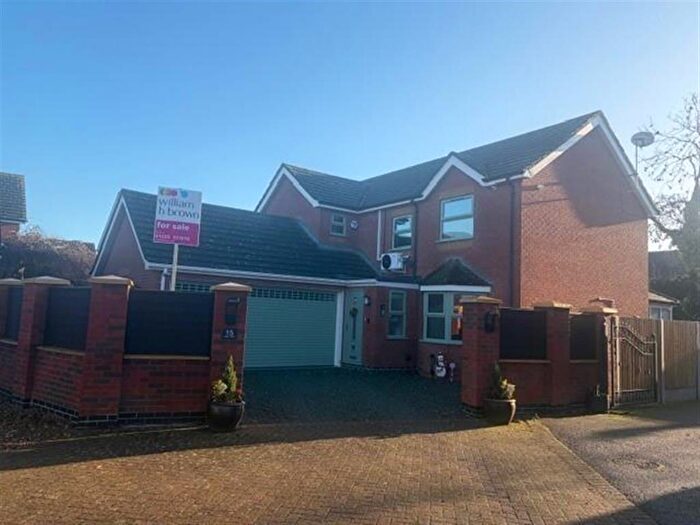
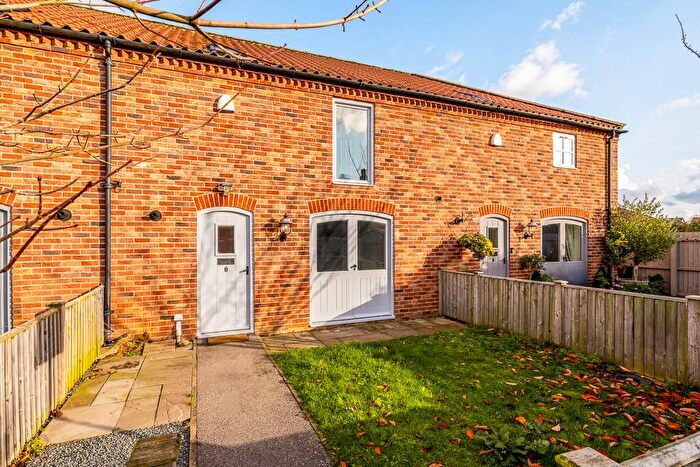
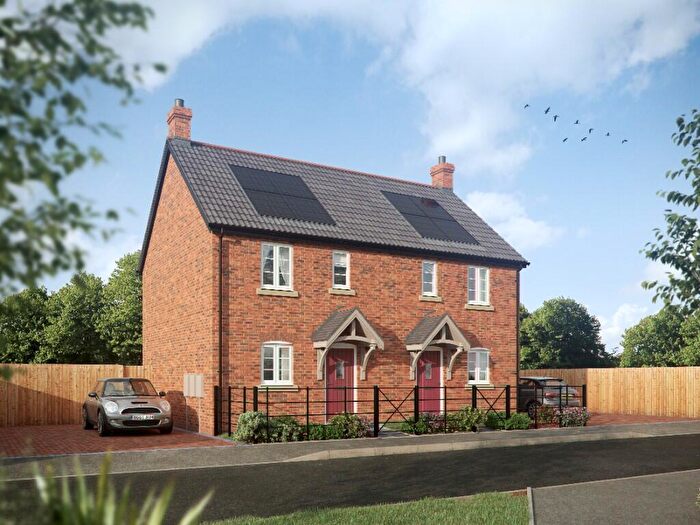
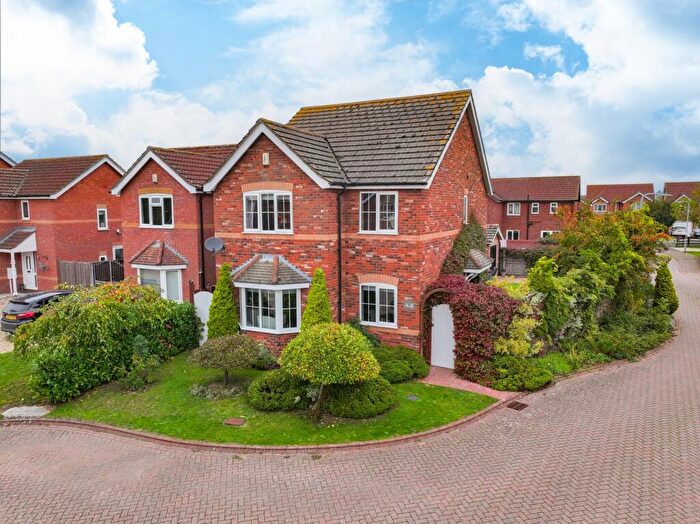
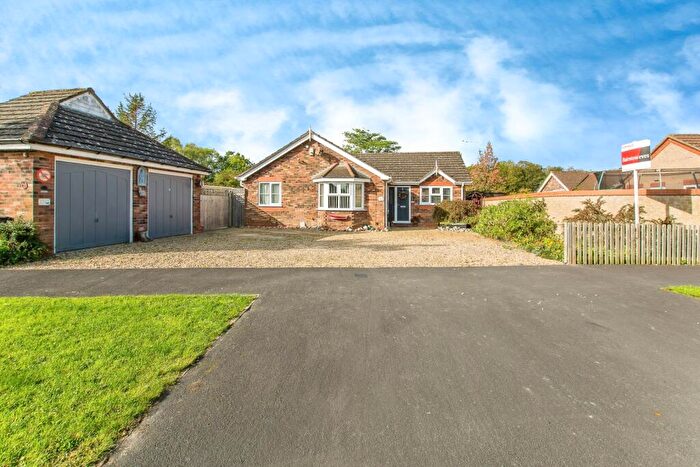
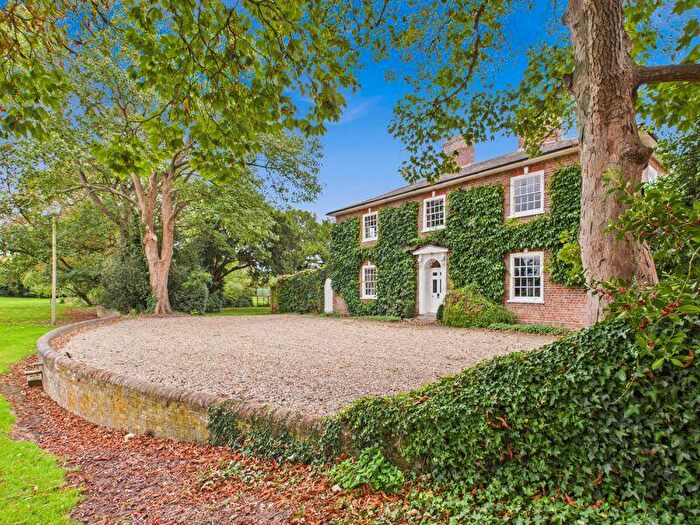
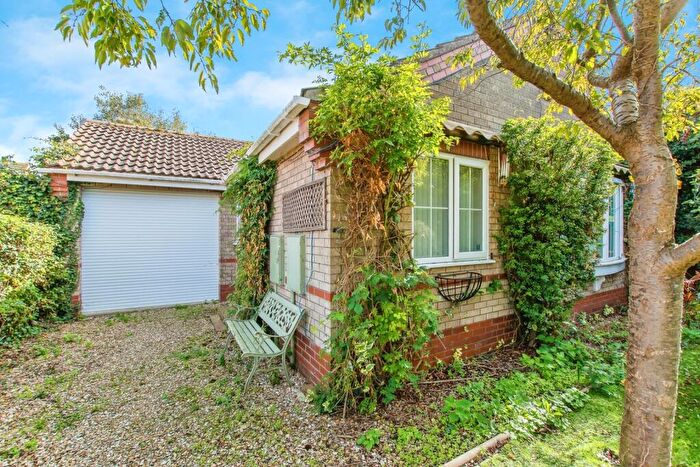
Properties for sale in Sibsey
Roads and Postcodes in Sibsey
Navigate through our locations to find the location of your next house in Sibsey, Boston for sale or to rent.
| Streets | Postcodes |
|---|---|
| Amos Way | PE22 0SD PE22 0SU |
| Besant Close | PE22 0RP |
| Boston Road | PE22 0SJ PE22 0TB PE22 0TD |
| Chapel Lane | PE22 0SN |
| Church Close | PE22 0RN |
| Church Lane | PE22 0RZ |
| Church Terrace | PE22 0RY |
| Church Walk | PE22 0YA PE22 0YB |
| Evison Court | PE22 0RF |
| Fenside | PE22 0UQ |
| Frithville Road | PE22 0SP PE22 0SR PE22 0SY |
| Glebe Close | PE22 0RW |
| Goosemuck Lane | PE22 0UL |
| Grange Meadows | PE22 0SX |
| Harvester Way | PE22 0YD |
| High Ferry Lane | PE22 0TA |
| Littlemoor Lane | PE22 0TU |
| Littleport Lane | PE22 0RS |
| Lucan Close | PE22 0SH |
| Main Road | PE22 0RR PE22 0RX PE22 0TN PE22 0TT PE22 0TW PE22 0TY PE22 0TZ |
| Mallows Lane | PE22 0SG PE22 0TS |
| Manor Close | PE22 0SL |
| Meyers Close | PE22 0TJ |
| Millers Gate | PE22 0TP |
| Northlands | PE22 0UA PE22 0UG |
| Northlands Lane | PE22 0UD |
| Pymoor Lane | PE22 0TR |
| Sargeants Close | PE22 0RU |
| St Margarets Drive | PE22 0ST |
| Station Road | PE22 0SA PE22 0SB PE22 0SE PE22 0SQ |
| Thatchers Walk | PE22 0YG |
| Trader Bank | PE22 0UH |
| Vicarage Lane | PE22 0RT |
| Waggoners Walk | PE22 0YF |
| Wesley Terrace | PE22 0SF |
| Wheatsheaf Close | PE22 0YE |
| Willows Lane | PE22 0TG |
Transport near Sibsey
- FAQ
- Price Paid By Year
- Property Type Price
Frequently asked questions about Sibsey
What is the average price for a property for sale in Sibsey?
The average price for a property for sale in Sibsey is £258,390. This amount is 19% higher than the average price in Boston. There are 304 property listings for sale in Sibsey.
What streets have the most expensive properties for sale in Sibsey?
The streets with the most expensive properties for sale in Sibsey are Millers Gate at an average of £359,000, Main Road at an average of £341,287 and Northlands Lane at an average of £312,166.
What streets have the most affordable properties for sale in Sibsey?
The streets with the most affordable properties for sale in Sibsey are Frithville Road at an average of £201,700, Chapel Lane at an average of £210,491 and Station Road at an average of £211,250.
Which train stations are available in or near Sibsey?
Some of the train stations available in or near Sibsey are Boston, Hubberts Bridge and Thorpe Culvert.
Property Price Paid in Sibsey by Year
The average sold property price by year was:
| Year | Average Sold Price | Price Change |
Sold Properties
|
|---|---|---|---|
| 2025 | £282,458 | 15% |
24 Properties |
| 2024 | £240,239 | -7% |
29 Properties |
| 2023 | £256,967 | -18% |
36 Properties |
| 2022 | £303,654 | 21% |
32 Properties |
| 2021 | £240,536 | 11% |
38 Properties |
| 2020 | £214,213 | 11% |
26 Properties |
| 2019 | £191,640 | -32% |
35 Properties |
| 2018 | £252,048 | 21% |
29 Properties |
| 2017 | £198,287 | 3% |
31 Properties |
| 2016 | £192,955 | 2% |
36 Properties |
| 2015 | £189,040 | 8% |
32 Properties |
| 2014 | £173,498 | 1% |
36 Properties |
| 2013 | £171,120 | 10% |
34 Properties |
| 2012 | £153,347 | -3% |
35 Properties |
| 2011 | £158,379 | -16% |
24 Properties |
| 2010 | £183,870 | 13% |
34 Properties |
| 2009 | £159,391 | -25% |
29 Properties |
| 2008 | £199,713 | - |
15 Properties |
| 2007 | £199,769 | 14% |
42 Properties |
| 2006 | £170,857 | 3% |
52 Properties |
| 2005 | £165,368 | 5% |
33 Properties |
| 2004 | £157,010 | 5% |
34 Properties |
| 2003 | £148,997 | 25% |
35 Properties |
| 2002 | £111,396 | 23% |
67 Properties |
| 2001 | £85,957 | 1% |
72 Properties |
| 2000 | £85,481 | 14% |
69 Properties |
| 1999 | £73,646 | 16% |
67 Properties |
| 1998 | £62,015 | -10% |
74 Properties |
| 1997 | £68,232 | 11% |
63 Properties |
| 1996 | £60,480 | - |
54 Properties |
| 1995 | £60,462 | - |
31 Properties |
Property Price per Property Type in Sibsey
Here you can find historic sold price data in order to help with your property search.
The average Property Paid Price for specific property types in the last three years are:
| Property Type | Average Sold Price | Sold Properties |
|---|---|---|
| Semi Detached House | £180,625.00 | 12 Semi Detached Houses |
| Detached House | £277,784.00 | 73 Detached Houses |
| Terraced House | £137,750.00 | 4 Terraced Houses |

