
Houses for sale in Boston, Lincolnshire
House Prices in Boston
Properties in Boston have an average house price of £216k and had 3,050 Property Transactions within the last 3 years.¹
Boston is an area in Lincolnshire with 33,310 households², where the most expensive property was sold for £11.82M.
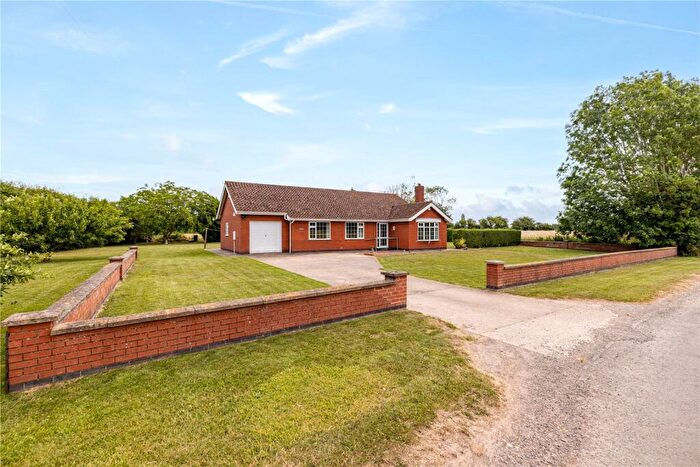
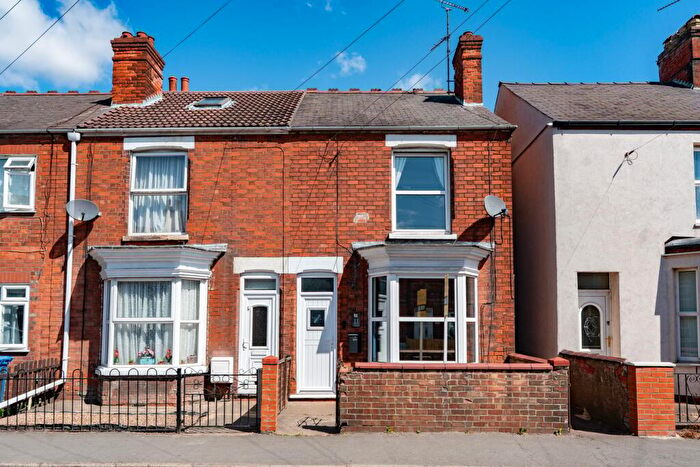
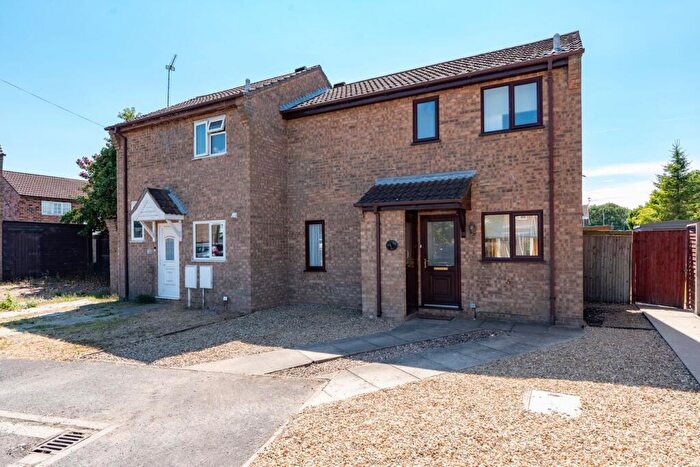
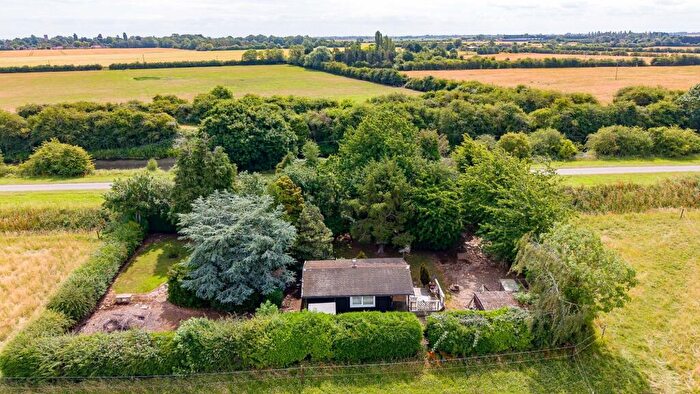
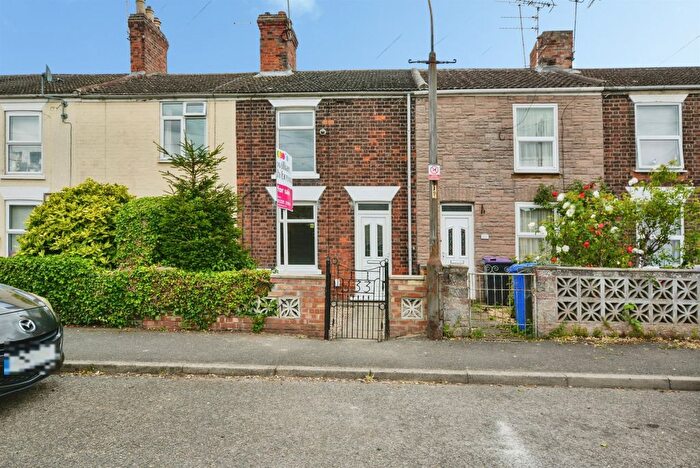
Properties for sale in Boston
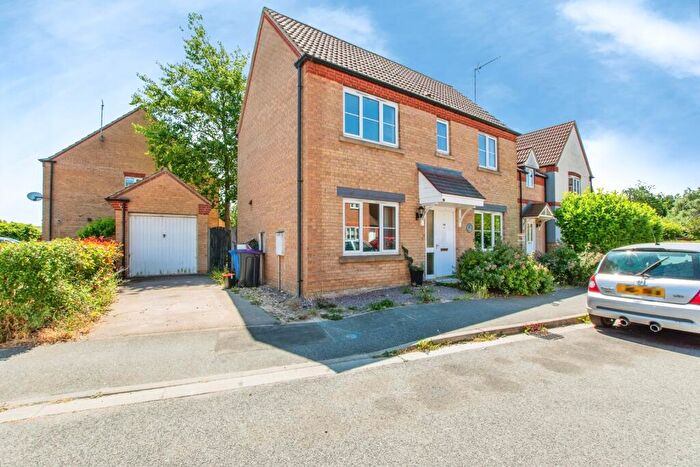
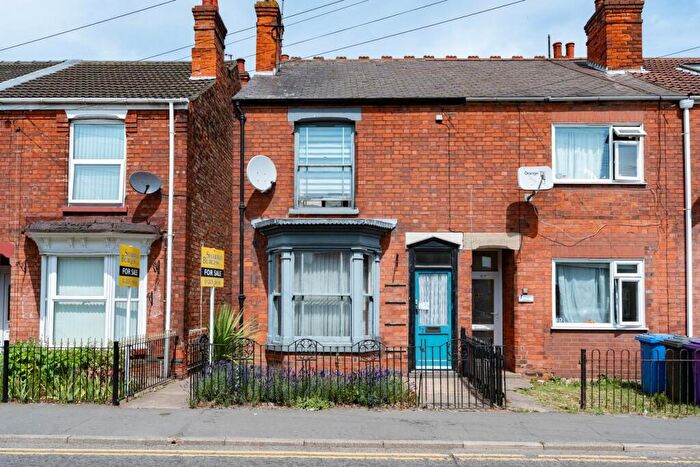
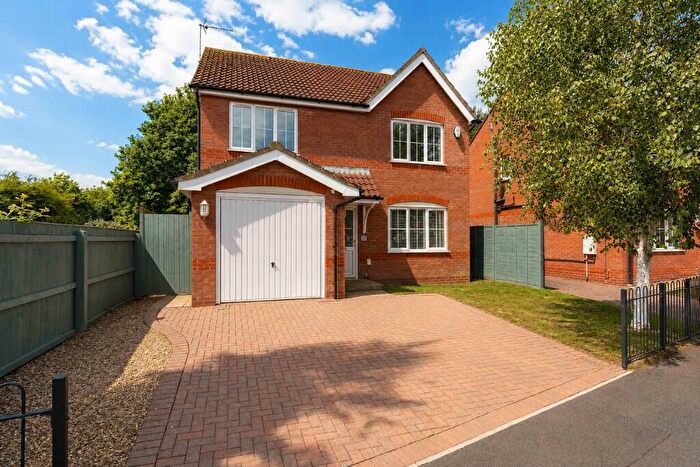
![]()
If you are looking to sell your house, let it out, or receive a property valuation, an expert can help you.
Click the button below to get started.

Neighbourhoods in Boston
Navigate through our locations to find the location of your next house in Boston, Lincolnshire for sale or to rent.
- Central
- Coastal
- Coningsby And Tattershall
- Fenside
- Fishtoft
- Five Village
- Frampton And Holme
- Frithville
- Heckington Rural
- Kirton
- Mareham Le Fen
- North
- Old Leake And Wrangle
- Pilgrim
- Sibsey
- Skirbeck
- South
- Staniland North
- Staniland South
- Stickney
- Swineshead And Holland Fen
- Wainfleet And Friskney
- West
- Witham
- Wyberton
- Kirton and Frampton
- Station
- St Thomas'
- Staniland
- Sibsey & Stickney
- Coningsby & Mareham
- Friskney
Property price trends in Boston
According to the latest Land Registry data, the average home in Boston sold for £201,764 in 2026. That figure comes from a substantial record of 41,059 sales logged over the past 31 years.
Prices have softened over the last three years. Compared with 2023, when the typical sale came in around £212,927, that's a fall of roughly 5.2%.
Looking back five years, average prices are down about 0.3% since 2021, a drop of around £584 in cash terms.
Zoom out to the past decade for the fuller picture. Back in 2016, homes here averaged £154,027, so the typical sold price has climbed about 31% since then, roughly 2.7% a year. Stretch the view to fifteen years and that annual pace holds at about 2.9%.
Frequently asked questions about Boston
What is the average price for a property for sale in Boston?
The average price for a property for sale in Boston is £215,622. This amount is 12% lower than the average price in Lincolnshire. There are more than 10,000 property listings for sale in Boston.
What locations have the most expensive properties for sale in Boston?
The locations with the most expensive properties for sale in Boston are Friskney at an average of £11,821,327, Frampton And Holme at an average of £309,545 and Sibsey & Stickney at an average of £293,142.
What locations have the most affordable properties for sale in Boston?
The locations with the most affordable properties for sale in Boston are Central at an average of £124,916, Pilgrim at an average of £138,126 and Staniland North at an average of £143,968.
Which train stations are available in or near Boston?
Some of the train stations available in or near Boston are Boston, Hubberts Bridge and Swineshead.
Property Price Paid in Boston by Year
The average sold property price by year was:
| Year | Average Sold Price | Price Change |
Sold Properties
|
|---|---|---|---|
| 2026 | £201,764 | -13% |
71 Properties |
| 2025 | £227,597 | 8% |
921 Properties |
| 2024 | £208,620 | -2% |
1,045 Properties |
| 2023 | £212,927 | -1% |
1,013 Properties |
| 2022 | £215,362 | 6% |
1,243 Properties |
| 2021 | £202,348 | 10% |
1,700 Properties |
| 2020 | £182,905 | 1% |
1,068 Properties |
| 2019 | £181,837 | 6% |
1,244 Properties |
| 2018 | £171,296 | 4% |
1,347 Properties |
| 2017 | £164,857 | 7% |
1,312 Properties |
Property Price per Property Type in Boston
Here you can find historic sold price data in order to help with your property search.
The average Property Paid Price for specific property types in the last three years are:
| Property Type | Average Sold Price | Sold Properties |
|---|---|---|
| Semi Detached House | £168,401.00 | 731 Semi Detached Houses |
| Terraced House | £128,785.00 | 573 Terraced Houses |
| Detached House | £274,509.00 | 1,646 Detached Houses |
| Flat | £89,083.00 | 100 Flats |
Transport in Boston
Please see below transportation links in this area:
