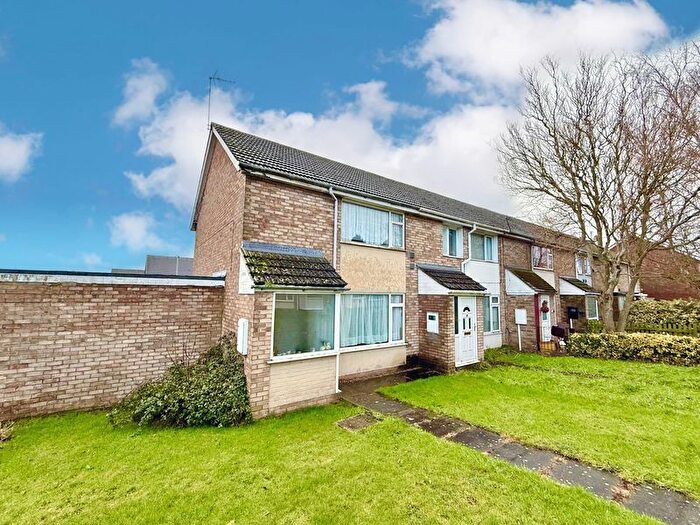
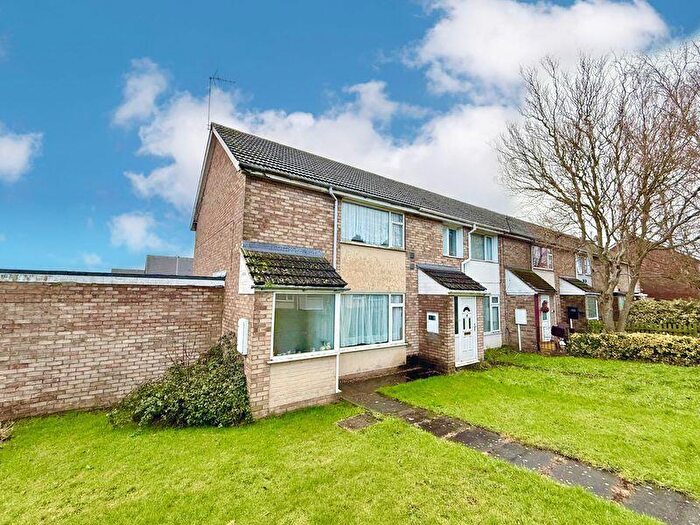
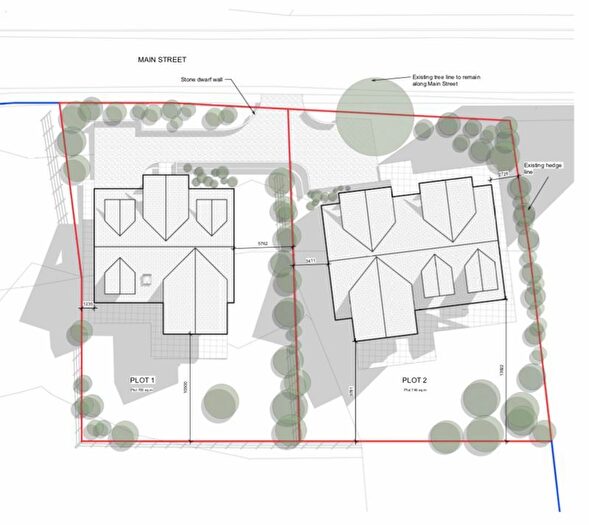
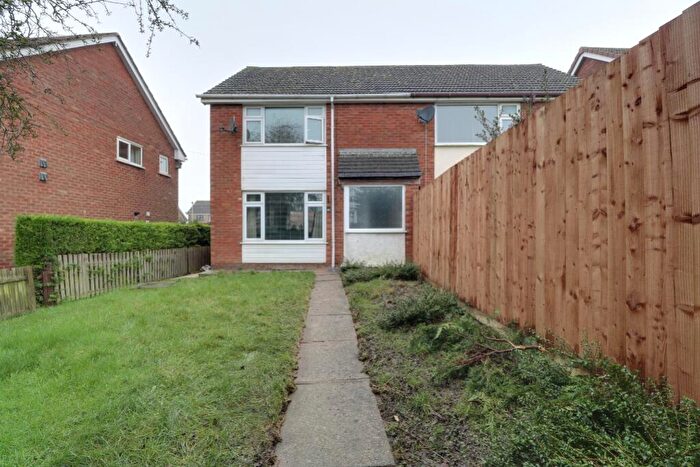
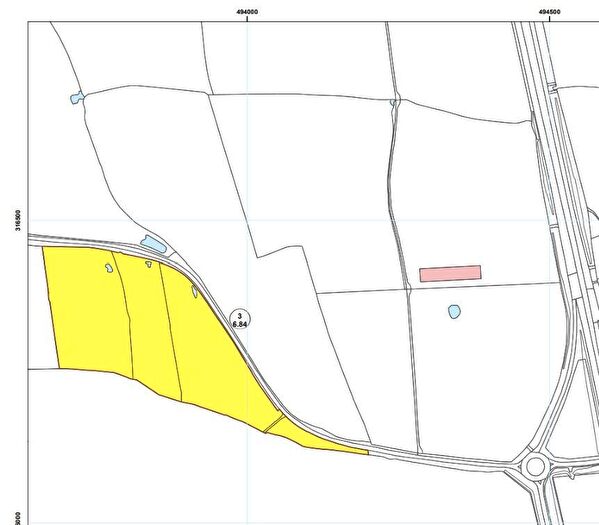
Houses for sale & to rent in Morkery, Grantham
House Prices in Morkery
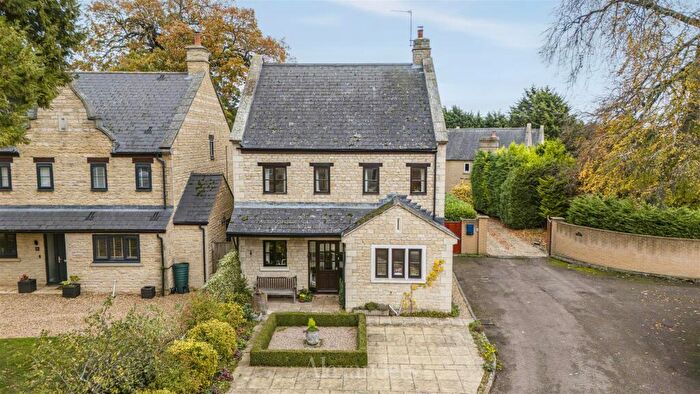
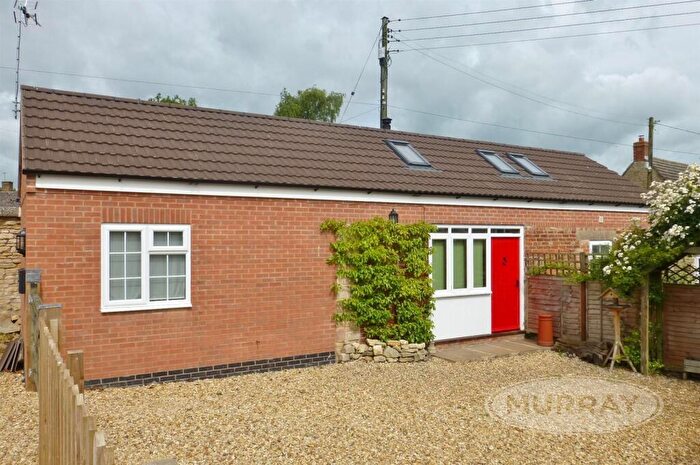
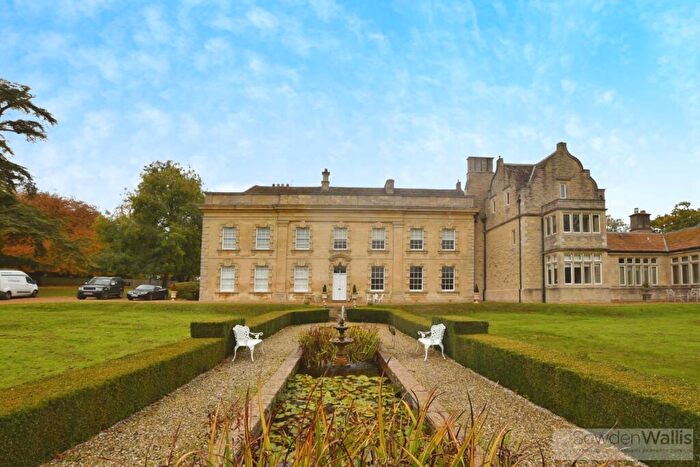
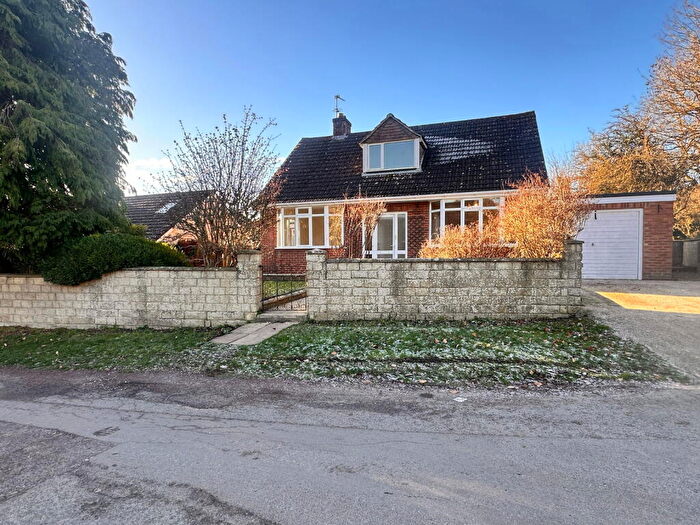
Properties in Morkery have an average house price of £280,655.00 and had 126 Property Transactions within the last 3 years¹.
Morkery is an area in Grantham, Lincolnshire with 997 households², where the most expensive property was sold for £1,100,000.00.
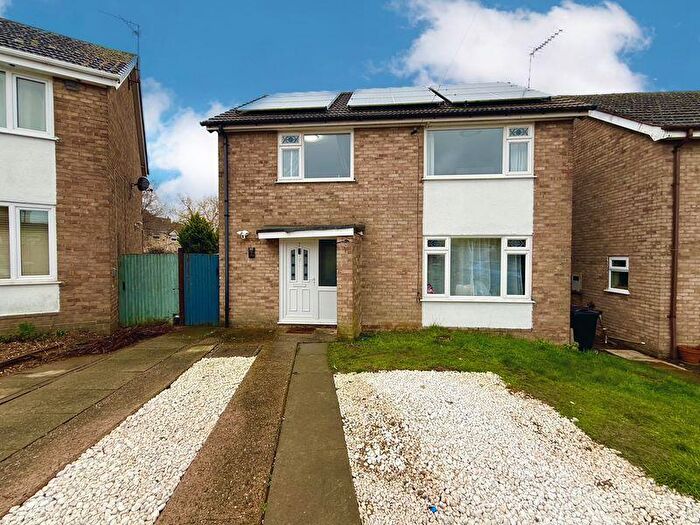
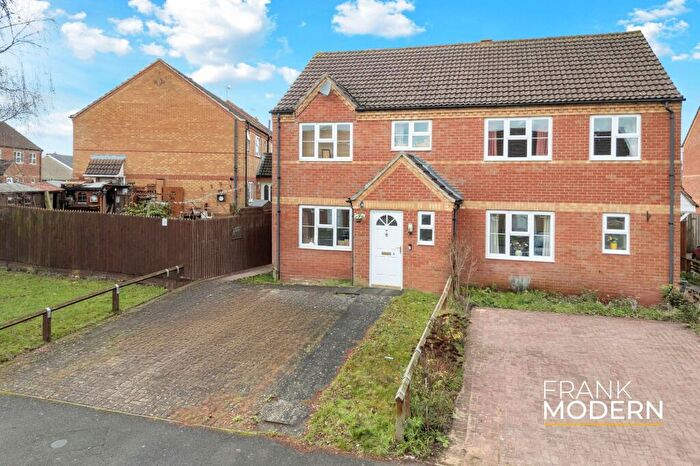
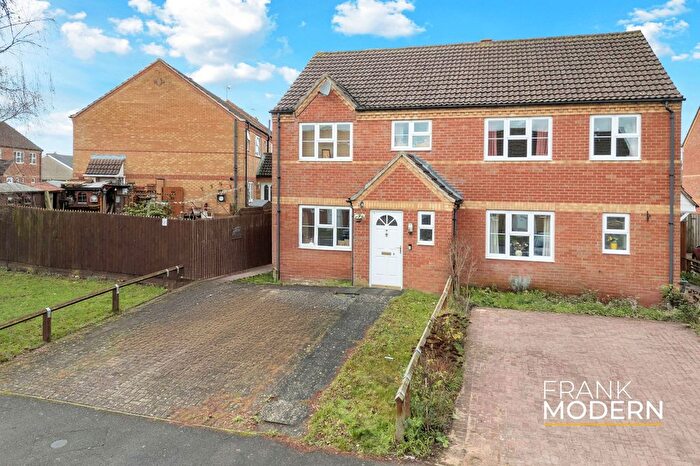
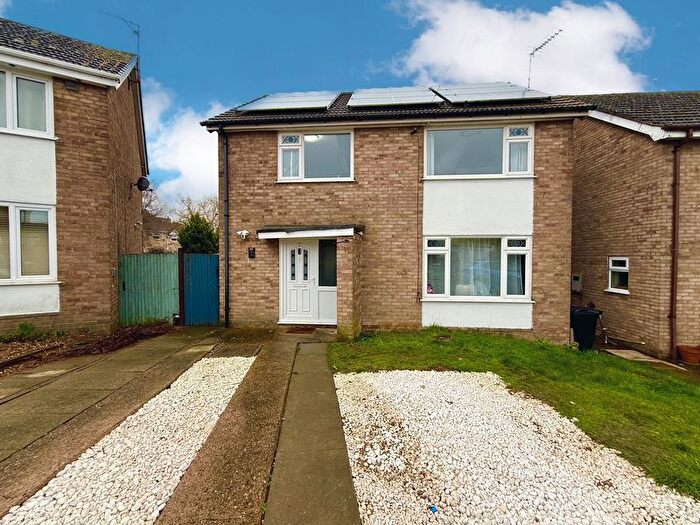
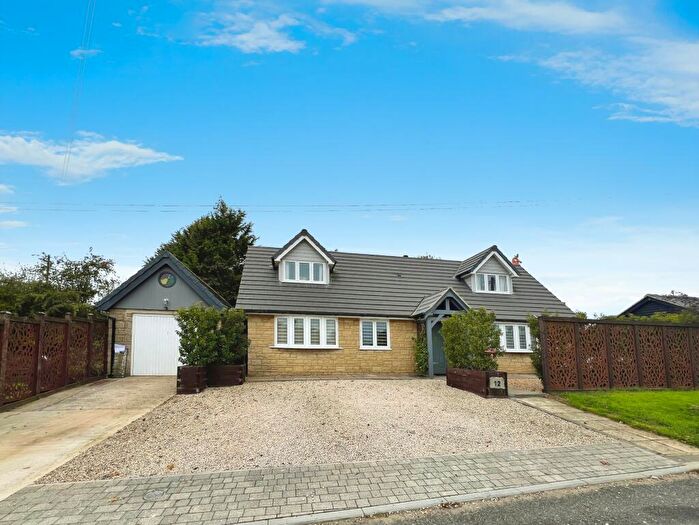
Properties for sale in Morkery
Roads and Postcodes in Morkery
Navigate through our locations to find the location of your next house in Morkery, Grantham for sale or to rent.
| Streets | Postcodes |
|---|---|
| Bytham Heights | NG33 4ST |
| Castle Gate | NG33 4RQ NG33 4RU |
| Church Lane | NG33 5PL |
| Church Street | NG33 5LH NG33 5PJ |
| Clipsham Road | NG33 4SE |
| Counthorpe Lane | NG33 4RF |
| Coverley Road | NG33 5SP |
| Cumberland Gardens | NG33 4SQ |
| Glen Road | NG33 4RJ |
| Glenside | NG33 4SS |
| Great Close | NG33 5QH NG33 5QJ |
| Halford Close | NG33 5SL |
| Harold Road | NG33 5AF |
| Harrington Road | NG33 5SJ |
| Heathcote Road | NG33 4SA |
| High Street | NG33 4RZ NG33 5QB |
| Hillview Road | NG33 5QW |
| Holywell Road | NG33 4SD NG33 4SL |
| Launds Green | NG33 5PX |
| Mill Lane | NG33 5QN |
| Moor Lane | NG33 5PP NG33 5PW |
| Morkery Lane | NG33 4SR |
| North Witham Road | NG33 5PN |
| Northerns Close | NG33 5JY |
| Pendleton Close | NG33 5LP |
| Pinfold Road | NG33 4RG NG33 4RY |
| Post Lane | NG33 5JZ |
| Priory Court | NG33 5PQ |
| Railway Close | NG33 5QG |
| Rectory Lane | NG33 5LQ |
| Regal Gardens | NG33 4SF |
| Rutland Close | NG33 5QA |
| St Martins | NG33 4RH |
| Station Avenue | NG33 5QF |
| Station Road | NG33 4SB NG33 4SJ |
| Templars Way | NG33 5PS NG33 5PT |
| The Parkside | NG33 5RA |
| Thistleton Lane | NG33 5QE |
| Tollemache Fields | NG33 5RR |
| Troughton Walk | NG33 5PR |
| Unwin Green | NG33 5PY |
| Water Lane | NG33 4RT NG33 5LJ NG33 5PH |
| Wellfield Close | NG33 5SN |
| Wimberley Way | NG33 5PU |
| NG33 4RW |
Transport near Morkery
- FAQ
- Price Paid By Year
- Property Type Price
Frequently asked questions about Morkery
What is the average price for a property for sale in Morkery?
The average price for a property for sale in Morkery is £280,655. This amount is 11% higher than the average price in Grantham. There are 511 property listings for sale in Morkery.
What streets have the most expensive properties for sale in Morkery?
The streets with the most expensive properties for sale in Morkery are Castle Gate at an average of £693,750, Holywell Road at an average of £667,500 and Station Road at an average of £649,285.
What streets have the most affordable properties for sale in Morkery?
The streets with the most affordable properties for sale in Morkery are Northerns Close at an average of £130,000, Unwin Green at an average of £133,666 and Wimberley Way at an average of £149,016.
Which train stations are available in or near Morkery?
Some of the train stations available in or near Morkery are Oakham, Stamford and Grantham.
Property Price Paid in Morkery by Year
The average sold property price by year was:
| Year | Average Sold Price | Price Change |
Sold Properties
|
|---|---|---|---|
| 2025 | £269,323 | -9% |
40 Properties |
| 2024 | £292,217 | 5% |
47 Properties |
| 2023 | £278,346 | -13% |
39 Properties |
| 2022 | £315,448 | 7% |
47 Properties |
| 2021 | £292,484 | 9% |
62 Properties |
| 2020 | £266,772 | 30% |
38 Properties |
| 2019 | £187,756 | -23% |
37 Properties |
| 2018 | £230,482 | 14% |
46 Properties |
| 2017 | £198,507 | -1% |
59 Properties |
| 2016 | £199,860 | 19% |
74 Properties |
| 2015 | £162,291 | -10% |
56 Properties |
| 2014 | £177,977 | 26% |
51 Properties |
| 2013 | £132,341 | -4% |
36 Properties |
| 2012 | £137,554 | -16% |
27 Properties |
| 2011 | £160,132 | -1% |
36 Properties |
| 2010 | £162,182 | 16% |
36 Properties |
| 2009 | £135,750 | -16% |
24 Properties |
| 2008 | £157,719 | 5% |
37 Properties |
| 2007 | £149,331 | -6% |
65 Properties |
| 2006 | £158,400 | 7% |
80 Properties |
| 2005 | £147,725 | -1% |
44 Properties |
| 2004 | £149,771 | 16% |
73 Properties |
| 2003 | £126,116 | 12% |
94 Properties |
| 2002 | £110,609 | 24% |
97 Properties |
| 2001 | £84,114 | 16% |
100 Properties |
| 2000 | £70,322 | -3% |
104 Properties |
| 1999 | £72,695 | 11% |
80 Properties |
| 1998 | £64,857 | 3% |
67 Properties |
| 1997 | £63,072 | 16% |
65 Properties |
| 1996 | £52,723 | 1% |
61 Properties |
| 1995 | £52,052 | - |
46 Properties |
Property Price per Property Type in Morkery
Here you can find historic sold price data in order to help with your property search.
The average Property Paid Price for specific property types in the last three years are:
| Property Type | Average Sold Price | Sold Properties |
|---|---|---|
| Semi Detached House | £219,247.00 | 38 Semi Detached Houses |
| Detached House | £406,818.00 | 52 Detached Houses |
| Terraced House | £163,241.00 | 36 Terraced Houses |

