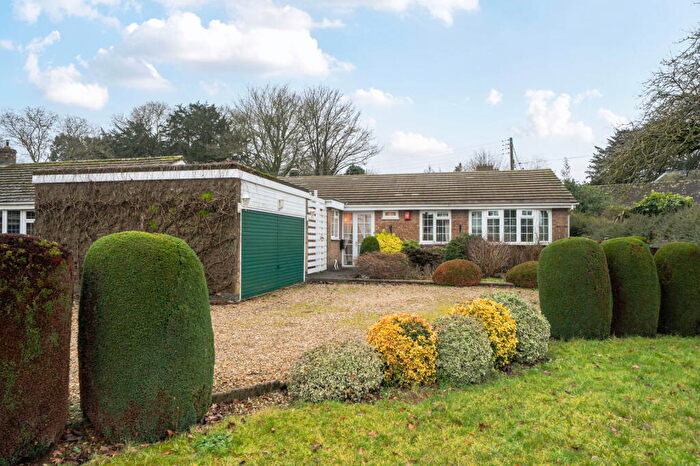
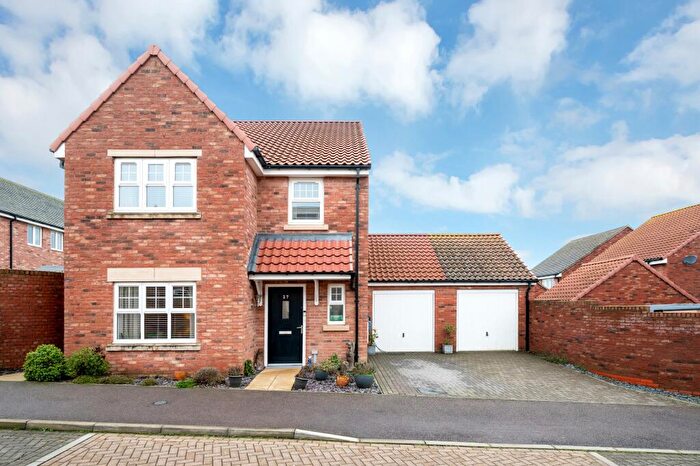
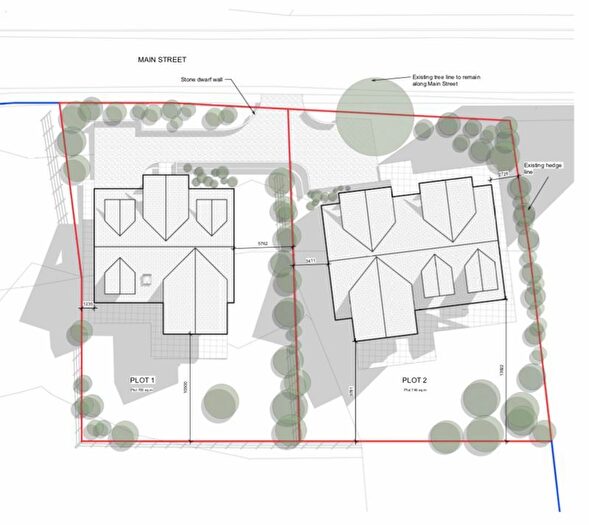
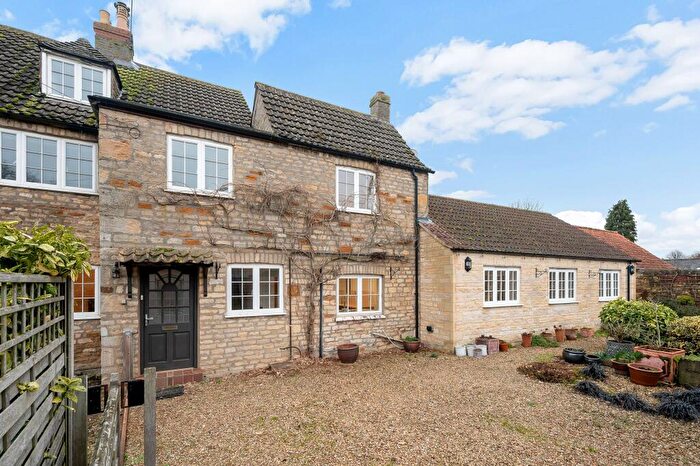
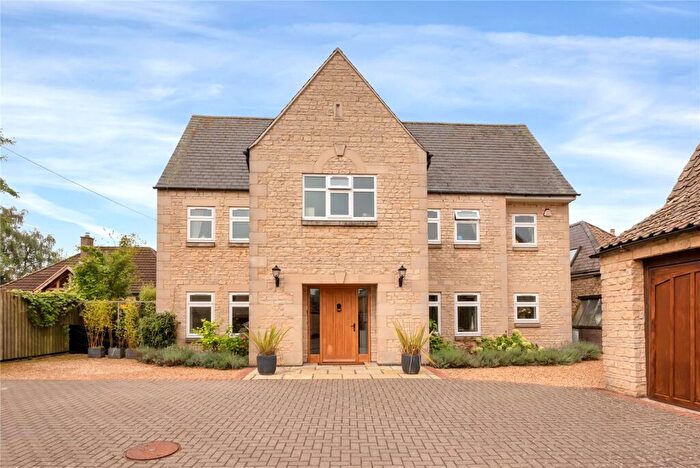
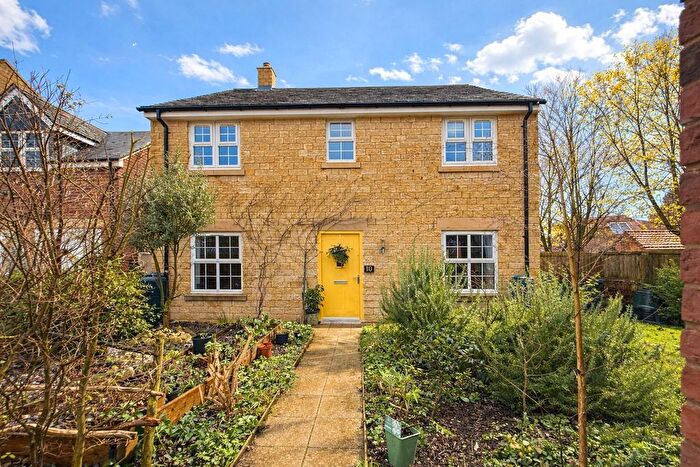
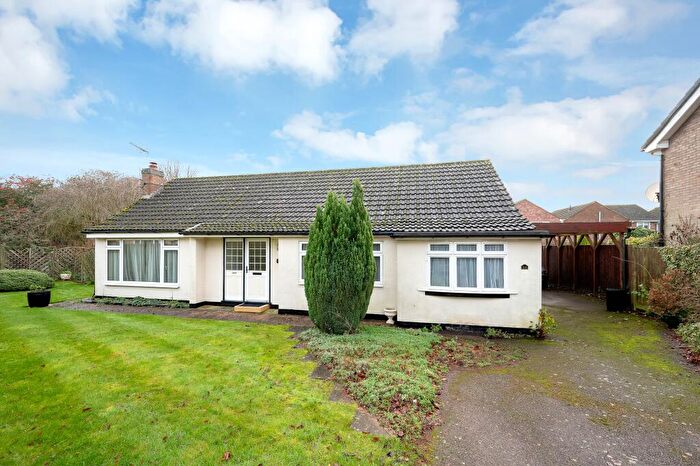
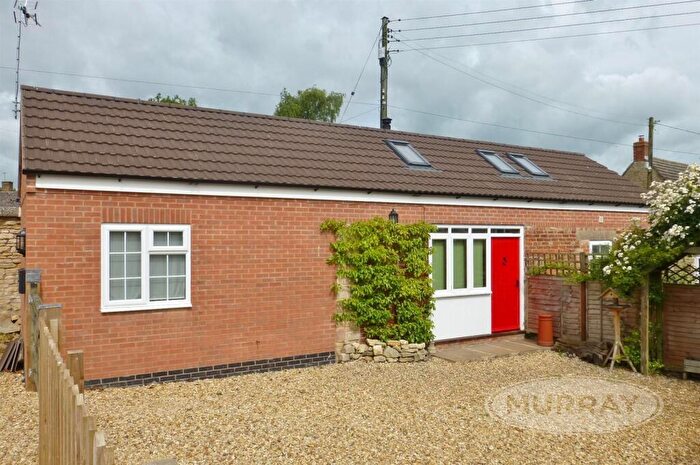
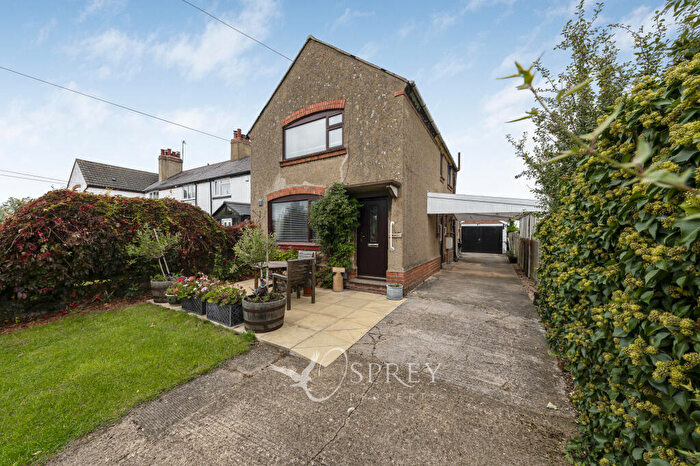
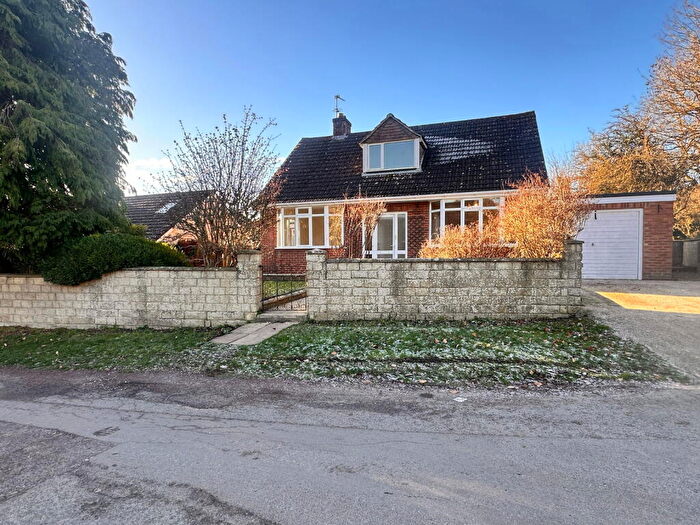
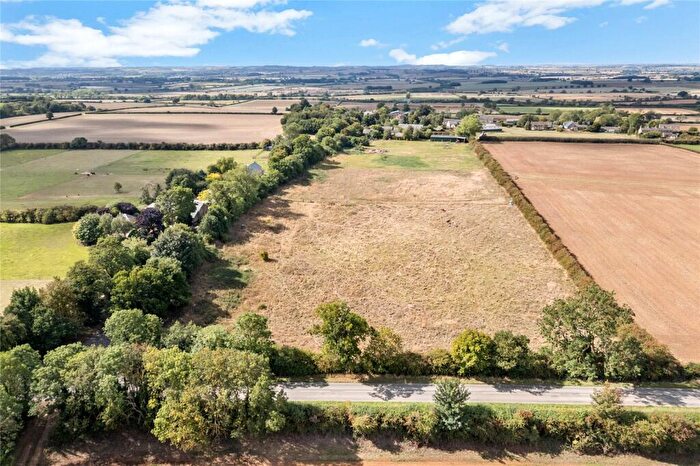
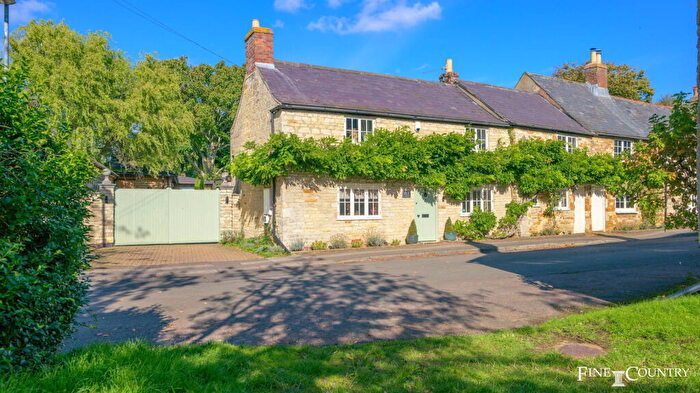
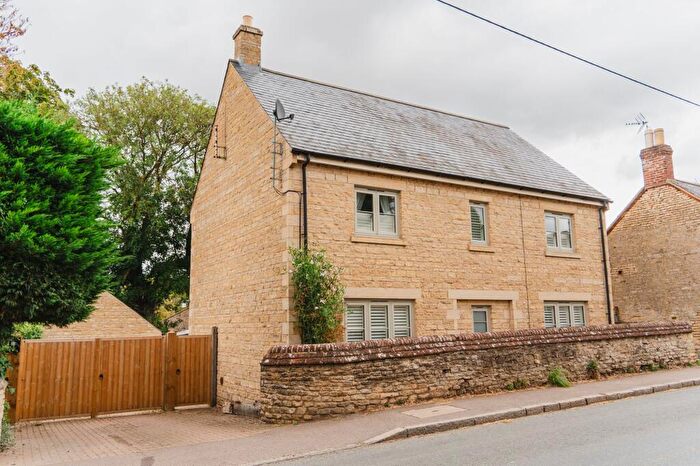
Houses for sale & to rent in Cottesmore, Oakham
House Prices in Cottesmore
Properties in Cottesmore have an average house price of £414,045.00 and had 69 Property Transactions within the last 3 years¹.
Cottesmore is an area in Oakham, Rutland with 1,006 households², where the most expensive property was sold for £2,250,000.00.
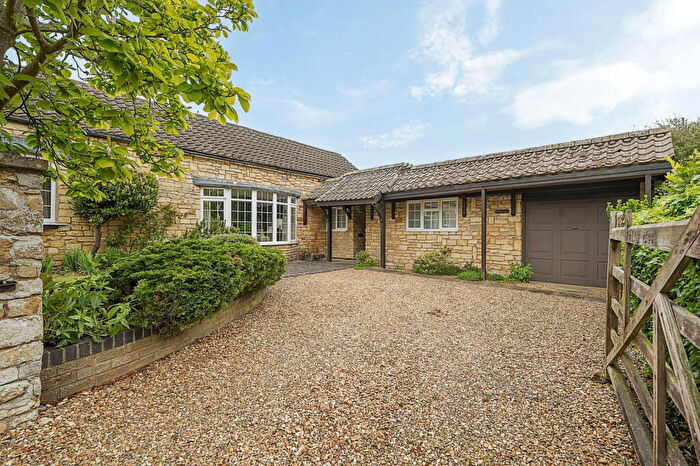
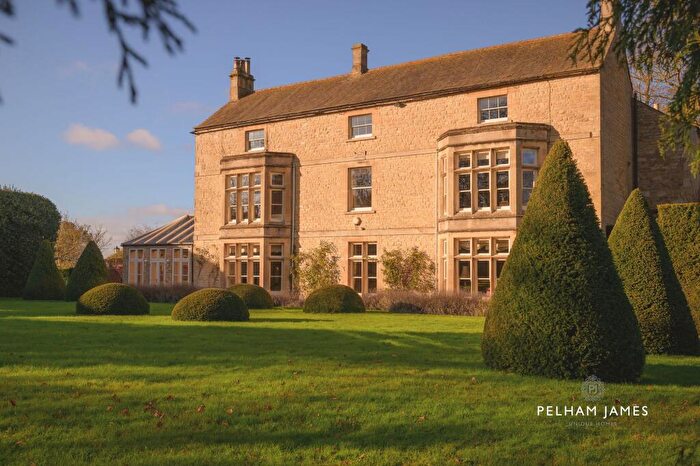
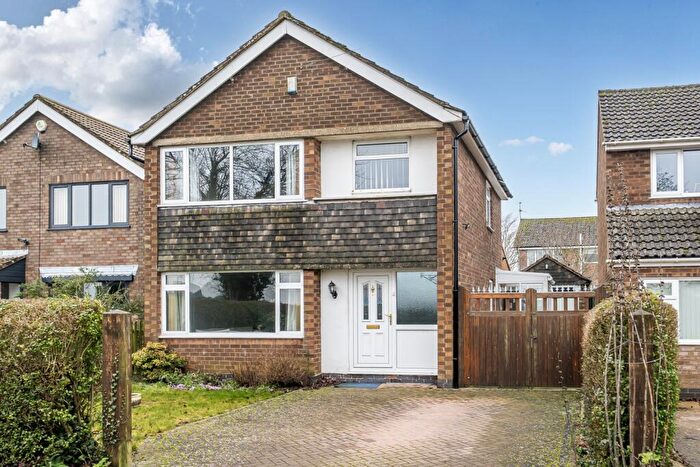
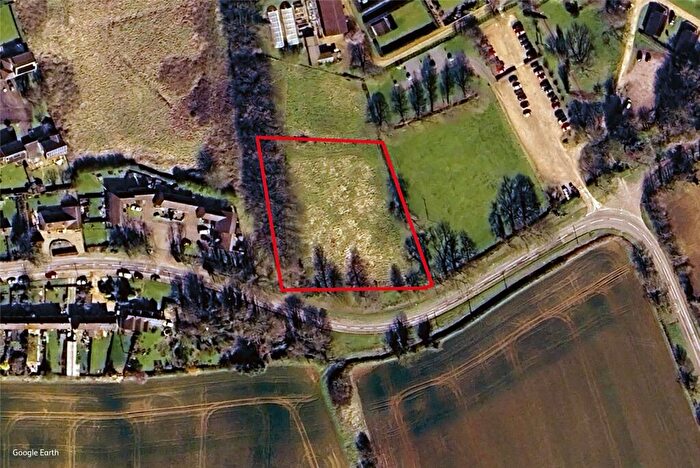
Properties for sale in Cottesmore
Previously listed properties in Cottesmore
Roads and Postcodes in Cottesmore
Navigate through our locations to find the location of your next house in Cottesmore, Oakham for sale or to rent.
| Streets | Postcodes |
|---|---|
| Ashwell Road | LE15 7BX LE15 7FF |
| Austhorp Grove | LE15 7BY |
| Beaufort Road | LE15 7AD |
| Bedale Street | LE15 7AE LE15 7AF |
| Belvoir Square | LE15 7LY |
| Berke Cottages | LE15 7PF |
| Berrybushes | LE15 7PQ |
| Blankney Road | LE15 7AG |
| Bowling Green Lane | LE15 7PH |
| Burghley Circle | LE15 7AQ |
| Burley Road | LE15 7BZ LE15 7BN |
| Church Lane | LE15 7PR |
| Clatterpot Lane | LE15 7DW |
| Cordle Way | LE15 7PU |
| Cotley Crescent | LE15 7AH |
| Cotswold Street | LE15 7AJ |
| Cottesmore Road | LE15 7WT |
| Cresswell Drive | LE15 7DY |
| Cumberland Walk | LE15 7AW |
| Debdale | LE15 7BU |
| Devon Walk | LE15 7AP |
| Exton Road | LE15 7DA |
| Fernie Square | LE15 7AR |
| Fitzwilliam Walk | LE15 7AS |
| Fountains Row | LE15 7PJ |
| Gainsborough Court | LE15 7DX |
| Garth Street | LE15 7AT |
| Greetham Road | LE15 7DB LE15 7DD |
| Hall Close | LE15 7DE |
| Hambledon Crescent | LE15 7AU |
| Harrier Close | LE15 7BT |
| Heath Drive | LE15 7DF |
| Heythrop Road | LE15 7LZ |
| Ironstone Lane | LE15 7TP |
| Jubilee Gardens | LE15 7TJ |
| Kings Close | LE15 7PS |
| Lawrence Close | LE15 7QE |
| Ledbury Walk | LE15 7AY |
| Lilac Way | LE15 7GF |
| Long Meadow Way | LE15 7DQ |
| Main Street | LE15 7DH LE15 7DJ LE15 7PE LE15 7PL LE15 7RT |
| Market Overton Road | LE15 7PG |
| Mill Lane | LE15 7DL |
| Nether Close | LE15 7DN |
| Oakley Road | LE15 7AZ |
| Old Hall Mews | LE15 7TL |
| Percy Road | LE15 7BB |
| Pinfold Lane | LE15 7PN |
| Quorn Crescent | LE15 7NB |
| Rogues Lane | LE15 7AN |
| Sheep Dyke | LE15 7DU |
| Southdown Walk | LE15 7BE |
| Spring Close | LE15 7PT |
| St Nicholas Court | LE15 7BW |
| Teigh Road | LE15 7PW |
| The Finches | LE15 7PY |
| The Leas | LE15 7DG |
| The Limes | LE15 7PX |
| The Pastures | LE15 7DZ |
| The Spinney | LE15 7BP |
| Thistleton Road | LE15 7PP |
| Tindall Square | LE15 7BG |
| Tiverton Road | LE15 7BQ |
| Toll Bar | LE15 7DP |
| Walker Close | LE15 7FG |
| Wenton Close | LE15 7DR |
| Westland Road | LE15 7DS LE15 7DT |
| Whaddon Chase | LE15 7BH |
| Woodhead Close | LE15 7PD |
| Zetland Square | LE15 7ND |
| LE15 7BA LE15 7BL |
Transport near Cottesmore
- FAQ
- Price Paid By Year
- Property Type Price
Frequently asked questions about Cottesmore
What is the average price for a property for sale in Cottesmore?
The average price for a property for sale in Cottesmore is £414,045. This amount is 0.56% higher than the average price in Oakham. There are 193 property listings for sale in Cottesmore.
What streets have the most expensive properties for sale in Cottesmore?
The streets with the most expensive properties for sale in Cottesmore are Clatterpot Lane at an average of £1,430,000, The Spinney at an average of £812,500 and Teigh Road at an average of £807,500.
What streets have the most affordable properties for sale in Cottesmore?
The streets with the most affordable properties for sale in Cottesmore are Walker Close at an average of £115,625, Fountains Row at an average of £150,000 and Austhorp Grove at an average of £230,000.
Which train stations are available in or near Cottesmore?
Some of the train stations available in or near Cottesmore are Oakham, Stamford and Melton Mowbray.
Property Price Paid in Cottesmore by Year
The average sold property price by year was:
| Year | Average Sold Price | Price Change |
Sold Properties
|
|---|---|---|---|
| 2025 | £432,224 | -6% |
23 Properties |
| 2024 | £458,785 | 22% |
21 Properties |
| 2023 | £359,738 | -16% |
25 Properties |
| 2022 | £417,904 | 16% |
31 Properties |
| 2021 | £349,526 | -6% |
19 Properties |
| 2020 | £369,397 | - |
20 Properties |
| 2019 | £369,226 | 14% |
17 Properties |
| 2018 | £317,913 | 10% |
38 Properties |
| 2017 | £285,812 | 9% |
35 Properties |
| 2016 | £260,953 | -5% |
35 Properties |
| 2015 | £273,433 | 3% |
43 Properties |
| 2014 | £264,208 | -4% |
31 Properties |
| 2013 | £275,791 | 17% |
45 Properties |
| 2012 | £227,719 | -28% |
36 Properties |
| 2011 | £290,527 | 5% |
18 Properties |
| 2010 | £277,089 | -12% |
28 Properties |
| 2009 | £310,645 | 2% |
24 Properties |
| 2008 | £305,560 | 19% |
24 Properties |
| 2007 | £248,465 | 10% |
75 Properties |
| 2006 | £224,273 | 4% |
46 Properties |
| 2005 | £215,388 | -26% |
25 Properties |
| 2004 | £270,789 | 23% |
41 Properties |
| 2003 | £208,281 | 5% |
49 Properties |
| 2002 | £198,895 | 10% |
37 Properties |
| 2001 | £178,814 | 30% |
33 Properties |
| 2000 | £124,651 | 21% |
36 Properties |
| 1999 | £98,268 | -17% |
49 Properties |
| 1998 | £114,970 | 20% |
25 Properties |
| 1997 | £92,216 | 11% |
40 Properties |
| 1996 | £81,749 | -2% |
28 Properties |
| 1995 | £83,272 | - |
22 Properties |
Property Price per Property Type in Cottesmore
Here you can find historic sold price data in order to help with your property search.
The average Property Paid Price for specific property types in the last three years are:
| Property Type | Average Sold Price | Sold Properties |
|---|---|---|
| Semi Detached House | £322,142.00 | 14 Semi Detached Houses |
| Detached House | £472,776.00 | 47 Detached Houses |
| Terraced House | £246,142.00 | 7 Terraced Houses |
| Flat | £115,625.00 | 1 Flat |

