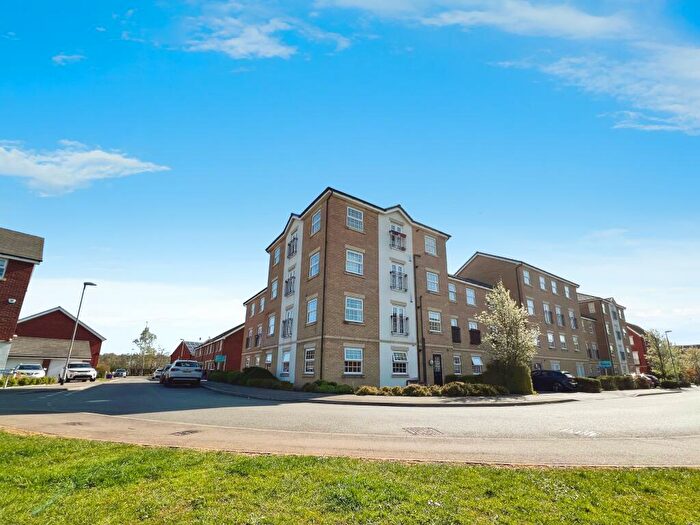
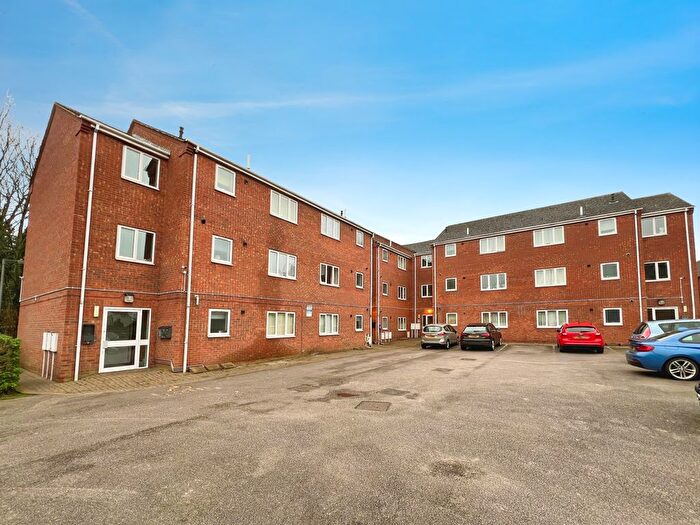
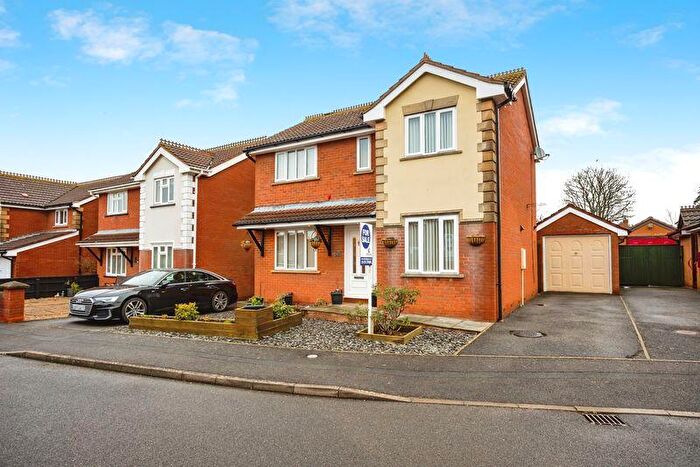
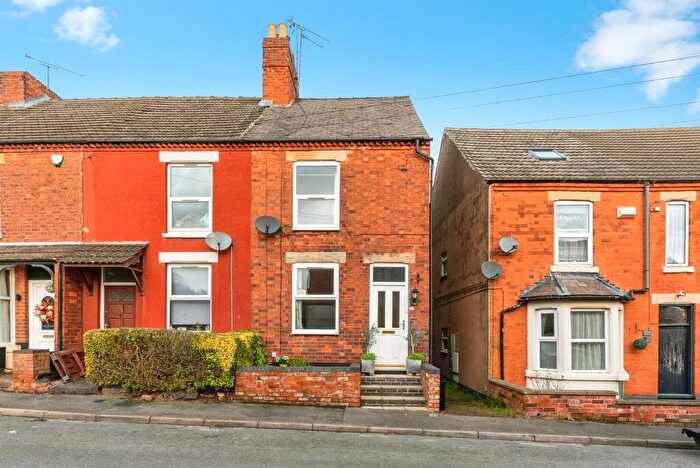
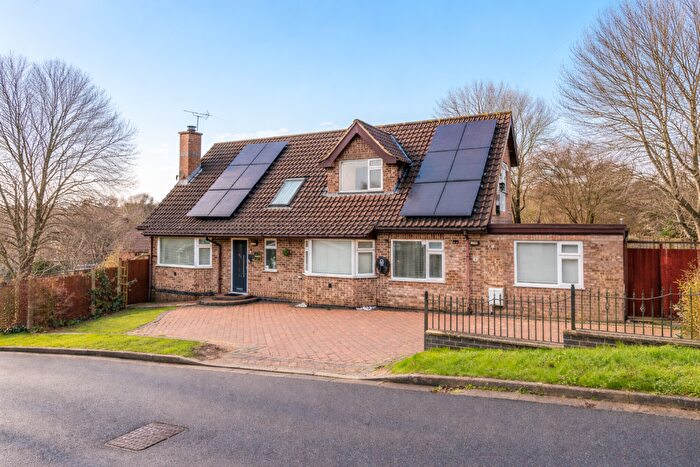
Houses for sale & to rent in St Annes, Grantham
House Prices in St Annes
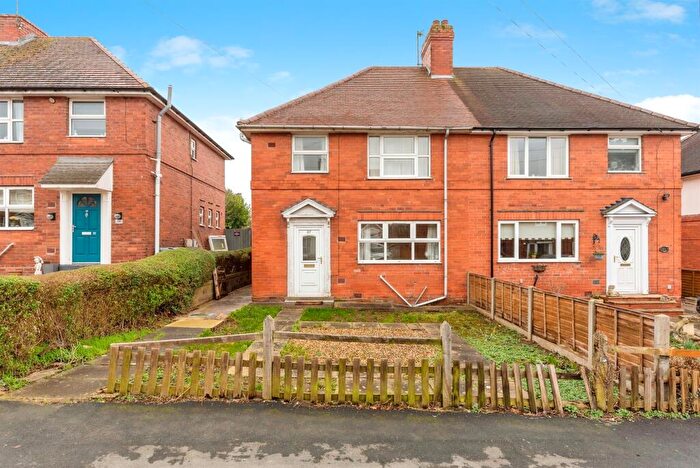
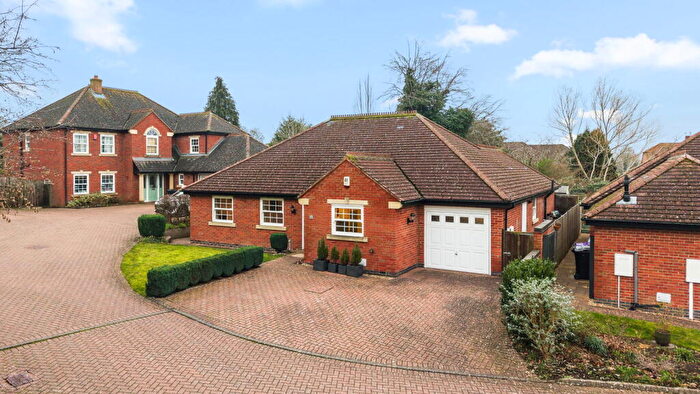
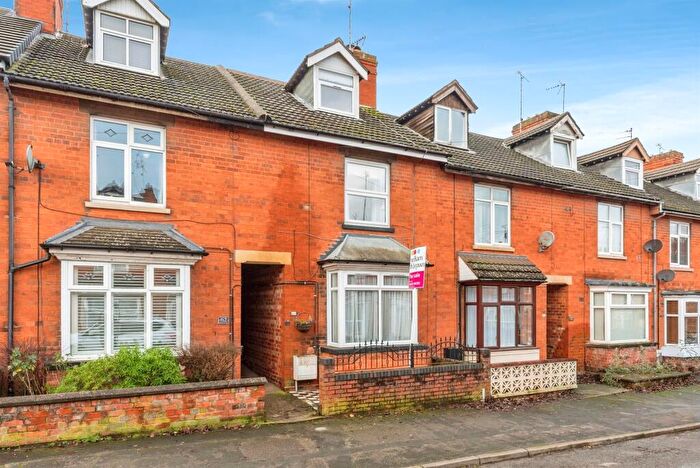
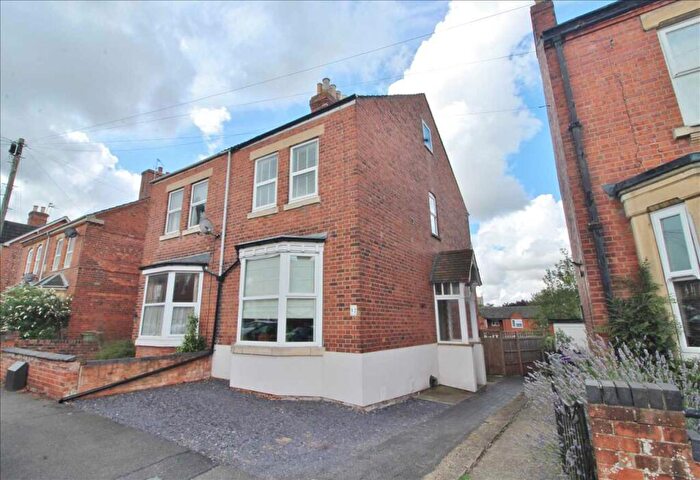
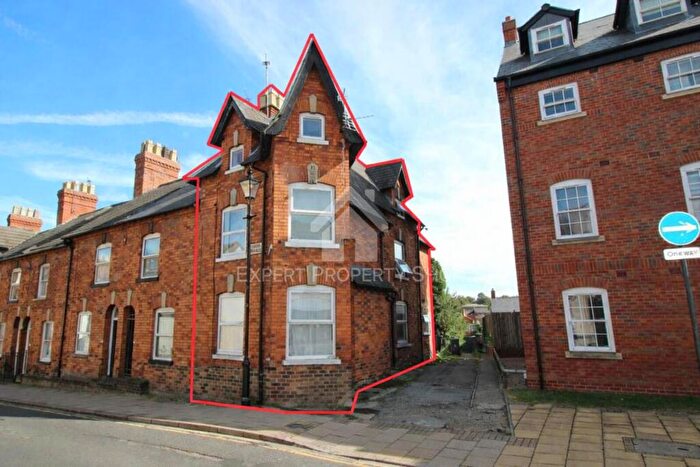
Properties in St Annes have an average house price of £179,130.00 and had 256 Property Transactions within the last 3 years¹.
St Annes is an area in Grantham, Lincolnshire with 2,033 households², where the most expensive property was sold for £520,000.00.
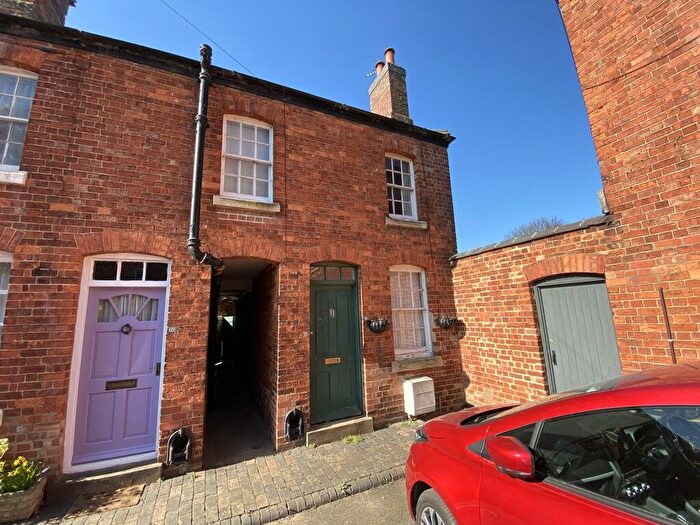
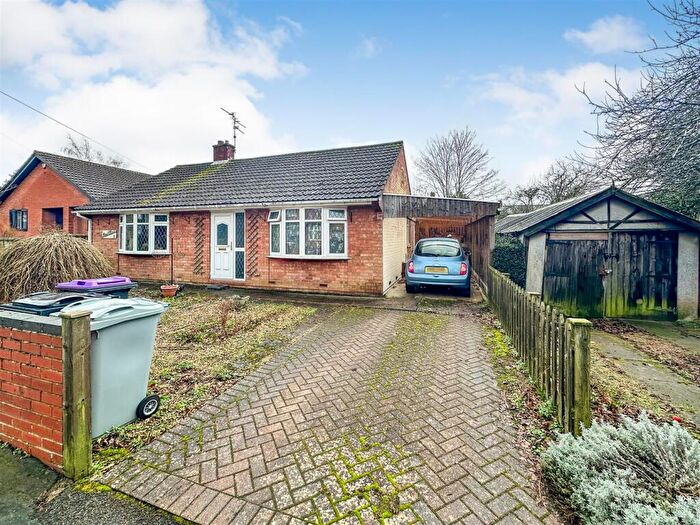
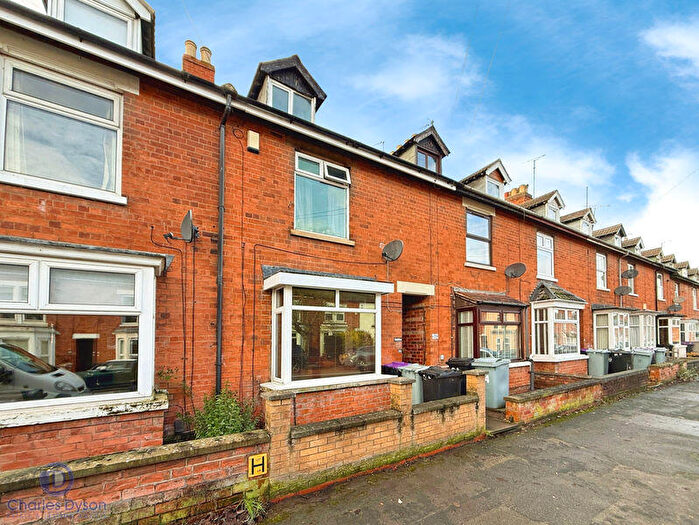
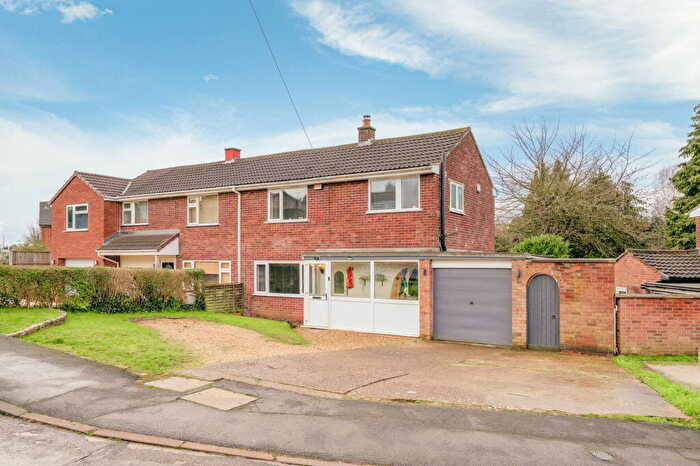
Properties for sale in St Annes
Roads and Postcodes in St Annes
Navigate through our locations to find the location of your next house in St Annes, Grantham for sale or to rent.
| Streets | Postcodes |
|---|---|
| Albert Street | NG31 6HY |
| Anson Close | NG31 7EN |
| Barrack Square | NG31 9DG |
| Beacon Lane | NG31 9DF NG31 9DL NG31 9DN NG31 9DQ |
| Bellwood Gardens | NG31 9LT |
| Blenheim Way | NG31 7HT |
| Bridge End Grove | NG31 7HS |
| Bridge End Road | NG31 6JH NG31 6JN NG31 6JW NG31 7EP NG31 7ER NG31 7ES NG31 7ET NG31 7HA NG31 7HB NG31 7HD |
| Bridge Street | NG31 9AE |
| Brisson Close | NG31 9EL |
| Brittain Drive | NG31 9JT NG31 9JU NG31 9JY NG31 9JZ |
| Cambridge Street | NG31 6EZ |
| Cecil Street | NG31 9AQ |
| Cold Harbour Lane | NG31 7TN NG31 7TW NG31 9EW |
| College Street | NG31 6HG |
| Croft Drive | NG31 9EB |
| Dudley Road | NG31 9AA NG31 9AB NG31 9AD NG31 9AY |
| Edward Street | NG31 6JF NG31 6JG |
| Empire Court | NG31 6ES |
| Eton Street | NG31 6HE |
| Fern Cottages | NG31 6JA |
| Fircroft | NG31 7GT |
| Granville Street | NG31 9AH |
| Hall Drive | NG31 9LB |
| Halls Hill | NG31 7TP |
| Harrow Street | NG31 6HF |
| Harrowby Road | NG31 9DS NG31 9DT NG31 9DU NG31 9DX NG31 9DY NG31 9DZ NG31 9EA NG31 9ED |
| Hill Avenue | NG31 9BD NG31 9BH |
| Hillside Crescent | NG31 7EY |
| Holly Close | NG31 7GU |
| Houghton Road | NG31 6JB NG31 6JD |
| Kenwick Drive | NG31 9DP |
| Kintore Drive | NG31 9DH |
| Lancaster Gardens | NG31 7HX |
| London Road | NG31 6EX NG31 6HS NG31 6HW |
| Mill Drive | NG31 6JL |
| New Beacon Road | NG31 9JR NG31 9JS NG31 9JX |
| Newton Street | NG31 6HA |
| Nottingham Terrace | NG31 6HU |
| Oxford Street | NG31 6HQ |
| Primrose Way | NG31 7GX |
| Range Road | NG31 9LA |
| River View Maltings | NG31 9BF |
| Rugby Court | NG31 6HZ |
| Sandon Road | NG31 9AZ |
| Somerby Grove | NG31 7HR |
| South Parade | NG31 6HT |
| Southlands Drive | NG31 9DW |
| St Annes Street | NG31 9AG |
| St Catherines Road | NG31 6TS NG31 6TT NG31 9DE |
| St Vincents Road | NG31 9EJ |
| Stuart Street | NG31 9AF |
| Toll Bar Road | NG31 9EN |
| Turnor Crescent | NG31 9BQ |
| Twyford Gardens | NG31 9BY |
| University Court | NG31 6HL |
| Wellington Drive | NG31 7HU |
| Woodlands Drive | NG31 9DJ |
| Wyndham Close | NG31 9BE |
Transport near St Annes
- FAQ
- Price Paid By Year
- Property Type Price
Frequently asked questions about St Annes
What is the average price for a property for sale in St Annes?
The average price for a property for sale in St Annes is £179,130. This amount is 29% lower than the average price in Grantham. There are 1,080 property listings for sale in St Annes.
What streets have the most expensive properties for sale in St Annes?
The streets with the most expensive properties for sale in St Annes are Lancaster Gardens at an average of £465,000, Beacon Lane at an average of £465,000 and Woodlands Drive at an average of £437,500.
What streets have the most affordable properties for sale in St Annes?
The streets with the most affordable properties for sale in St Annes are London Road at an average of £75,000, University Court at an average of £87,362 and Eton Street at an average of £97,500.
Which train stations are available in or near St Annes?
Some of the train stations available in or near St Annes are Grantham, Ancaster and Bottesford.
Property Price Paid in St Annes by Year
The average sold property price by year was:
| Year | Average Sold Price | Price Change |
Sold Properties
|
|---|---|---|---|
| 2025 | £186,710 | 4% |
70 Properties |
| 2024 | £178,519 | 3% |
97 Properties |
| 2023 | £173,833 | -14% |
89 Properties |
| 2022 | £197,589 | 18% |
117 Properties |
| 2021 | £162,509 | 10% |
127 Properties |
| 2020 | £145,537 | -4% |
82 Properties |
| 2019 | £150,740 | -23% |
91 Properties |
| 2018 | £184,865 | 18% |
93 Properties |
| 2017 | £151,668 | 14% |
96 Properties |
| 2016 | £130,108 | 1% |
109 Properties |
| 2015 | £128,520 | 6% |
96 Properties |
| 2014 | £120,920 | -2% |
92 Properties |
| 2013 | £122,842 | 8% |
92 Properties |
| 2012 | £112,522 | -8% |
51 Properties |
| 2011 | £121,385 | -4% |
62 Properties |
| 2010 | £125,840 | -12% |
60 Properties |
| 2009 | £140,805 | -11% |
80 Properties |
| 2008 | £156,996 | 14% |
65 Properties |
| 2007 | £134,886 | 12% |
147 Properties |
| 2006 | £118,800 | -3% |
144 Properties |
| 2005 | £122,177 | 9% |
104 Properties |
| 2004 | £111,488 | 24% |
147 Properties |
| 2003 | £84,595 | 6% |
157 Properties |
| 2002 | £79,539 | 25% |
188 Properties |
| 2001 | £59,599 | 24% |
188 Properties |
| 2000 | £45,268 | -1% |
142 Properties |
| 1999 | £45,626 | 1% |
149 Properties |
| 1998 | £45,261 | 6% |
108 Properties |
| 1997 | £42,656 | 10% |
123 Properties |
| 1996 | £38,200 | 1% |
110 Properties |
| 1995 | £37,976 | - |
78 Properties |
Property Price per Property Type in St Annes
Here you can find historic sold price data in order to help with your property search.
The average Property Paid Price for specific property types in the last three years are:
| Property Type | Average Sold Price | Sold Properties |
|---|---|---|
| Semi Detached House | £222,206.00 | 53 Semi Detached Houses |
| Detached House | £344,750.00 | 22 Detached Houses |
| Terraced House | £155,259.00 | 148 Terraced Houses |
| Flat | £106,589.00 | 33 Flats |

