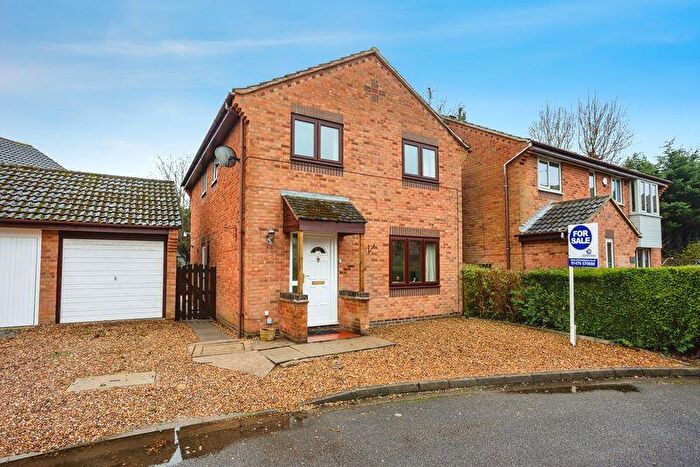
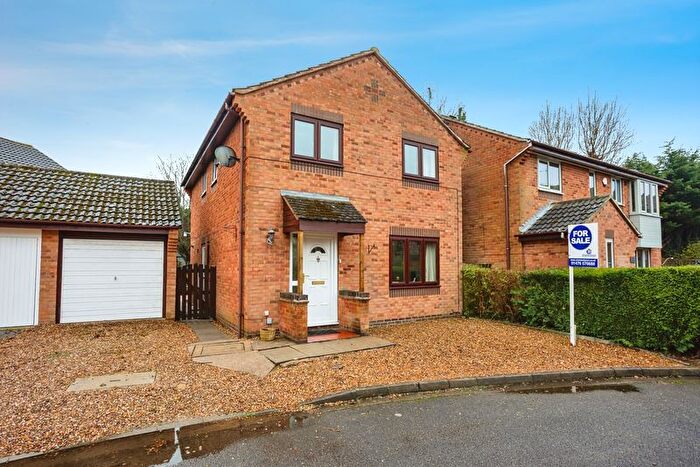
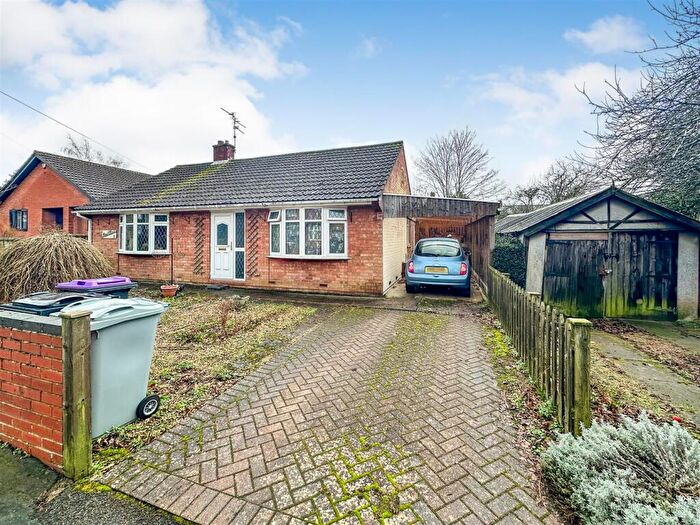
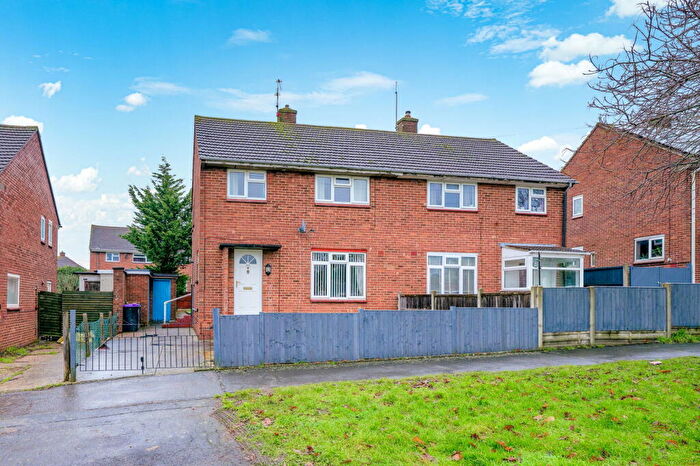
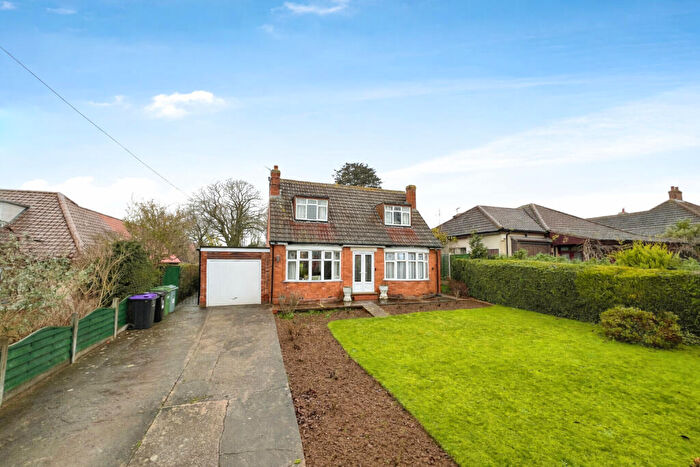
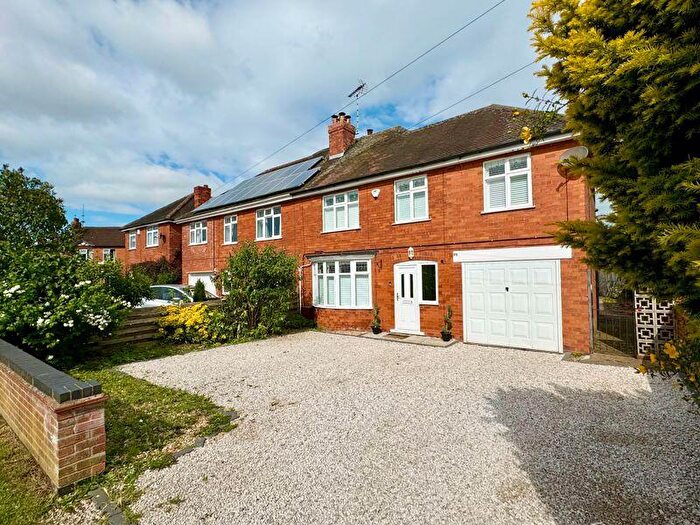
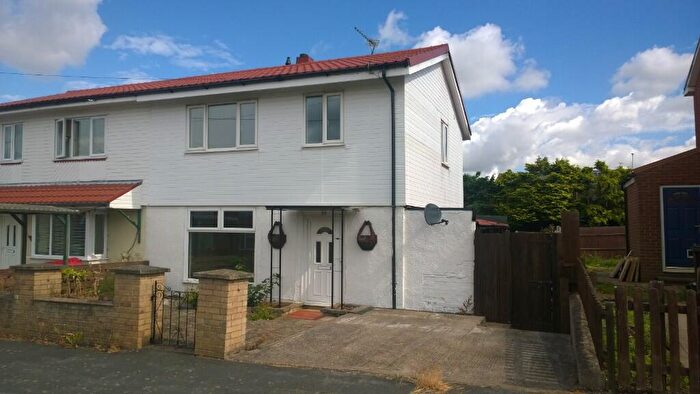
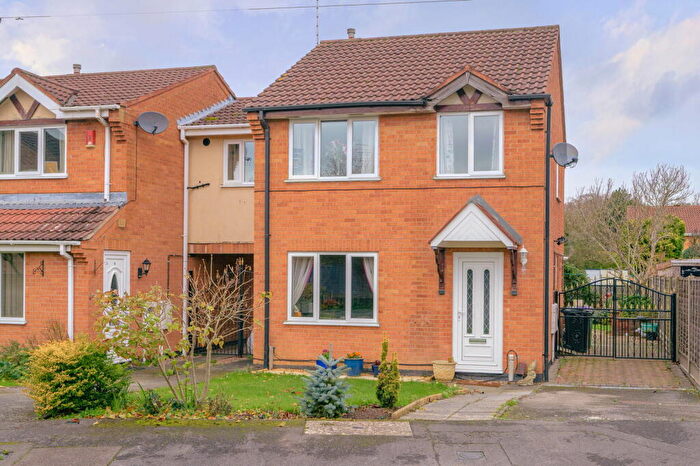
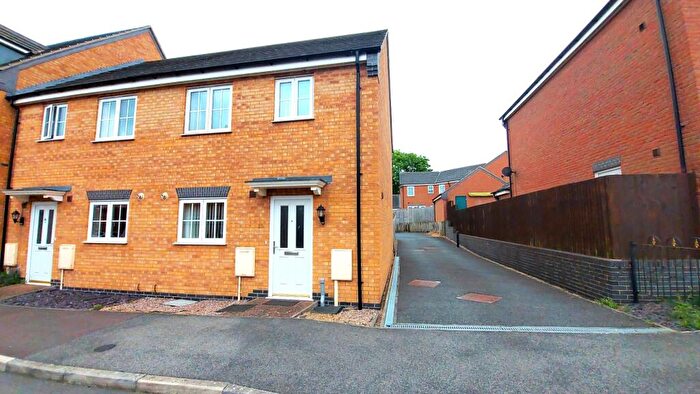
Houses for sale & to rent in Harrowby, Grantham
House Prices in Harrowby
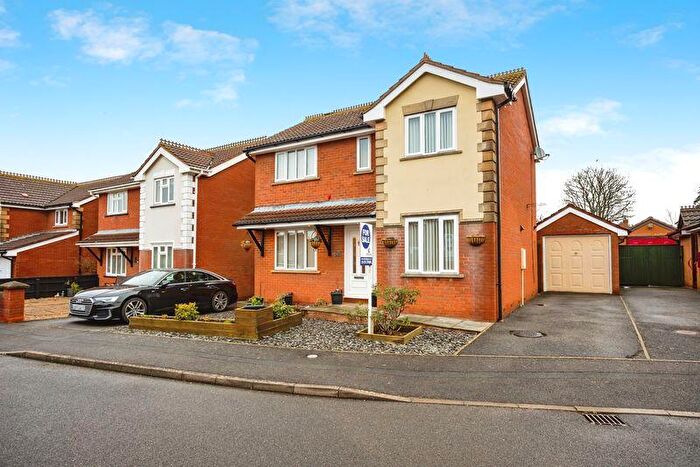
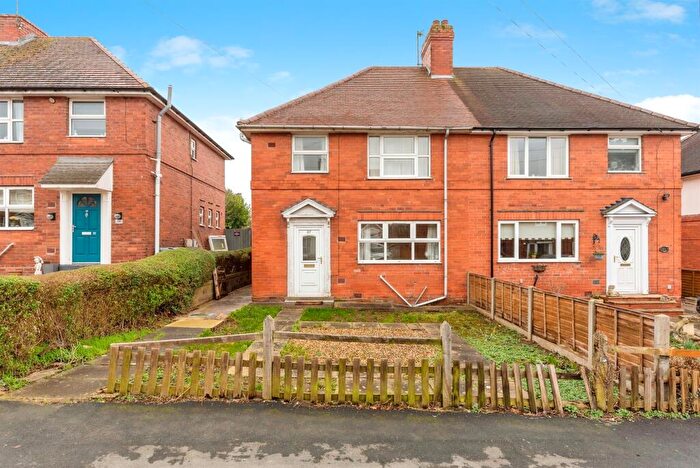
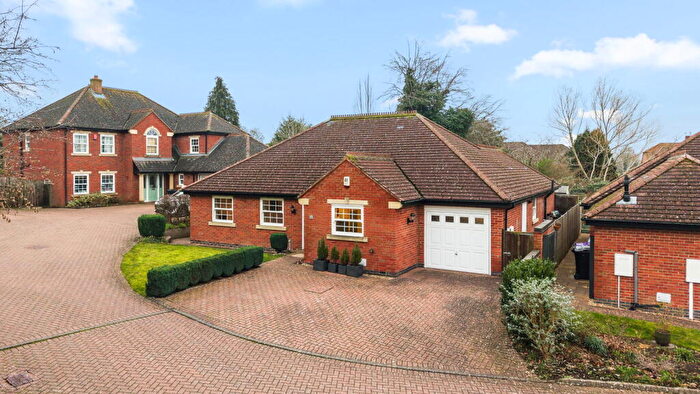
Properties in Harrowby have an average house price of £223,491.00 and had 167 Property Transactions within the last 3 years¹.
Harrowby is an area in Grantham, Lincolnshire with 2,297 households², where the most expensive property was sold for £790,000.00.
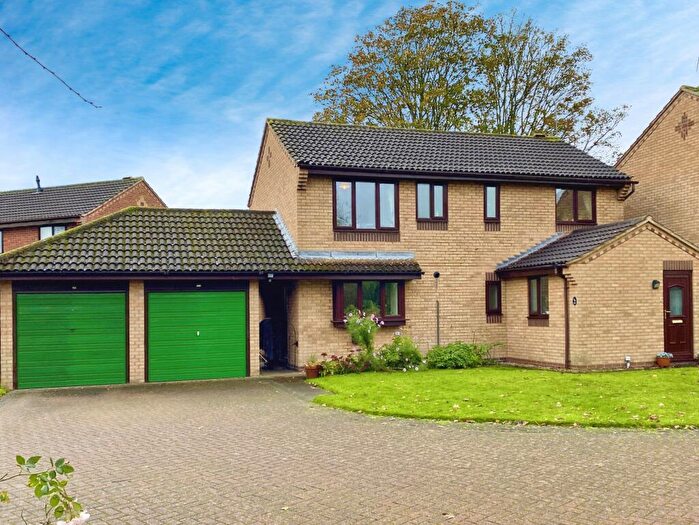
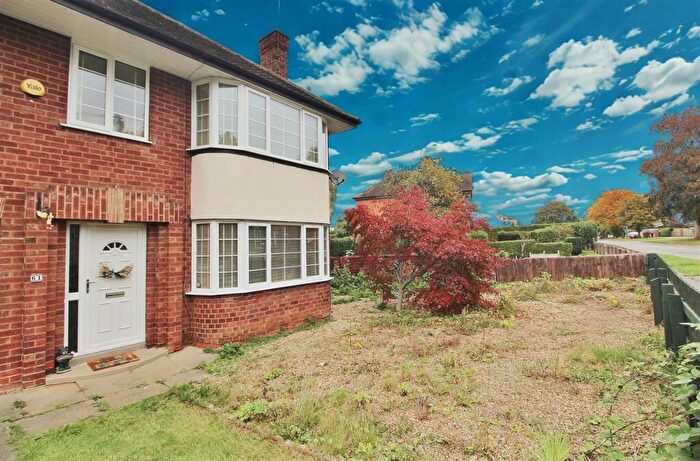
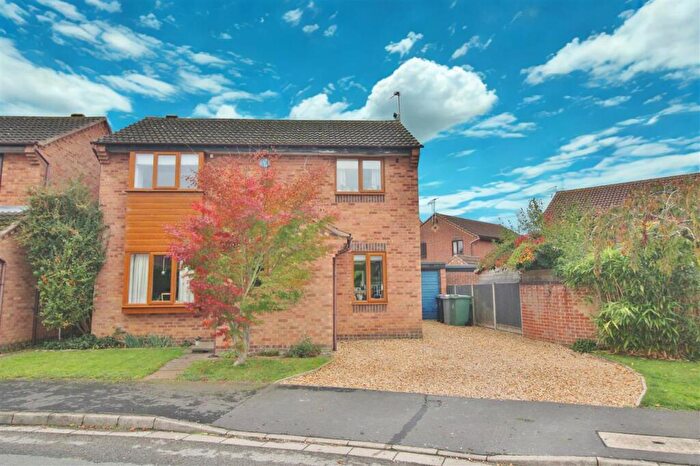
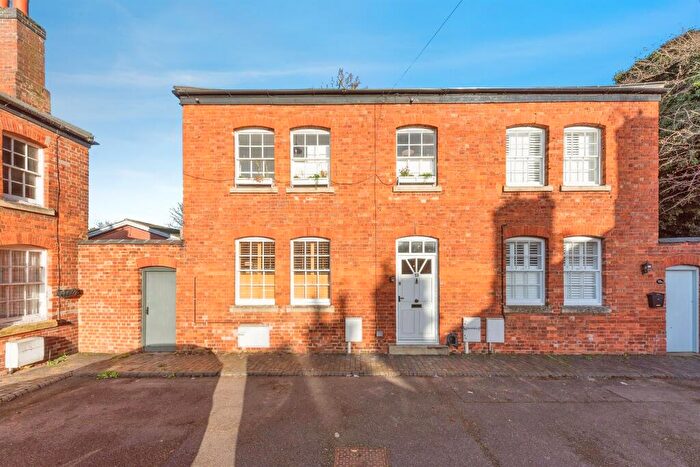
Properties for sale in Harrowby
Roads and Postcodes in Harrowby
Navigate through our locations to find the location of your next house in Harrowby, Grantham for sale or to rent.
| Streets | Postcodes |
|---|---|
| Acorn Close | NG31 9JN |
| Almond Grove | NG31 9PX |
| Ash Grove | NG31 9QE |
| Aviary Close | NG31 9LF |
| Belmont Grove | NG31 9NU |
| Belton Avenue | NG31 9HR NG31 9JE NG31 9JF NG31 9JG NG31 9JH NG31 9JJ |
| Belton Gardens | NG31 9HE |
| Belton Grove | NG31 9HH |
| Belton Lane | NG31 9HJ NG31 9HL NG31 9HS NG31 9HW NG31 9PG NG31 9PH NG31 9PL NG31 9PR |
| Burns Close | NG31 9NJ |
| Byron Avenue | NG31 9NB |
| Canberra Crescent | NG31 9RD |
| Chaucer Close | NG31 9EG |
| Christchurch Road | NG31 9RQ |
| Cornwall Close | NG31 9PU |
| Cottesmore Close | NG31 9JL |
| Dickens Road | NG31 9QY |
| Dryden Close | NG31 9QS |
| Edinburgh Road | NG31 9QR NG31 9QT NG31 9QU NG31 9QZ |
| Elliot Close | NG31 9QX |
| Elm Grove | NG31 9JB |
| Elsie Davies Close | NG31 9UR |
| Ermine Close | NG31 9PA |
| Goldsmith Road | NG31 9QW |
| Gorse Rise | NG31 9BS |
| Gorse Road | NG31 9LH NG31 9LQ |
| Granta Crescent | NG31 9PJ |
| Hamilton Road | NG31 9QG |
| Harrowby Close | NG31 9HU |
| Harrowby Lane | NG31 9HX NG31 9HY NG31 9HZ NG31 9JA NG31 9LN NG31 9LU NG31 9LW NG31 9LX NG31 9LY NG31 9NL NG31 9NR NG31 9NS |
| Hill Avenue | NG31 9BA NG31 9BG NG31 9BJ |
| Hobart Road | NG31 9QF |
| Jubilee Avenue | NG31 9LG |
| Keats Avenue | NG31 9NN |
| Kipling Close | NG31 9ND |
| Laburnum Close | NG31 9LS |
| Lime Grove | NG31 9JD |
| Melbourne Road | NG31 9RH NG31 9RJ |
| Mill Close | NG31 9RP |
| Moat Walk | NG31 9NF |
| New Beacon Road | NG31 9LD NG31 9LE NG31 9LJ NG31 9LL |
| Princess Drive | NG31 9PS NG31 9PT NG31 9PY NG31 9PZ NG31 9QA NG31 9QN |
| Purcell Close | NG31 9QP |
| Queensway | NG31 9QB NG31 9QD NG31 9RA NG31 9RB NG31 9RF NG31 9RG NG31 9RL NG31 9RN NG31 9RW |
| Regency Gardens | NG31 9JW |
| Shakespeare Avenue | NG31 9NE NG31 9NP NG31 9NW |
| Sharpe Road | NG31 9BN NG31 9BW |
| Shelley Avenue | NG31 9LZ |
| Signal Road | NG31 9BL NG31 9BP |
| Tennyson Avenue | NG31 9NA NG31 9NH NG31 9NQ |
| The Orchards | NG31 9GW |
| Tyson Close | NG31 9HT |
| Uplands Drive | NG31 9NT NG31 9NZ |
| Willoughby Gardens | NG31 9RR |
| Wordsworth Close | NG31 9NG |
Transport near Harrowby
- FAQ
- Price Paid By Year
- Property Type Price
Frequently asked questions about Harrowby
What is the average price for a property for sale in Harrowby?
The average price for a property for sale in Harrowby is £223,491. This amount is 11% lower than the average price in Grantham. There are 615 property listings for sale in Harrowby.
What streets have the most expensive properties for sale in Harrowby?
The streets with the most expensive properties for sale in Harrowby are The Orchards at an average of £400,000, Granta Crescent at an average of £357,500 and Cottesmore Close at an average of £315,142.
What streets have the most affordable properties for sale in Harrowby?
The streets with the most affordable properties for sale in Harrowby are Harrowby Close at an average of £125,000, Hamilton Road at an average of £137,000 and Keats Avenue at an average of £138,000.
Which train stations are available in or near Harrowby?
Some of the train stations available in or near Harrowby are Grantham, Ancaster and Bottesford.
Property Price Paid in Harrowby by Year
The average sold property price by year was:
| Year | Average Sold Price | Price Change |
Sold Properties
|
|---|---|---|---|
| 2025 | £232,504 | 1% |
48 Properties |
| 2024 | £230,454 | 9% |
56 Properties |
| 2023 | £210,436 | -1% |
63 Properties |
| 2022 | £211,626 | 8% |
63 Properties |
| 2021 | £194,087 | -5% |
82 Properties |
| 2020 | £203,188 | 16% |
43 Properties |
| 2019 | £170,667 | 0,3% |
73 Properties |
| 2018 | £170,235 | 4% |
61 Properties |
| 2017 | £164,094 | 5% |
72 Properties |
| 2016 | £156,275 | 1% |
67 Properties |
| 2015 | £154,675 | 0,1% |
78 Properties |
| 2014 | £154,586 | 17% |
77 Properties |
| 2013 | £128,701 | 7% |
74 Properties |
| 2012 | £119,725 | -5% |
55 Properties |
| 2011 | £125,769 | -6% |
59 Properties |
| 2010 | £133,008 | -2% |
36 Properties |
| 2009 | £135,731 | 7% |
46 Properties |
| 2008 | £126,882 | -16% |
39 Properties |
| 2007 | £146,680 | 5% |
73 Properties |
| 2006 | £139,753 | 3% |
94 Properties |
| 2005 | £135,817 | 15% |
59 Properties |
| 2004 | £115,434 | 15% |
76 Properties |
| 2003 | £97,703 | 26% |
76 Properties |
| 2002 | £72,322 | 6% |
89 Properties |
| 2001 | £67,720 | 11% |
88 Properties |
| 2000 | £60,519 | 5% |
72 Properties |
| 1999 | £57,312 | 14% |
61 Properties |
| 1998 | £49,327 | -8% |
61 Properties |
| 1997 | £53,119 | 8% |
76 Properties |
| 1996 | £48,691 | 7% |
59 Properties |
| 1995 | £45,472 | - |
44 Properties |
Property Price per Property Type in Harrowby
Here you can find historic sold price data in order to help with your property search.
The average Property Paid Price for specific property types in the last three years are:
| Property Type | Average Sold Price | Sold Properties |
|---|---|---|
| Semi Detached House | £209,488.00 | 92 Semi Detached Houses |
| Detached House | £310,017.00 | 42 Detached Houses |
| Terraced House | £159,815.00 | 30 Terraced Houses |
| Flat | £78,333.00 | 3 Flats |

