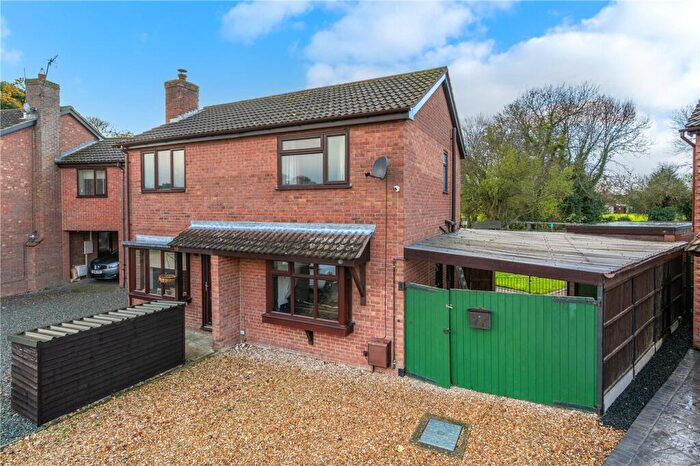
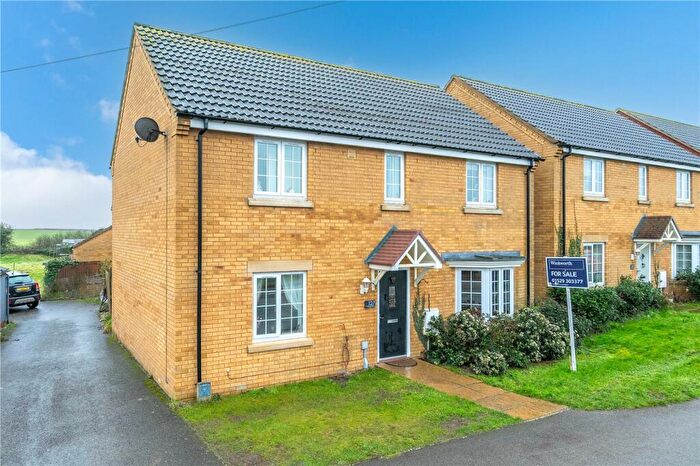
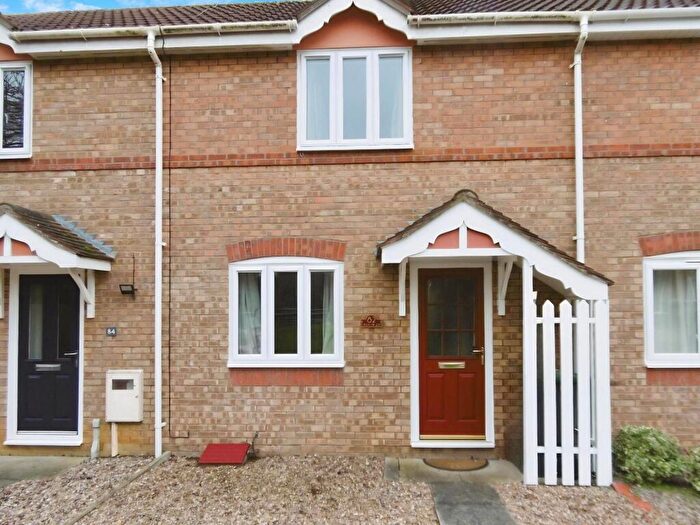
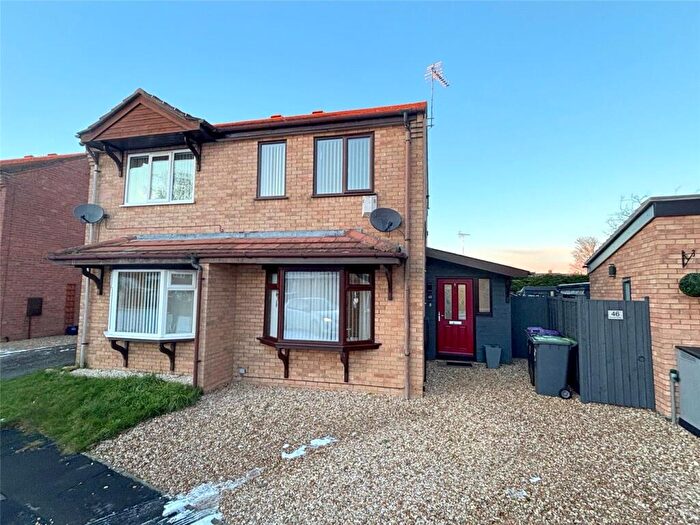
Houses for sale & to rent in Ashby De La Launde And Cranwell, Lincoln
House Prices in Ashby De La Launde And Cranwell
Properties in Ashby De La Launde And Cranwell have an average house price of £371,373.00 and had 76 Property Transactions within the last 3 years¹.
Ashby De La Launde And Cranwell is an area in Lincoln, Lincolnshire with 1,077 households², where the most expensive property was sold for £1,100,000.00.
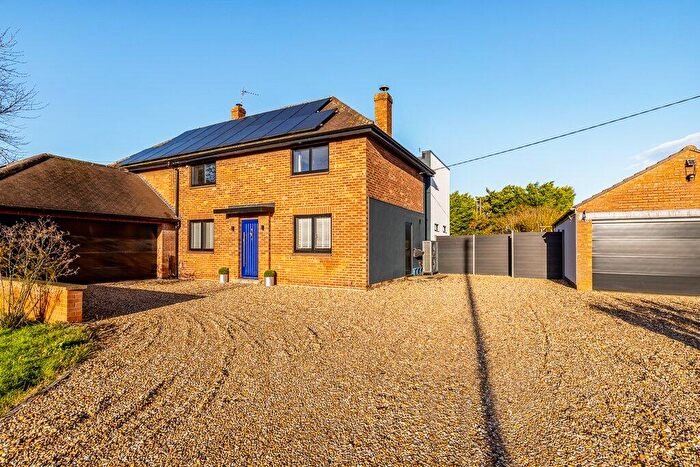
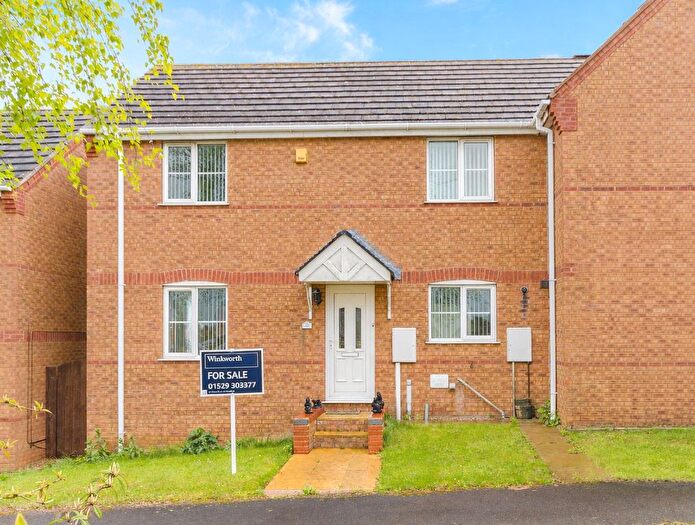
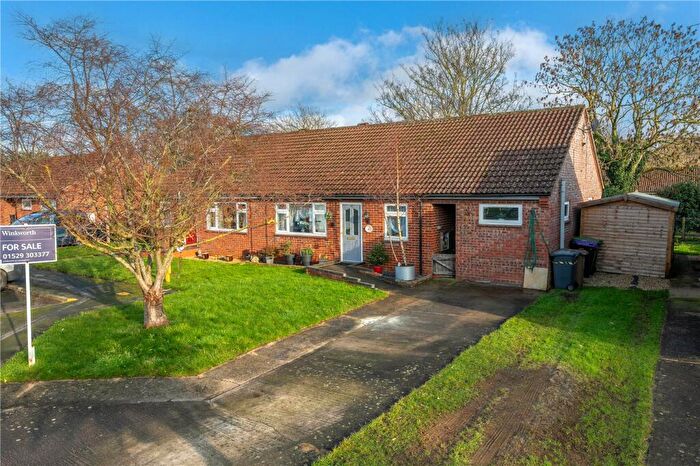
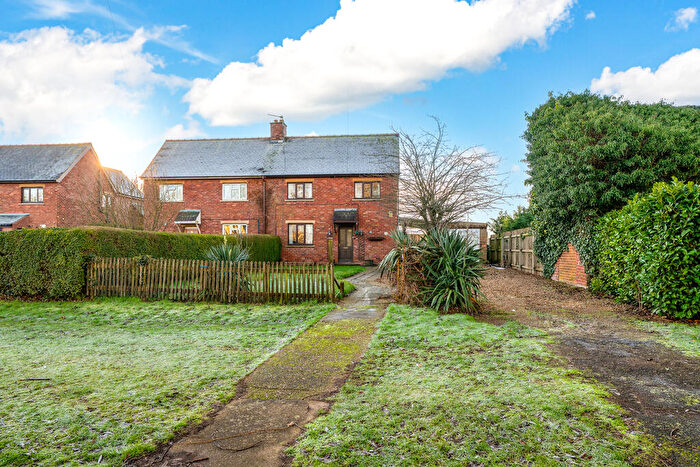
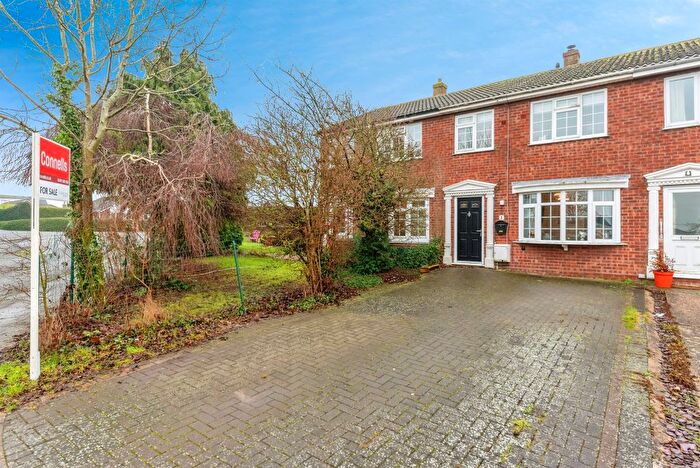
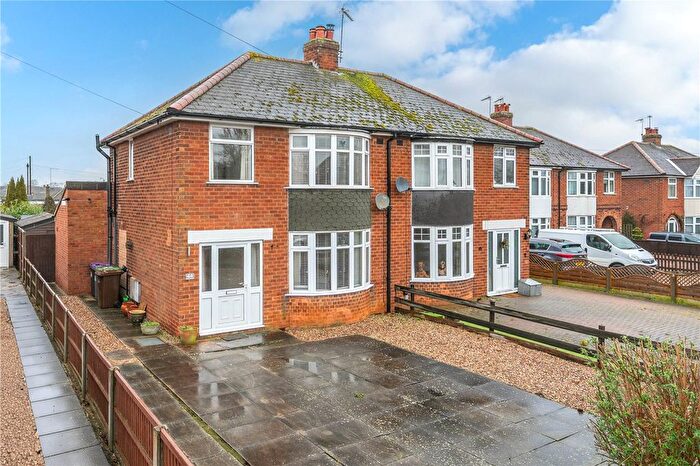
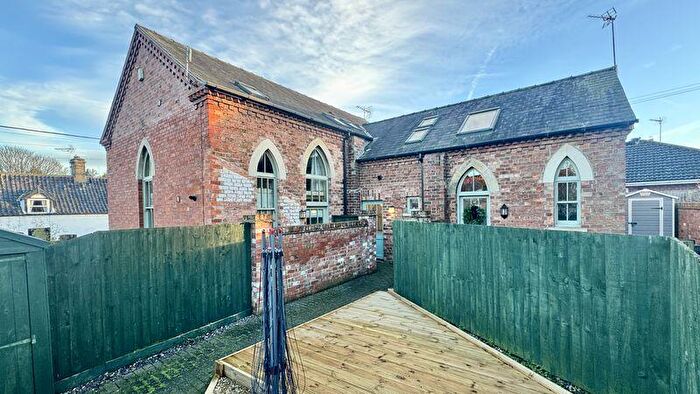
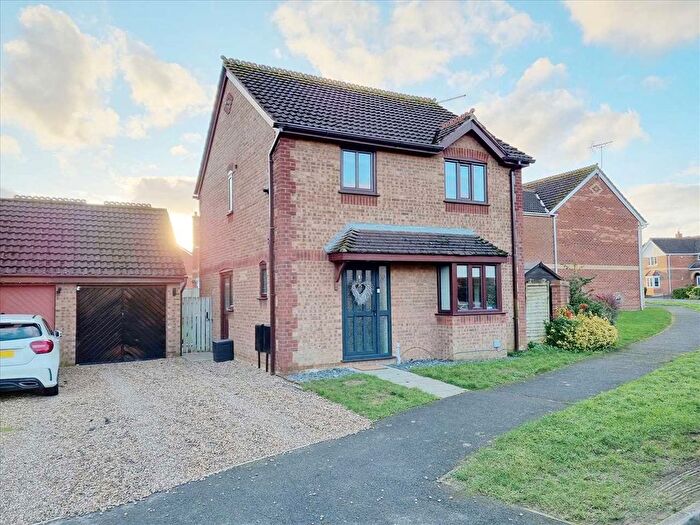
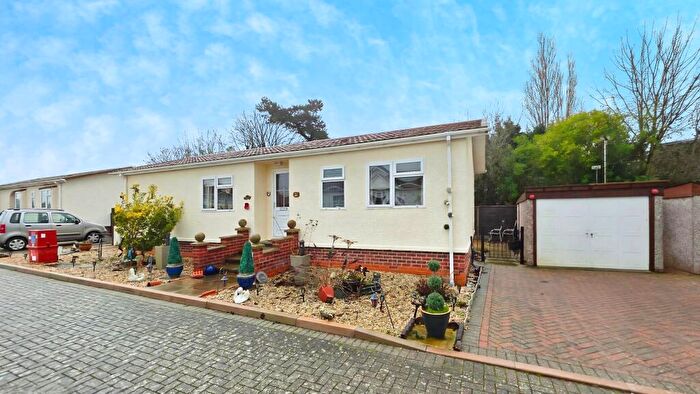
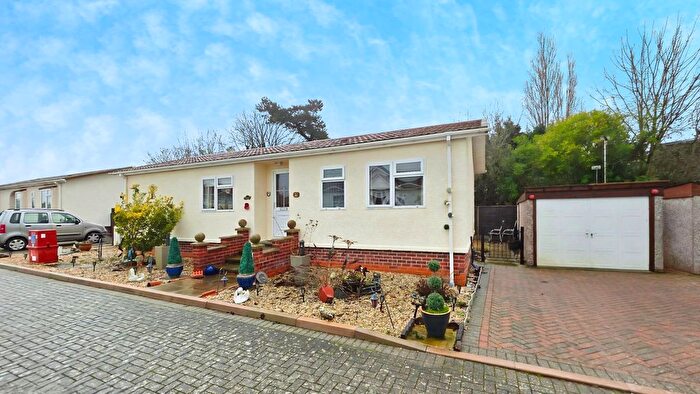
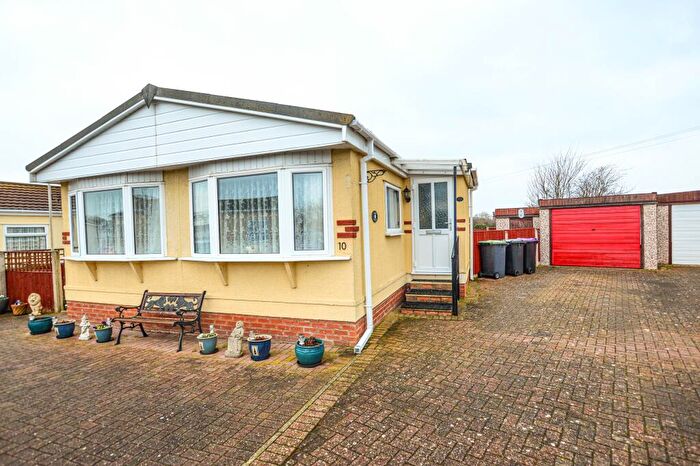
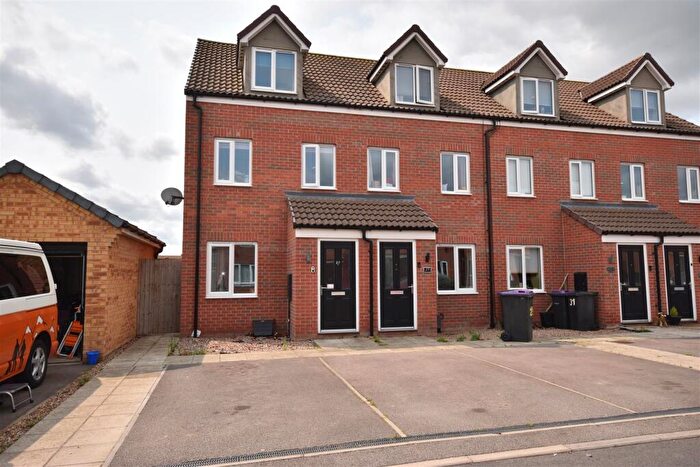
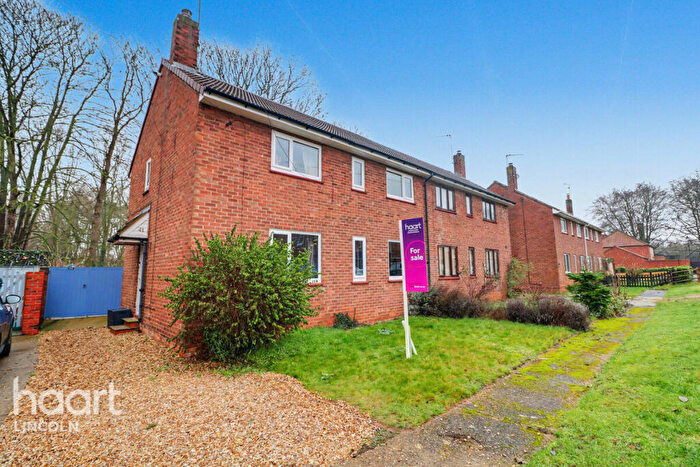
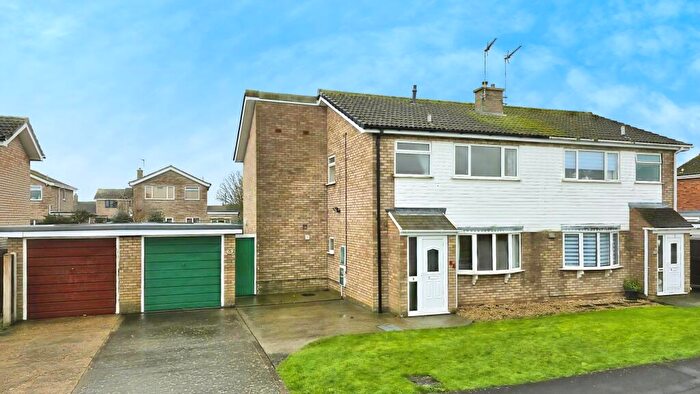
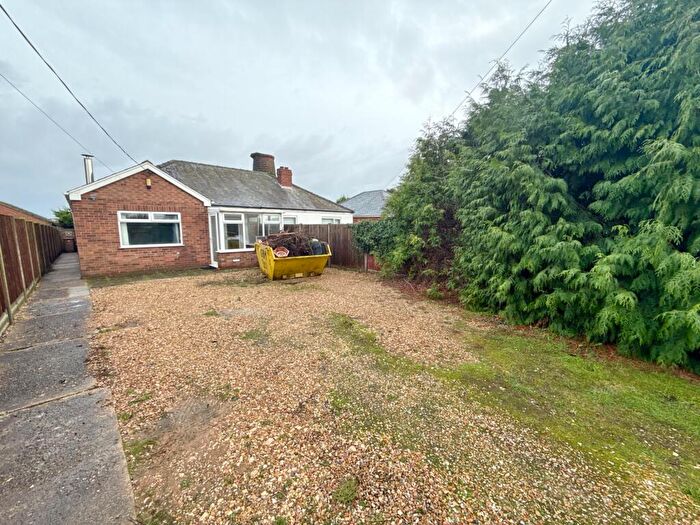
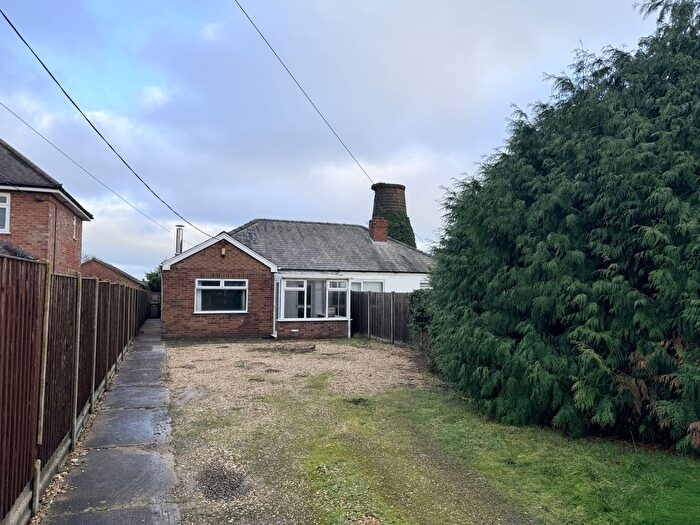
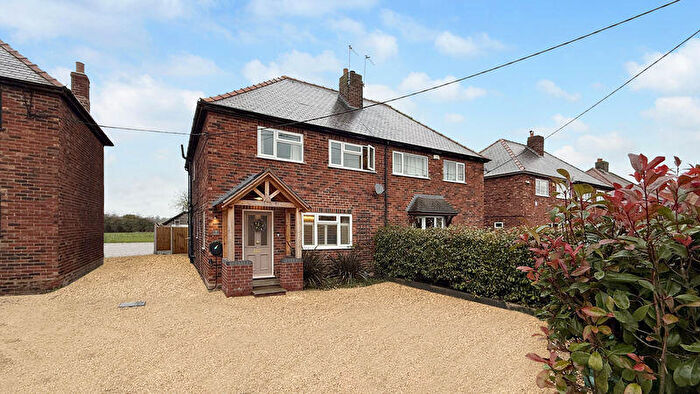
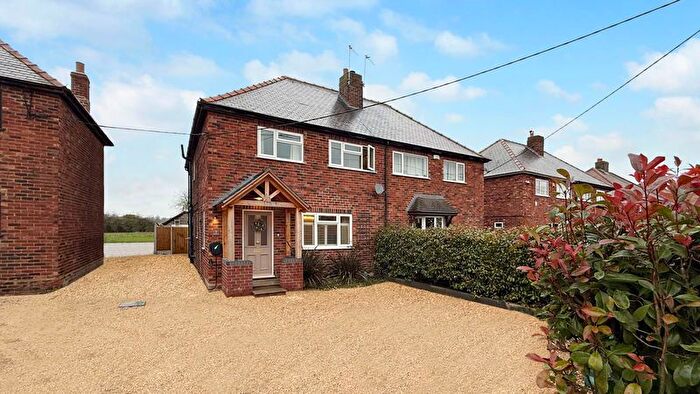
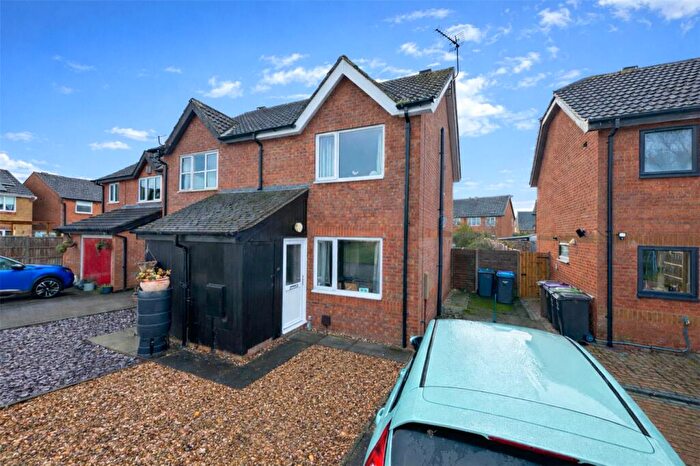
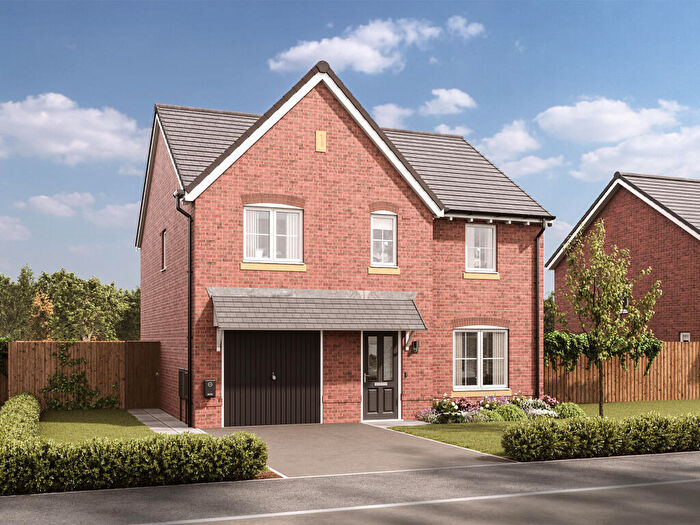
Properties for sale in Ashby De La Launde And Cranwell
Roads and Postcodes in Ashby De La Launde And Cranwell
Navigate through our locations to find the location of your next house in Ashby De La Launde And Cranwell, Lincoln for sale or to rent.
| Streets | Postcodes |
|---|---|
| Acre Lane | LN4 3PH |
| Almonds Green | LN4 3PW |
| Ashby Lodge Cottages | LN4 3JW |
| Beck Street | LN4 3NE |
| Beckside | LN4 3NX |
| Beech Grove | LN4 3YB |
| Bloxholm Lane | LN4 3BZ |
| Braemar Residential Park | LN4 3PD |
| Bridge Lane | LN4 3PB |
| Brookside | LN4 3PA |
| Chestnut Close | LN4 3LP |
| Church Avenue | LN4 3JQ |
| Church Lane | LN4 3PF |
| Church Row | LN4 3NS |
| Church Street | LN4 3LZ LN4 3NA |
| Church Walk | LN4 3QQ |
| Crane Court | LN4 3LJ |
| Cuckoo Lane | LN4 3LQ |
| Digby Fen | LN4 4DT |
| Digby Road | LN4 3LX LN4 3LT |
| Dixon Avenue | LN4 3PZ |
| Farriers Court | LN4 3PL |
| Fen Road | LN4 3NG LN4 3QB |
| Glebe Close | LN4 3NL |
| Harrowby Close | LN4 3NQ |
| Hawthorne Close | LN4 3YE |
| Heath Road | LN4 3JB LN4 3NU LN4 3BT |
| Heron Court | LN4 3TL |
| Hill Farm Cottage | LN4 3QE |
| Howard Road | LN4 3LN |
| Kingfisher Court | LN4 3LL |
| Lincoln Road | LN4 3NB LN4 3PT LN4 3JA |
| Linnet Court | LN4 3TP |
| Lowfields | LN4 3PR |
| Main Street | LN4 3JG LN4 3LU LN4 3NR LN4 3NW LN4 3PE LN4 3PX LN4 3QA |
| Maple Grove | LN4 3YA |
| Martin Court | LN4 3TW |
| Moor Lane | LN4 3QD |
| North Street | LN4 3LY |
| Peacock Lodge Cottages | LN4 3JJ |
| Playgarth Estate | LN4 3PY |
| Robin Court | LN4 3TN |
| Scargate Lane | LN4 3PG |
| Scopwick Heath | LN4 3DL |
| Sleaford Road | LN4 3PU |
| Spinney Lane | LN4 3YD |
| Springfield Estate | LN4 3NP |
| Station Road | LN4 3NF |
| Sycamore Close | LN4 3YF |
| Temple Grange | LN5 0AU LN5 0AX |
| The Granaries | LN4 3NJ |
| The Hurn | LN4 3NH |
| The Nurseries | LN4 3LR |
| The Oval | LN4 3JE |
| The Pinfold | LN4 3ND |
| The Row | LN4 3QG |
| Thomas A Becket Close | LN4 3GA |
| Thompsons Bottom | LN5 0DE |
| Timberland Road | LN4 3PQ |
| Trenchard Road | LN4 3JY |
| Vicarage Close | LN4 3YJ |
| Vicarage Lane | LN4 3NT |
| West Hill Court | LN4 3BU |
| Willow Close | LN4 3PJ |
| LN4 3JD LN4 3JF LN4 3JL LN4 3QF LN5 0DG LN5 0DH LN5 0DL LN4 3AT LN4 3JN LN4 3LH LN4 3PS LN5 0DF |
Transport near Ashby De La Launde And Cranwell
-
Metheringham Station
-
Ruskington Station
-
Sleaford Station
-
Rauceby Station
-
Ancaster Station
-
Heckington Station
- FAQ
- Price Paid By Year
- Property Type Price
Frequently asked questions about Ashby De La Launde And Cranwell
What is the average price for a property for sale in Ashby De La Launde And Cranwell?
The average price for a property for sale in Ashby De La Launde And Cranwell is £371,373. This amount is 56% higher than the average price in Lincoln. There are 2,061 property listings for sale in Ashby De La Launde And Cranwell.
What streets have the most expensive properties for sale in Ashby De La Launde And Cranwell?
The streets with the most expensive properties for sale in Ashby De La Launde And Cranwell are Brookside at an average of £663,750, Lincoln Road at an average of £548,500 and Digby Road at an average of £470,000.
What streets have the most affordable properties for sale in Ashby De La Launde And Cranwell?
The streets with the most affordable properties for sale in Ashby De La Launde And Cranwell are Church Street at an average of £176,000, The Hurn at an average of £202,100 and Farriers Court at an average of £215,250.
Which train stations are available in or near Ashby De La Launde And Cranwell?
Some of the train stations available in or near Ashby De La Launde And Cranwell are Metheringham, Ruskington and Sleaford.
Property Price Paid in Ashby De La Launde And Cranwell by Year
The average sold property price by year was:
| Year | Average Sold Price | Price Change |
Sold Properties
|
|---|---|---|---|
| 2025 | £347,216 | -4% |
25 Properties |
| 2024 | £359,750 | -16% |
30 Properties |
| 2023 | £416,738 | 13% |
21 Properties |
| 2022 | £361,665 | 1% |
36 Properties |
| 2021 | £357,763 | 21% |
47 Properties |
| 2020 | £282,564 | 7% |
29 Properties |
| 2019 | £261,480 | -4% |
32 Properties |
| 2018 | £272,831 | -6% |
30 Properties |
| 2017 | £290,173 | 12% |
26 Properties |
| 2016 | £256,674 | 2% |
30 Properties |
| 2015 | £252,418 | 21% |
19 Properties |
| 2014 | £198,474 | 5% |
28 Properties |
| 2013 | £187,726 | -27% |
26 Properties |
| 2012 | £238,541 | 15% |
24 Properties |
| 2011 | £202,402 | 5% |
24 Properties |
| 2010 | £192,062 | -0,5% |
28 Properties |
| 2009 | £193,022 | -32% |
35 Properties |
| 2008 | £253,972 | 16% |
20 Properties |
| 2007 | £213,625 | 5% |
43 Properties |
| 2006 | £203,660 | -7% |
28 Properties |
| 2005 | £217,880 | 21% |
39 Properties |
| 2004 | £172,343 | 9% |
40 Properties |
| 2003 | £157,480 | 27% |
55 Properties |
| 2002 | £114,299 | 17% |
61 Properties |
| 2001 | £94,567 | 8% |
58 Properties |
| 2000 | £87,347 | 14% |
44 Properties |
| 1999 | £74,720 | 14% |
40 Properties |
| 1998 | £64,055 | -16% |
34 Properties |
| 1997 | £74,027 | 14% |
33 Properties |
| 1996 | £63,302 | 6% |
17 Properties |
| 1995 | £59,787 | - |
24 Properties |
Property Price per Property Type in Ashby De La Launde And Cranwell
Here you can find historic sold price data in order to help with your property search.
The average Property Paid Price for specific property types in the last three years are:
| Property Type | Average Sold Price | Sold Properties |
|---|---|---|
| Semi Detached House | £237,352.00 | 21 Semi Detached Houses |
| Detached House | £446,846.00 | 49 Detached Houses |
| Terraced House | £224,083.00 | 6 Terraced Houses |

