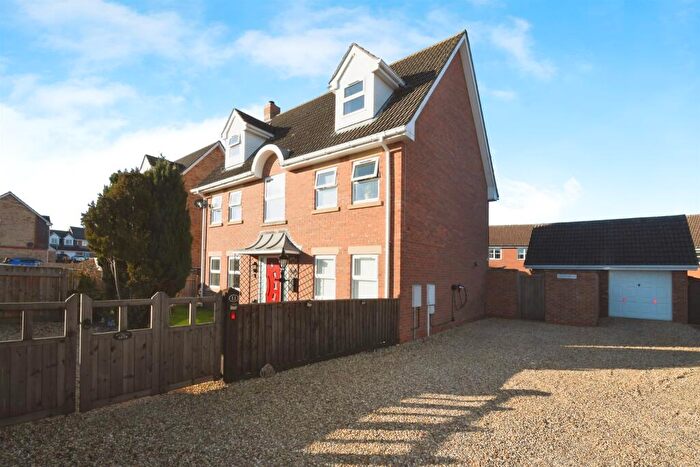
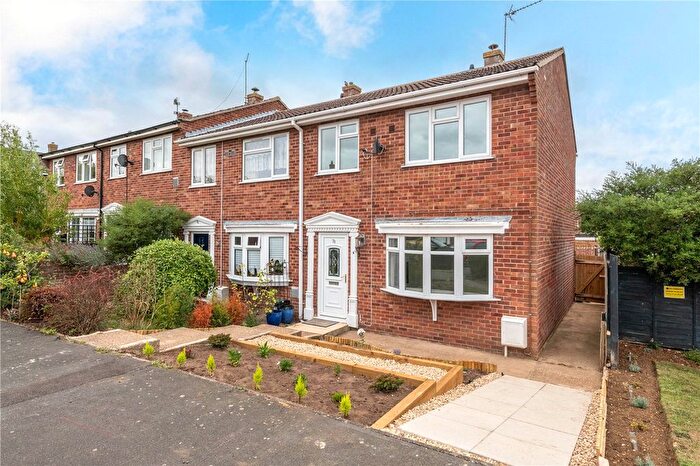
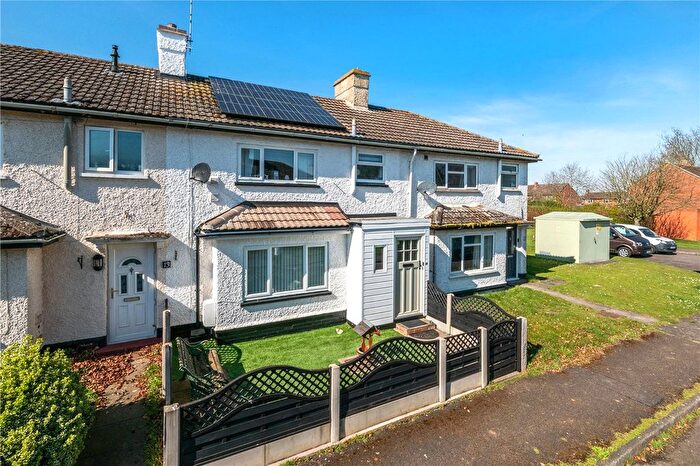
Houses for sale & to rent in Ashby De La Launde And Cranwell, Sleaford
House Prices in Ashby De La Launde And Cranwell
Properties in Ashby De La Launde And Cranwell have an average house price of £196,671.00 and had 101 Property Transactions within the last 3 years¹.
Ashby De La Launde And Cranwell is an area in Sleaford, Lincolnshire with 1,010 households², where the most expensive property was sold for £450,000.00.
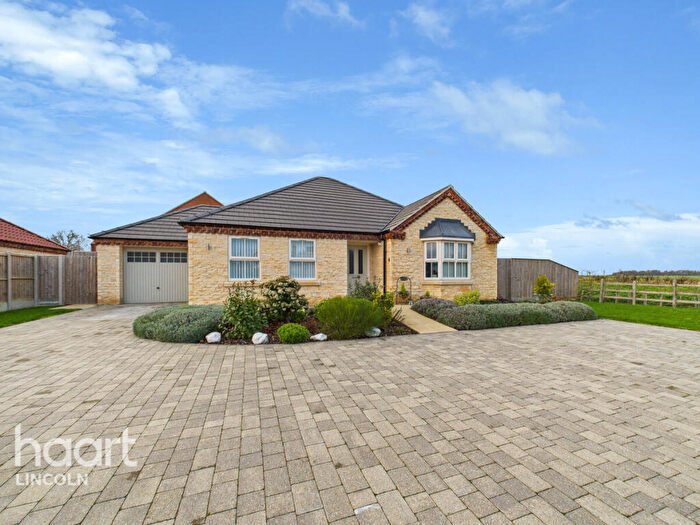
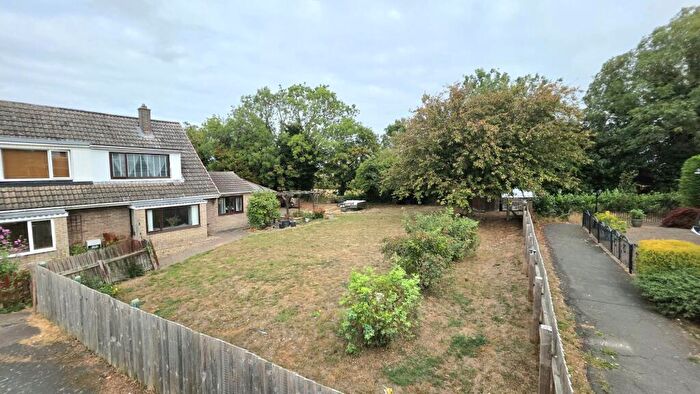
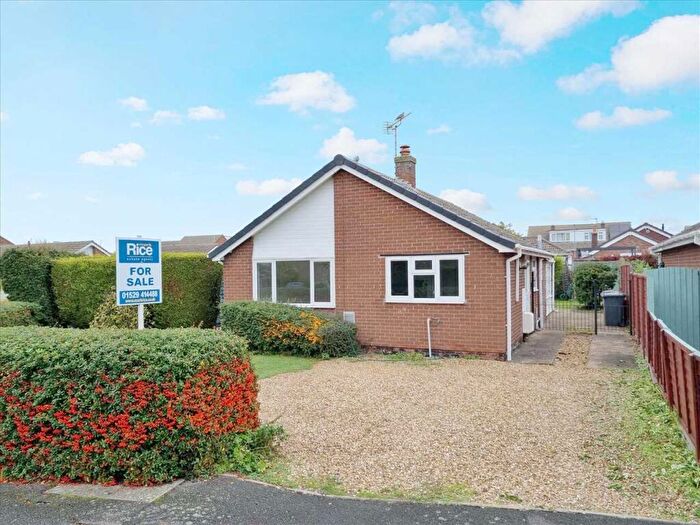
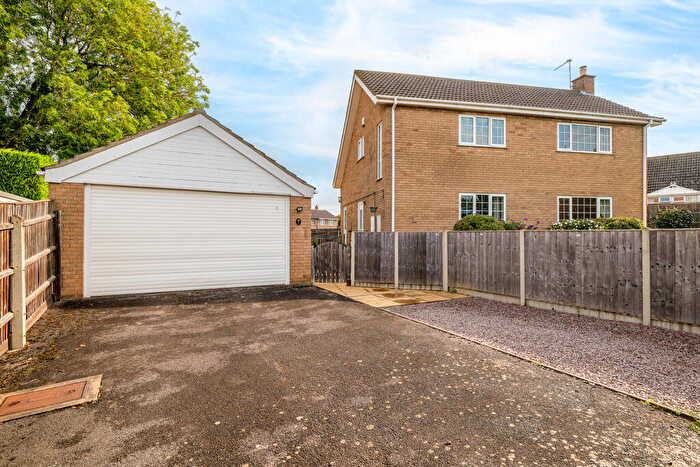
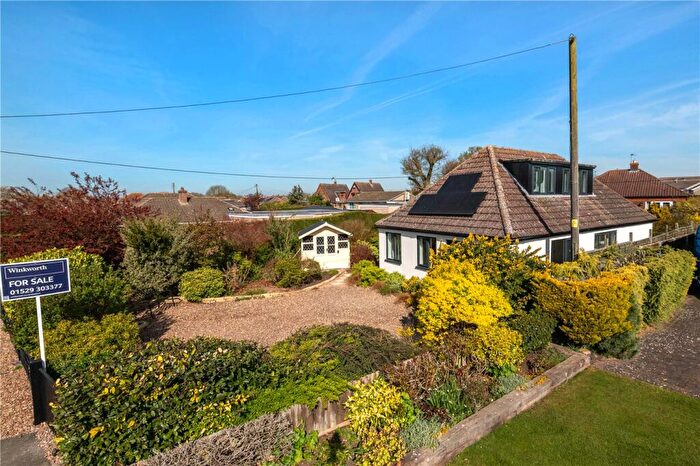
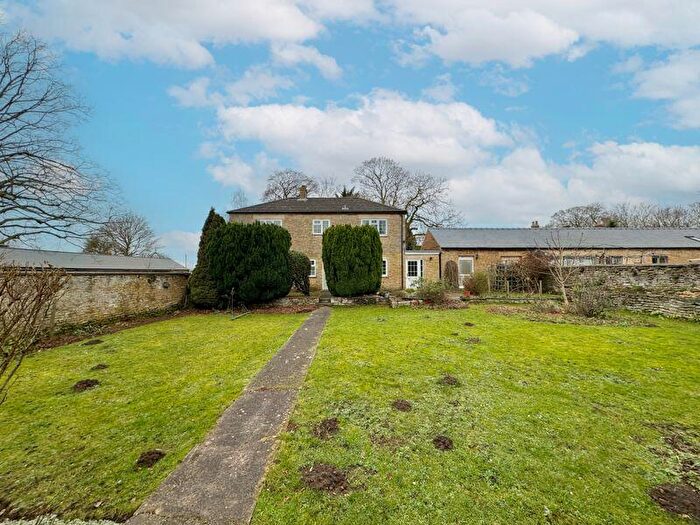
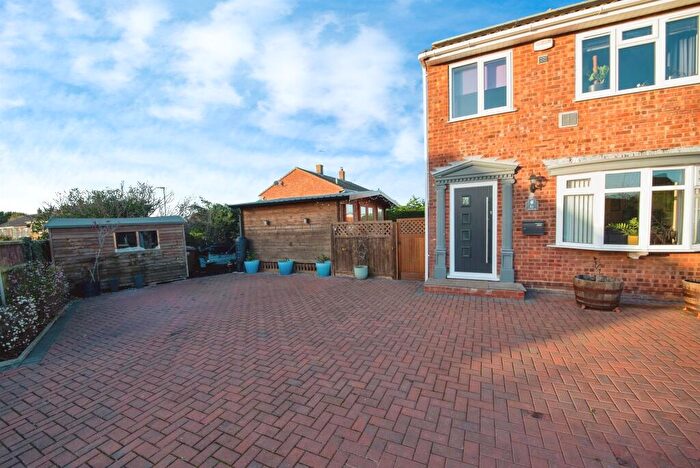
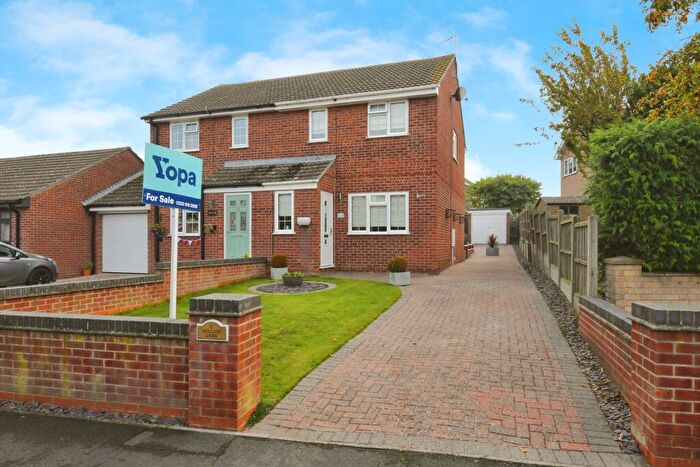
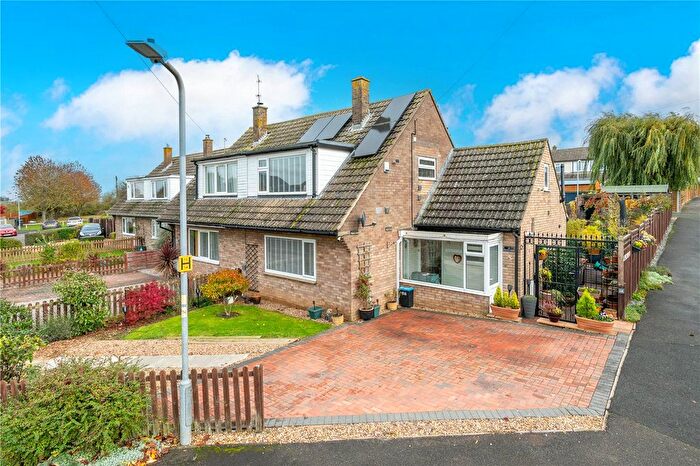
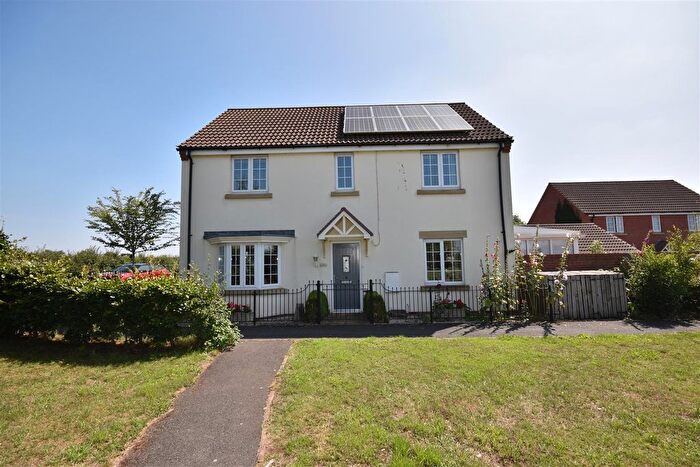
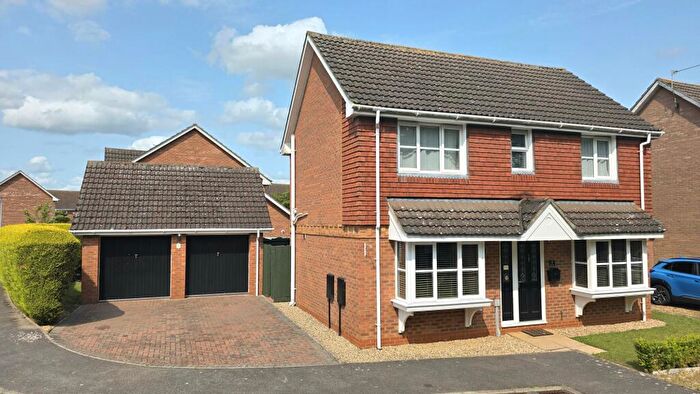
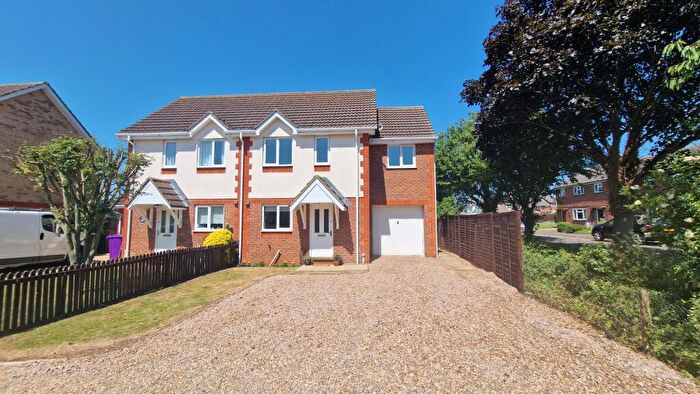
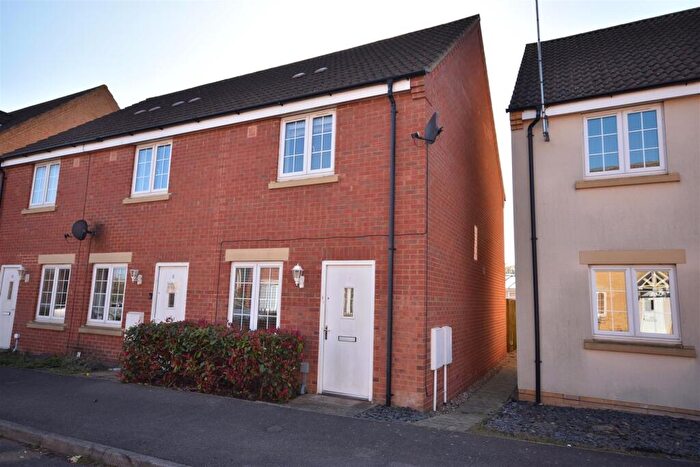
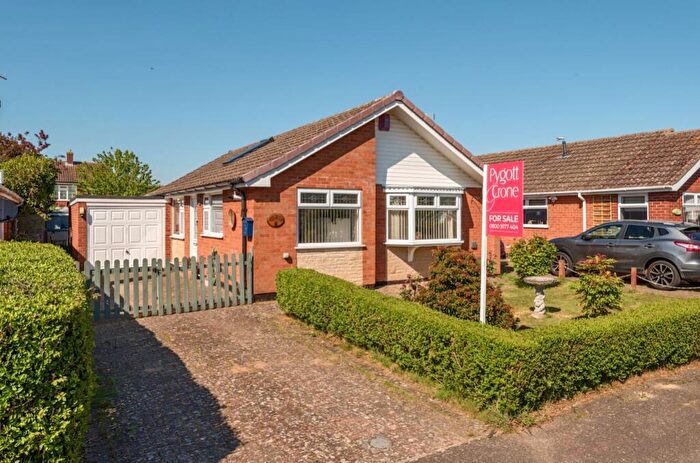
Properties for sale in Ashby De La Launde And Cranwell
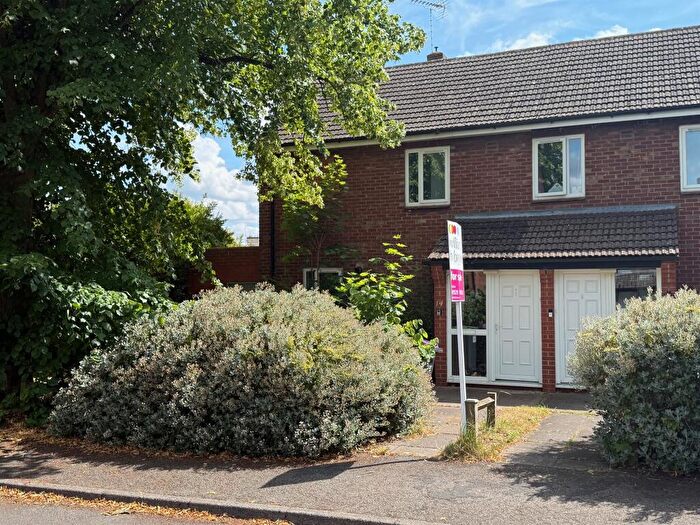
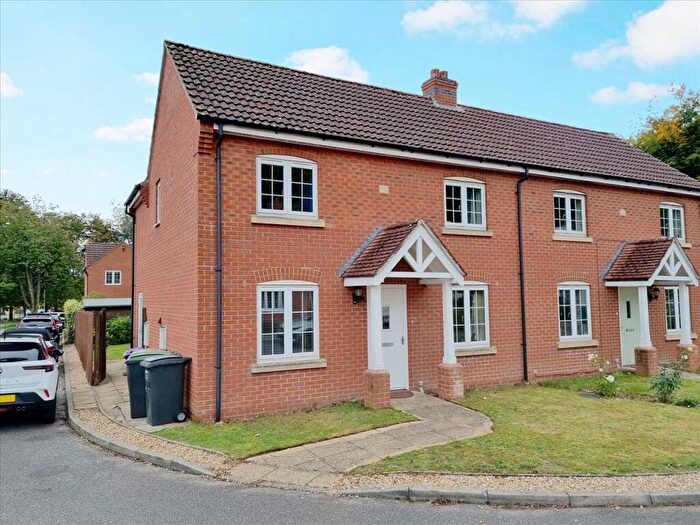
Previously listed properties in Ashby De La Launde And Cranwell
Roads and Postcodes in Ashby De La Launde And Cranwell
Navigate through our locations to find the location of your next house in Ashby De La Launde And Cranwell, Sleaford for sale or to rent.
| Streets | Postcodes |
|---|---|
| Airship Road | NG34 8RW |
| Baghdad Road | NG34 8HJ |
| Beacon Road | NG34 8RP |
| Beagle Lane | NG34 8EG |
| Beech Close | NG34 8HS |
| Brauncewell Road | NG34 8RN |
| Bristol House Road | NG34 8EB |
| Bristow Road | NG34 8FG |
| Byards Leap | NG34 8EZ |
| Cherry Tree Crescent | NG34 8GS |
| Chestnut Avenue | NG34 8HT |
| Church Cottage | NG34 8RQ |
| College Road | NG34 8DJ NG34 8DL NG34 8DN NG34 8DP NG34 8DU |
| Crane Close | NG34 8DW |
| Cranwell Avenue | NG34 8HG NG34 8HE |
| De Gaunt Drive | NG34 8BZ |
| De Gravel Drive | NG34 8XF |
| Delhi Square | NG34 8HL NG34 8HN |
| Eastchurch Road | NG34 8HY |
| Eastview Close | NG34 8FR |
| Edmunds Road | NG34 8EL NG34 8EP |
| Farriers Gate | NG34 8NT |
| Flowerdown Avenue | NG34 8HZ |
| Frank Whittle Close | NG34 8FH |
| Guthram Court | NG34 8DA |
| Harrington Rise | NG34 8XH |
| High Dyke Road | NG34 8EJ |
| Hill Crest | NG34 8EQ |
| Home Park | NG34 8DH |
| Ison Close | NG34 8FJ |
| Joel Square | NG34 8RR |
| Laburnum Road | NG34 8EH |
| Larch Green | NG34 8EE |
| Lime Close | NG34 8HX |
| Longcroft Drive | NG34 8EA |
| Malcolm Avenue | NG34 8ED |
| Manor Close | NG34 8FP |
| North Drive | NG34 8HU |
| North Road | NG34 8DG |
| Old School Lane | NG34 8DF |
| Plantation Road | NG34 8DX |
| Primrose Lane | NG34 8DZ |
| Rauceby Lane | NG34 8GR |
| Selvayns Drive | NG34 8EN |
| Sleaford Road | NG34 8BU NG34 8BY NG34 8DD |
| St Benedicts Close | NG34 8DB |
| St Catherines Avenue | NG34 8XD |
| St Christophers Close | NG34 8XB |
| St Georges Close | NG34 8XE |
| St Johns Close | NG34 8DT |
| St Martins Close | NG34 8XA |
| Stonecross Road | NG34 8FN |
| Stratten Close | NG34 8EF |
| Sycamore Drive | NG34 8HP NG34 8HR |
| The Sidings | NG34 8FB |
| The Willows | NG34 8XG |
| Thorold Avenue | NG34 8DR NG34 8DS |
| West Avenue | NG34 8HA |
| Western Approach | NG34 8HW |
| Westside Road | NG34 8FL |
| Willow Lane | NG34 8DE NG34 8DQ |
| Wylson Close | NG34 8EW |
| York Road | NG34 8DY |
| NG34 8RH NG34 8RJ NG34 8RL NG34 8HB NG34 8HD NG34 8HH |
Transport near Ashby De La Launde And Cranwell
- FAQ
- Price Paid By Year
- Property Type Price
Frequently asked questions about Ashby De La Launde And Cranwell
What is the average price for a property for sale in Ashby De La Launde And Cranwell?
The average price for a property for sale in Ashby De La Launde And Cranwell is £196,671. This amount is 21% lower than the average price in Sleaford. There are 173 property listings for sale in Ashby De La Launde And Cranwell.
What streets have the most expensive properties for sale in Ashby De La Launde And Cranwell?
The streets with the most expensive properties for sale in Ashby De La Launde And Cranwell are St Martins Close at an average of £382,000, Home Park at an average of £326,250 and Harrington Rise at an average of £324,000.
What streets have the most affordable properties for sale in Ashby De La Launde And Cranwell?
The streets with the most affordable properties for sale in Ashby De La Launde And Cranwell are Eastchurch Road at an average of £119,594, Delhi Square at an average of £128,500 and Thorold Avenue at an average of £138,000.
Which train stations are available in or near Ashby De La Launde And Cranwell?
Some of the train stations available in or near Ashby De La Launde And Cranwell are Rauceby, Ruskington and Sleaford.
Property Price Paid in Ashby De La Launde And Cranwell by Year
The average sold property price by year was:
| Year | Average Sold Price | Price Change |
Sold Properties
|
|---|---|---|---|
| 2025 | £201,500 | 5% |
18 Properties |
| 2024 | £191,368 | -18% |
25 Properties |
| 2023 | £225,234 | 18% |
19 Properties |
| 2022 | £183,926 | 4% |
39 Properties |
| 2021 | £176,642 | -2% |
40 Properties |
| 2020 | £179,498 | 2% |
39 Properties |
| 2019 | £175,628 | 8% |
42 Properties |
| 2018 | £162,102 | 6% |
43 Properties |
| 2017 | £151,976 | -6% |
32 Properties |
| 2016 | £160,974 | 24% |
41 Properties |
| 2015 | £122,851 | -16% |
38 Properties |
| 2014 | £142,510 | 8% |
41 Properties |
| 2013 | £131,212 | -23% |
33 Properties |
| 2012 | £161,940 | 10% |
26 Properties |
| 2011 | £145,193 | 4% |
33 Properties |
| 2010 | £139,616 | 16% |
40 Properties |
| 2009 | £116,724 | -39% |
33 Properties |
| 2008 | £161,902 | 7% |
25 Properties |
| 2007 | £149,785 | 18% |
54 Properties |
| 2006 | £123,484 | 3% |
44 Properties |
| 2005 | £119,228 | -4% |
40 Properties |
| 2004 | £123,809 | 7% |
59 Properties |
| 2003 | £115,118 | 21% |
72 Properties |
| 2002 | £91,310 | 30% |
72 Properties |
| 2001 | £64,148 | -6% |
55 Properties |
| 2000 | £68,308 | 3% |
95 Properties |
| 1999 | £66,567 | 37% |
85 Properties |
| 1998 | £41,821 | 18% |
35 Properties |
| 1997 | £34,267 | -27% |
29 Properties |
| 1996 | £43,616 | 13% |
21 Properties |
| 1995 | £37,828 | - |
28 Properties |
Property Price per Property Type in Ashby De La Launde And Cranwell
Here you can find historic sold price data in order to help with your property search.
The average Property Paid Price for specific property types in the last three years are:
| Property Type | Average Sold Price | Sold Properties |
|---|---|---|
| Semi Detached House | £179,709.00 | 31 Semi Detached Houses |
| Detached House | £273,357.00 | 32 Detached Houses |
| Terraced House | £145,929.00 | 38 Terraced Houses |

