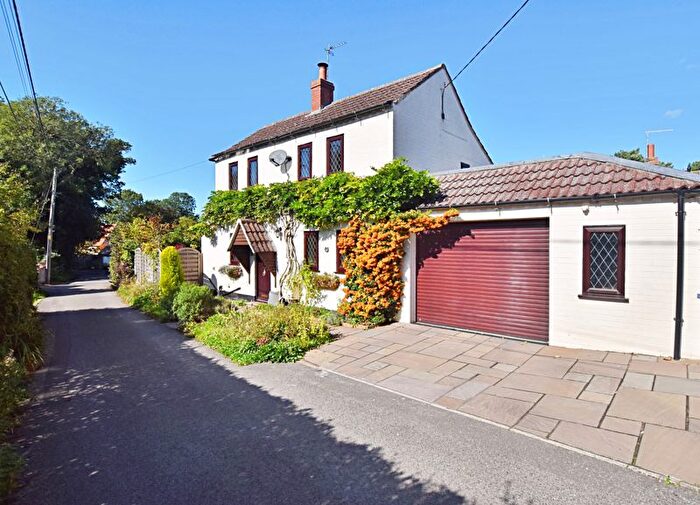
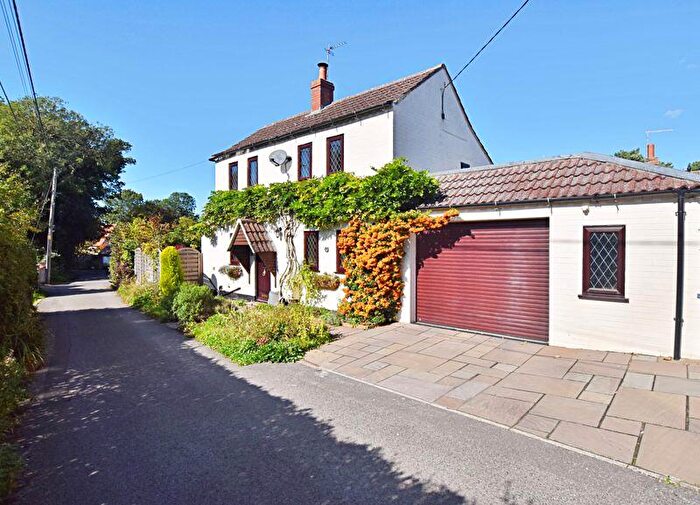
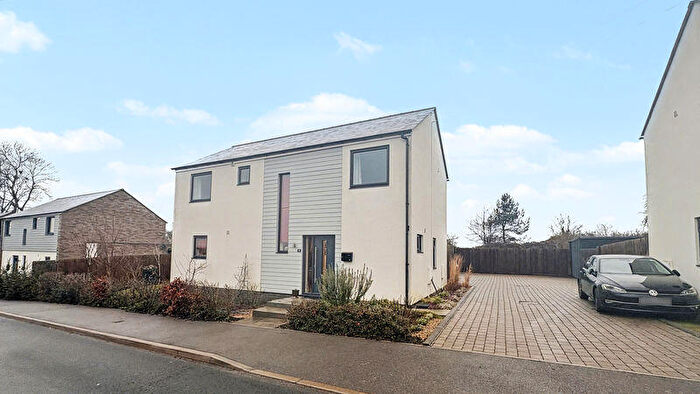
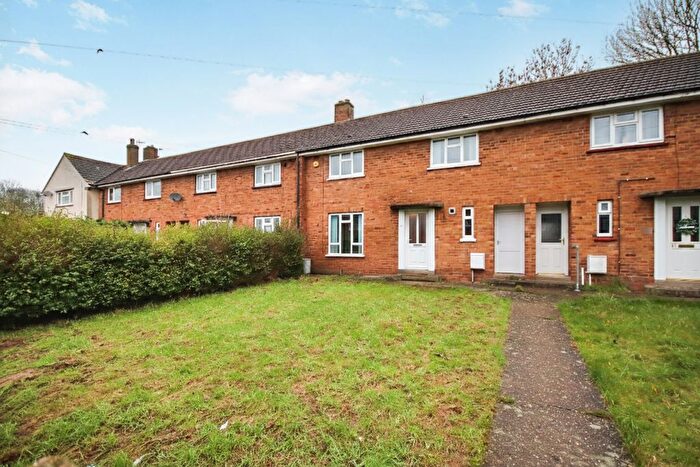
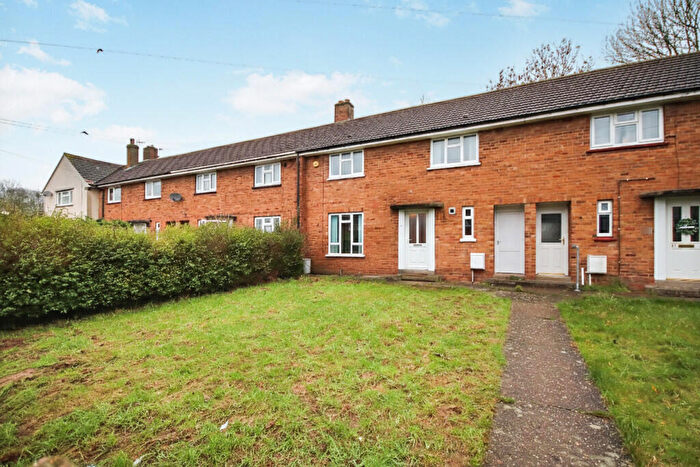
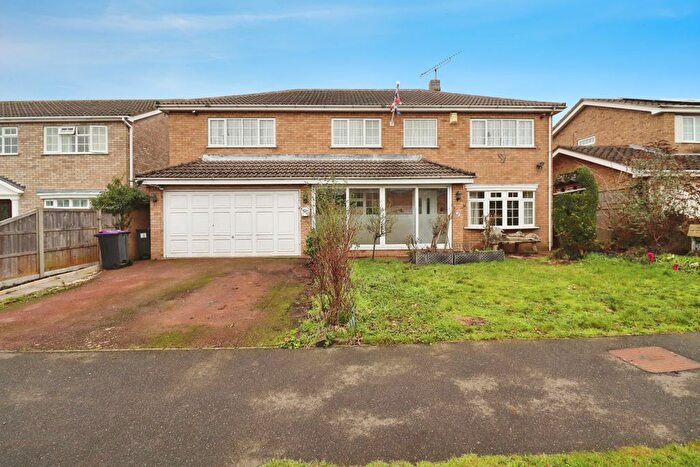
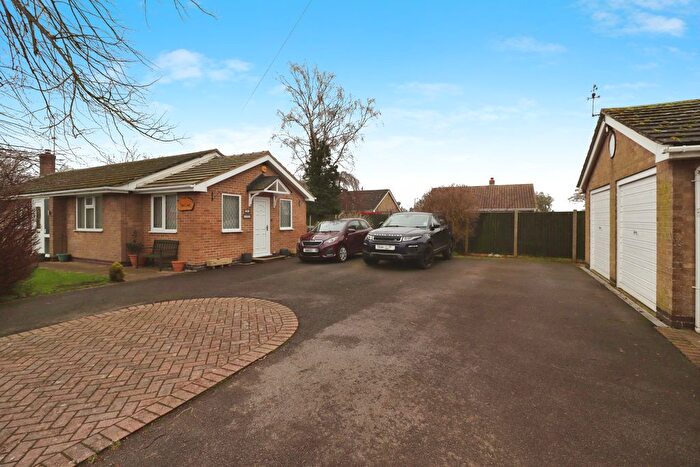
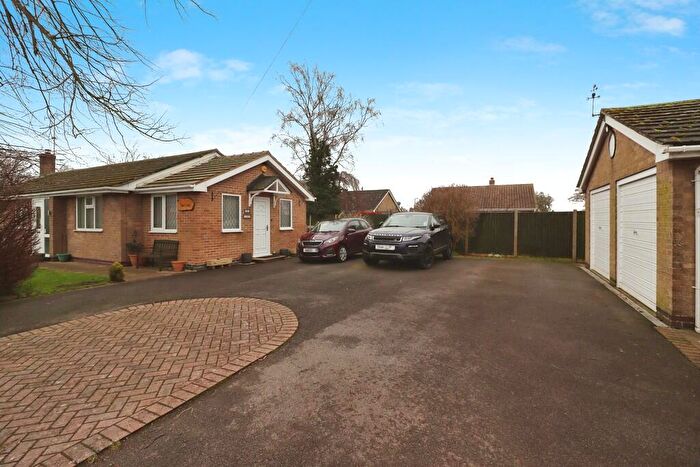
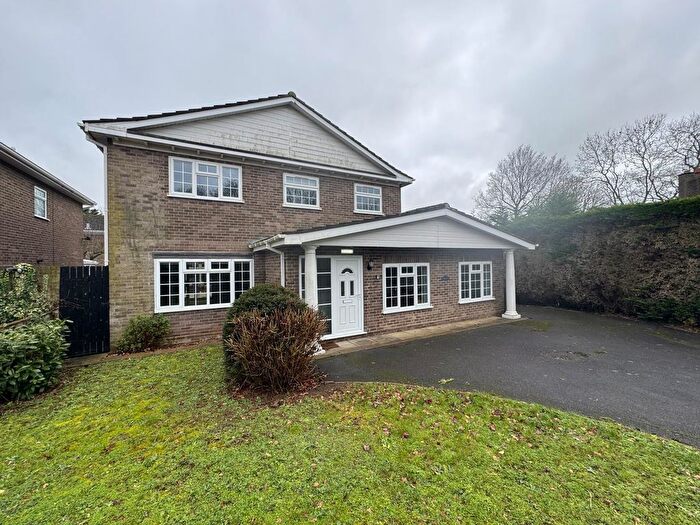
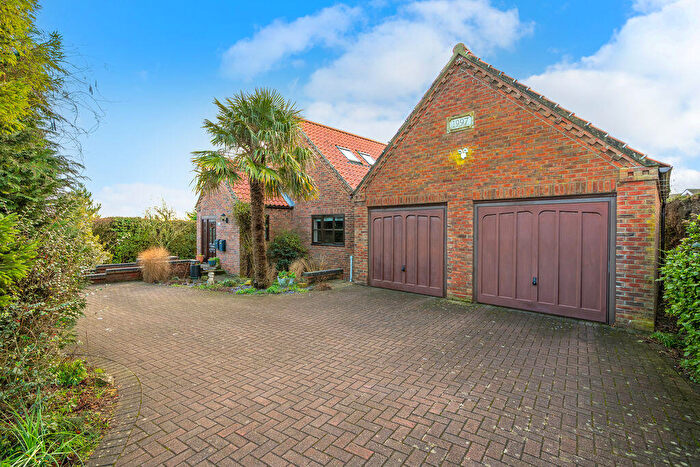
Houses for sale & to rent in Fiskerton, Lincoln
House Prices in Fiskerton
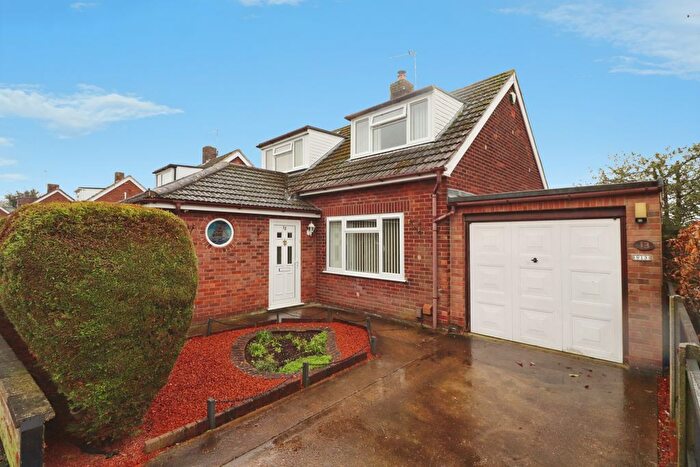
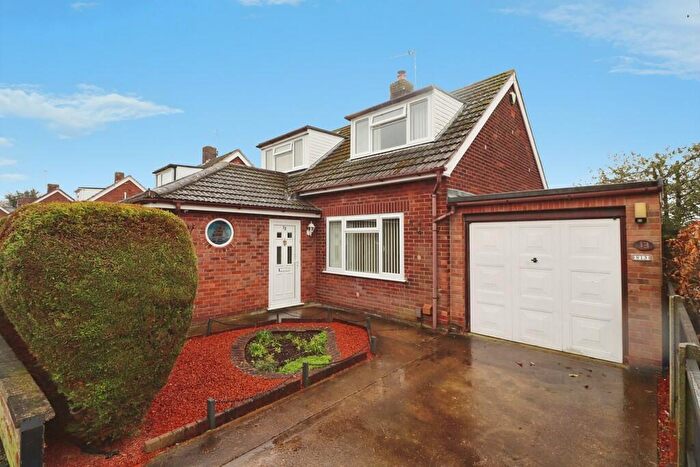
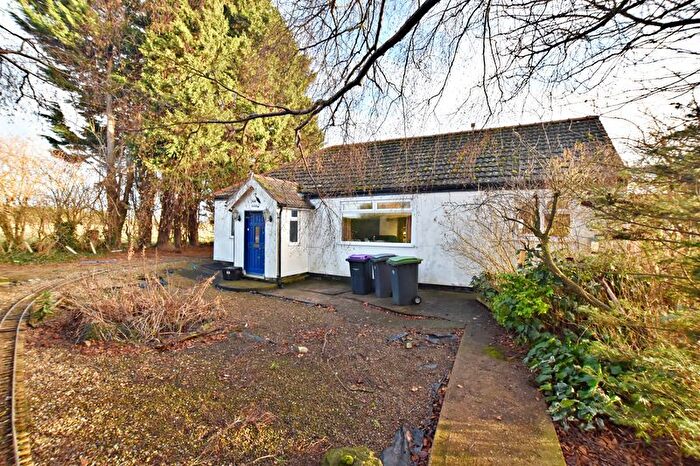
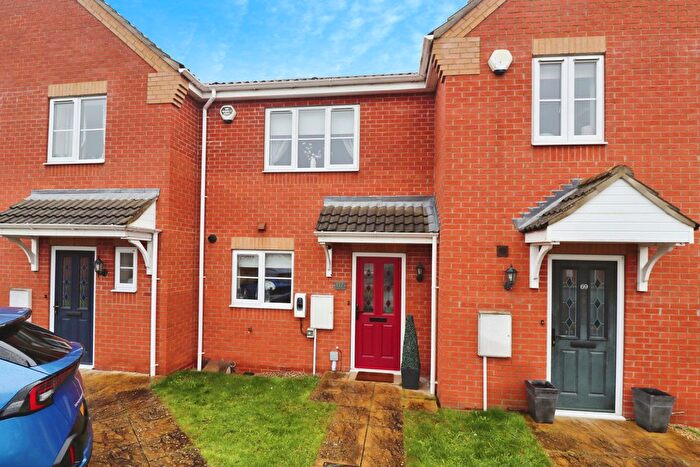
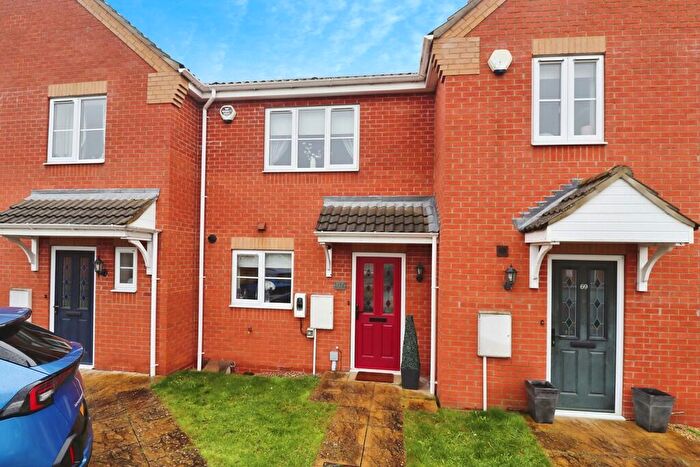
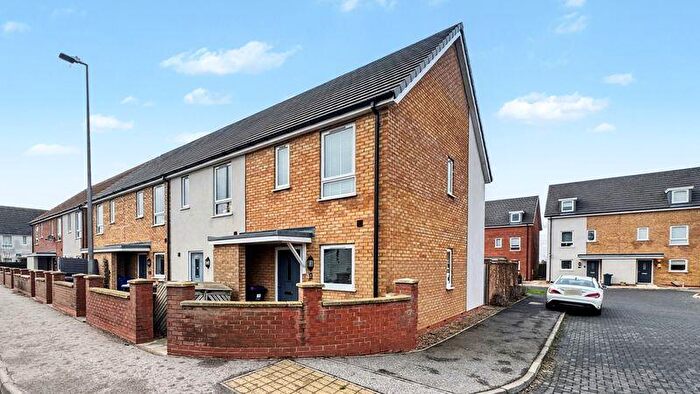
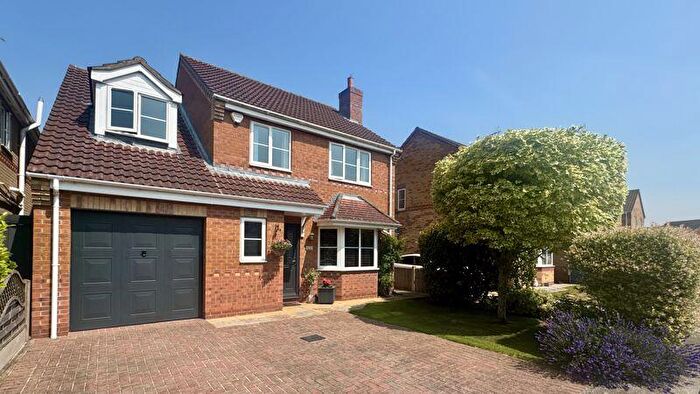
Properties in Fiskerton have an average house price of £276,935.00 and had 47 Property Transactions within the last 3 years¹.
Fiskerton is an area in Lincoln, Lincolnshire with 706 households², where the most expensive property was sold for £1,150,000.00.
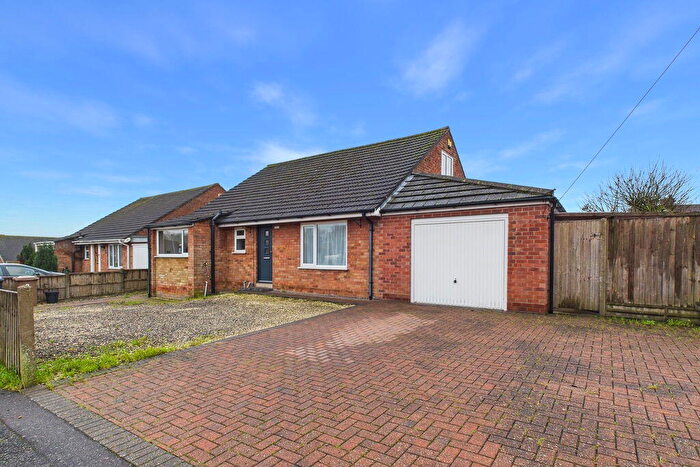
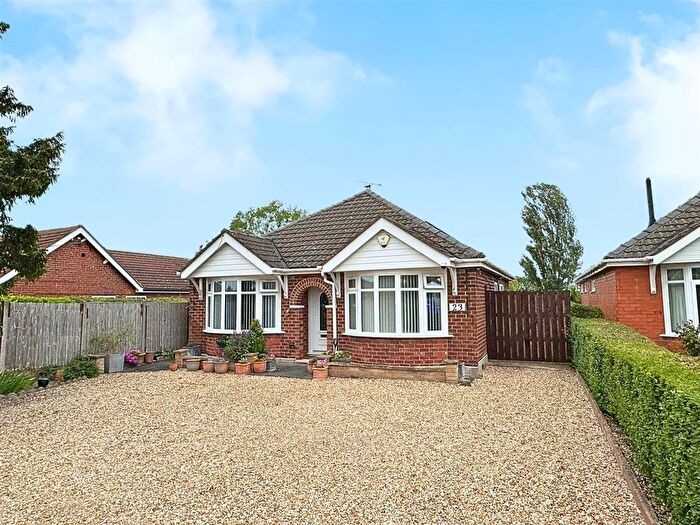
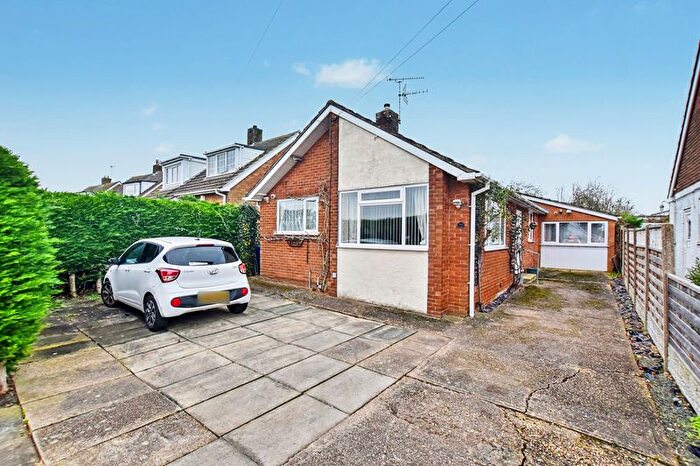
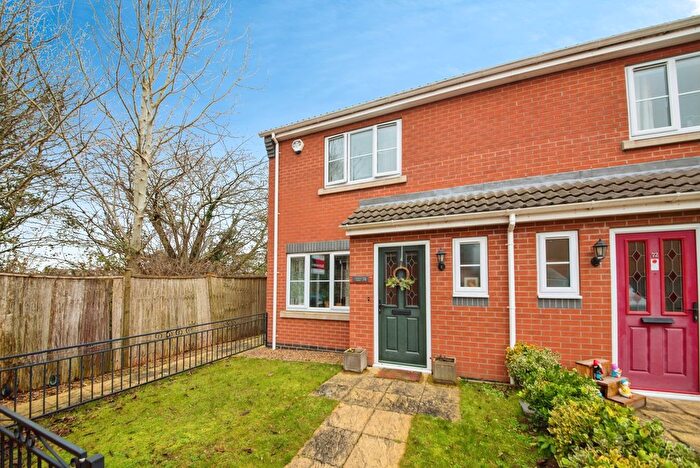
Properties for sale in Fiskerton
Roads and Postcodes in Fiskerton
Navigate through our locations to find the location of your next house in Fiskerton, Lincoln for sale or to rent.
| Streets | Postcodes |
|---|---|
| Ash Holt Close | LN3 4GF |
| Bakehouse Court | LN3 5BP |
| Barlings Close | LN3 5DE |
| Barlings Lane | LN3 5DA LN3 5DF |
| Blacksmith Road | LN3 4HE |
| Chapel Road | LN3 4HD |
| Church View Crescent | LN3 4HL |
| Corn Close | LN3 4UT |
| Ferry Road | LN3 4HH LN3 4HU LN3 4HW |
| Ferryside | LN3 4HP |
| Ferryside Gardens | LN3 4HS |
| Hall Lane | LN3 4HT |
| High Meadows | LN3 4HB |
| High Street | LN3 4ES LN3 4HF |
| Holmfield | LN3 4GD |
| Lincoln Road | LN3 4EP LN3 4ET LN3 4EU |
| Main Road | LN3 5BJ |
| Meadow Bank Avenue | LN3 4HJ |
| Moor Lane | LN3 4EG |
| Nelson Road | LN3 4ER |
| Nursery Close | LN3 5BU |
| Odd Fellows Lane | LN3 5BS |
| Orchard Road | LN3 4EX |
| Oxeney Drive | LN3 5DD |
| Plough Lane | LN3 4EY |
| Priory Drive | LN3 4HY |
| Reepham Road | LN3 4EZ |
| Ridings Close | LN3 4FE |
| Scothern Lane | LN3 5BH |
| St Clements Drive | LN3 4HN |
| St Hughs Drive | LN3 5DB |
| Station Road | LN3 5BB LN3 5BD |
| The Close | LN3 4HG |
| The Crescent | LN3 4HQ |
| The Holt | LN3 4HX |
| Water Hill | LN3 4GE |
| Woodside Cottages | LN3 5DQ |
| Wragby Road | LN3 5DH |
| LN3 5BL LN3 5BN LN3 5BW LN3 5DG |
Transport near Fiskerton
- FAQ
- Price Paid By Year
- Property Type Price
Frequently asked questions about Fiskerton
What is the average price for a property for sale in Fiskerton?
The average price for a property for sale in Fiskerton is £276,935. This amount is 16% higher than the average price in Lincoln. There are 752 property listings for sale in Fiskerton.
What streets have the most expensive properties for sale in Fiskerton?
The streets with the most expensive properties for sale in Fiskerton are Woodside Cottages at an average of £1,150,000, Blacksmith Road at an average of £462,750 and Lincoln Road at an average of £325,000.
What streets have the most affordable properties for sale in Fiskerton?
The streets with the most affordable properties for sale in Fiskerton are Bakehouse Court at an average of £137,500, High Meadows at an average of £163,000 and Scothern Lane at an average of £170,000.
Which train stations are available in or near Fiskerton?
Some of the train stations available in or near Fiskerton are Lincoln Central, Metheringham and Hykeham.
Property Price Paid in Fiskerton by Year
The average sold property price by year was:
| Year | Average Sold Price | Price Change |
Sold Properties
|
|---|---|---|---|
| 2025 | £284,861 | 6% |
18 Properties |
| 2024 | £266,957 | -3% |
13 Properties |
| 2023 | £276,125 | 4% |
16 Properties |
| 2022 | £266,277 | -1% |
22 Properties |
| 2021 | £268,090 | 22% |
33 Properties |
| 2020 | £210,438 | 4% |
21 Properties |
| 2019 | £202,779 | -17% |
33 Properties |
| 2018 | £237,498 | -7% |
34 Properties |
| 2017 | £254,306 | 24% |
24 Properties |
| 2016 | £193,643 | -2% |
23 Properties |
| 2015 | £197,866 | 12% |
15 Properties |
| 2014 | £174,301 | -9% |
33 Properties |
| 2013 | £190,618 | 27% |
19 Properties |
| 2012 | £139,826 | -11% |
13 Properties |
| 2011 | £155,116 | -11% |
21 Properties |
| 2010 | £172,047 | 15% |
19 Properties |
| 2009 | £145,961 | -10% |
17 Properties |
| 2008 | £160,541 | -9% |
12 Properties |
| 2007 | £175,632 | 11% |
29 Properties |
| 2006 | £156,643 | -23% |
39 Properties |
| 2005 | £192,515 | 13% |
26 Properties |
| 2004 | £166,691 | 14% |
52 Properties |
| 2003 | £142,653 | 6% |
58 Properties |
| 2002 | £133,764 | 36% |
41 Properties |
| 2001 | £85,722 | 24% |
24 Properties |
| 2000 | £65,321 | -0,2% |
30 Properties |
| 1999 | £65,454 | 1% |
22 Properties |
| 1998 | £64,675 | 18% |
22 Properties |
| 1997 | £53,270 | 5% |
24 Properties |
| 1996 | £50,510 | -19% |
25 Properties |
| 1995 | £60,323 | - |
18 Properties |
Property Price per Property Type in Fiskerton
Here you can find historic sold price data in order to help with your property search.
The average Property Paid Price for specific property types in the last three years are:
| Property Type | Average Sold Price | Sold Properties |
|---|---|---|
| Semi Detached House | £204,064.00 | 7 Semi Detached Houses |
| Detached House | £318,606.00 | 33 Detached Houses |
| Terraced House | £153,357.00 | 7 Terraced Houses |

