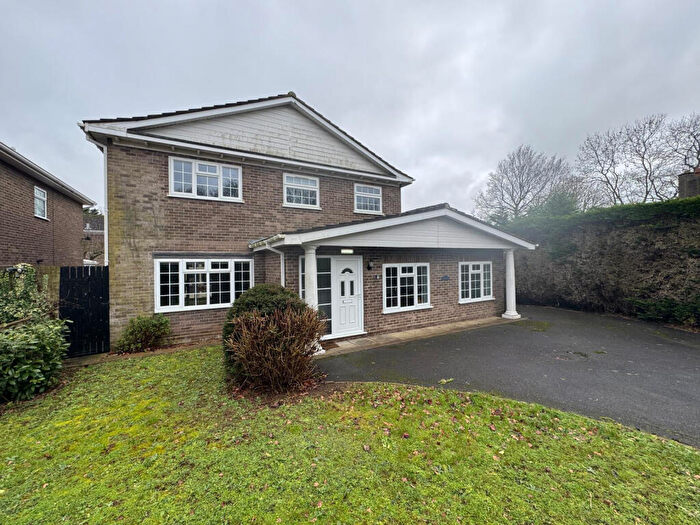
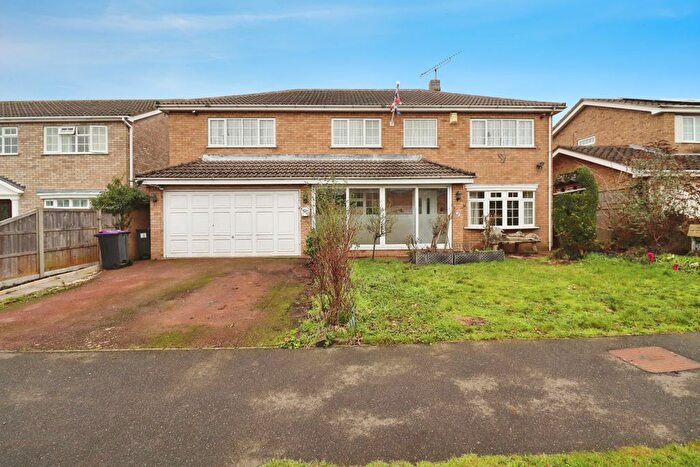
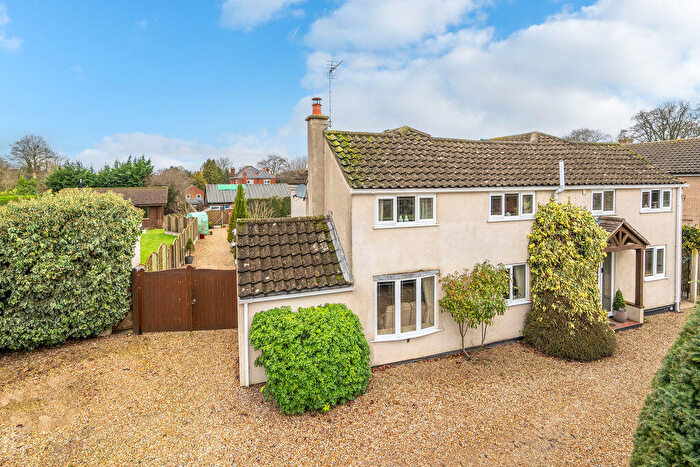
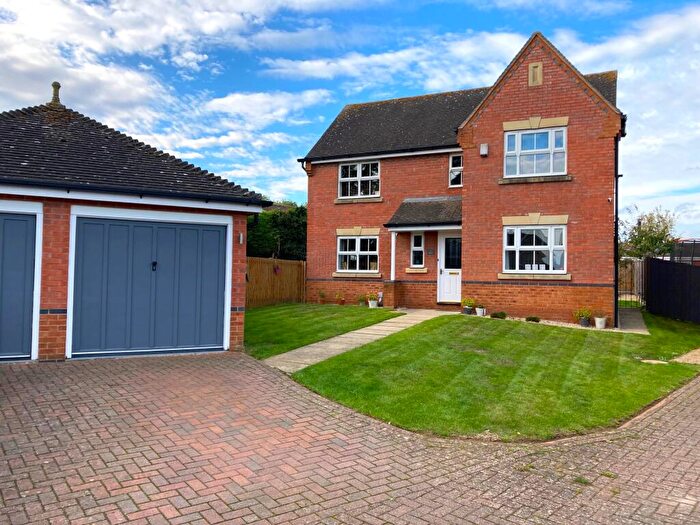
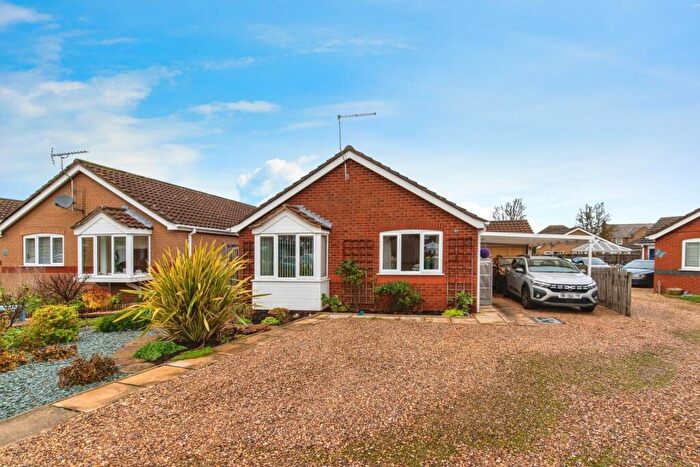
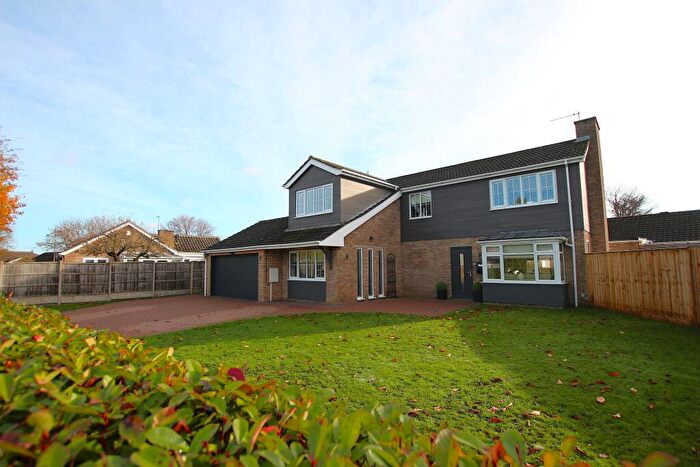
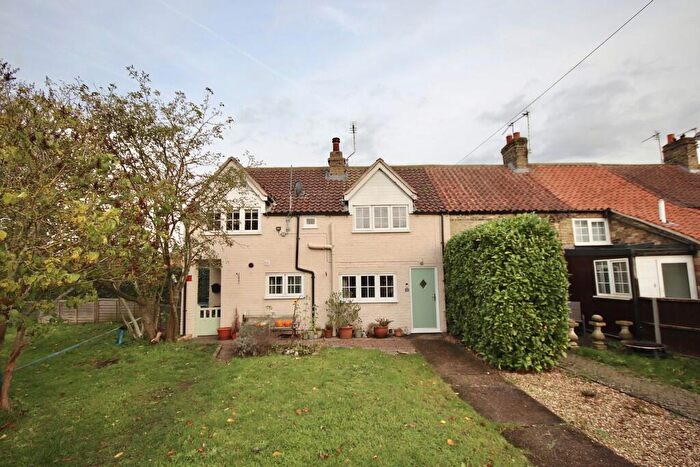
Houses for sale & to rent in Sudbrooke, Lincoln
House Prices in Sudbrooke
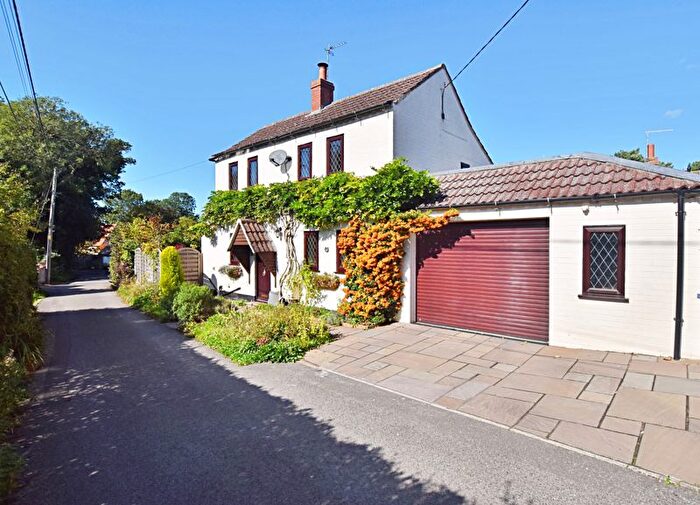
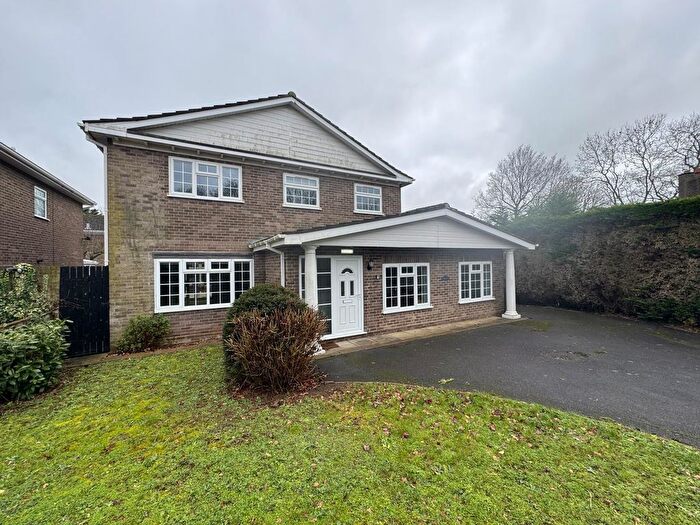
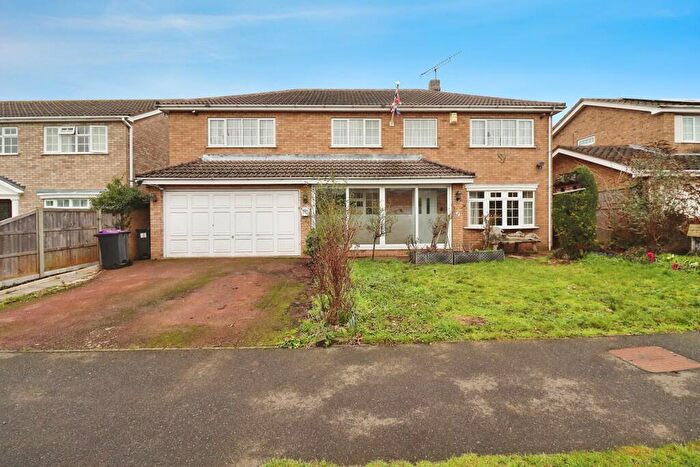
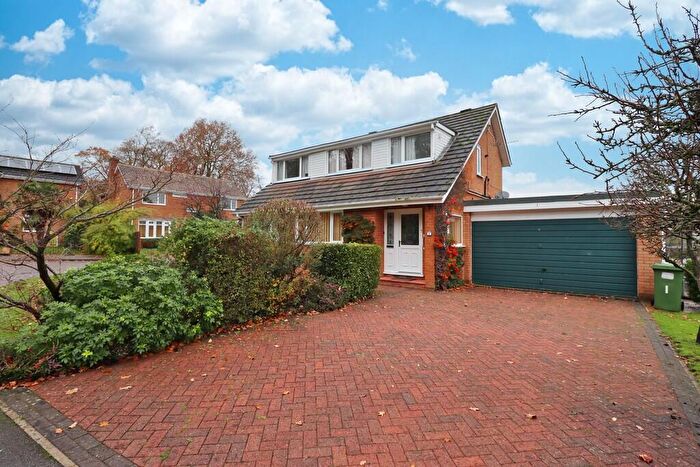
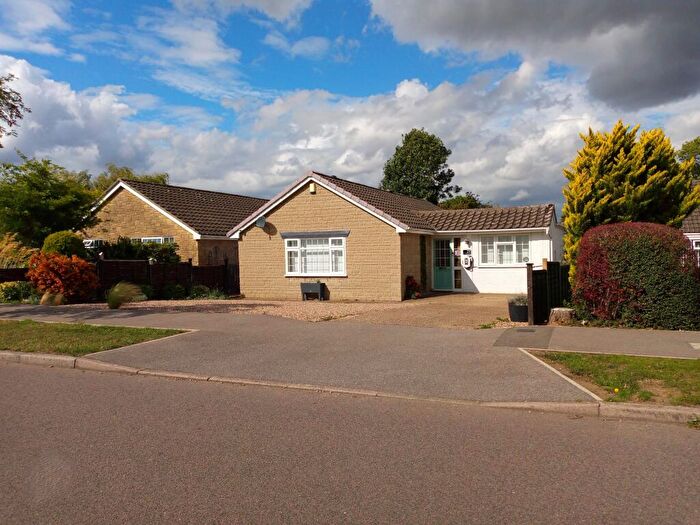
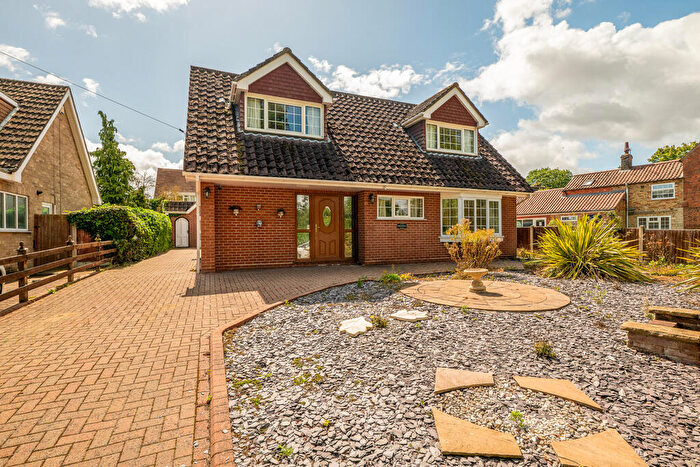
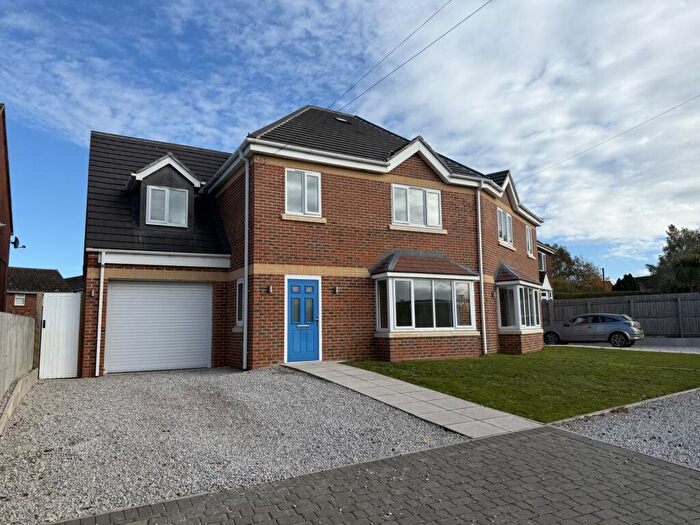
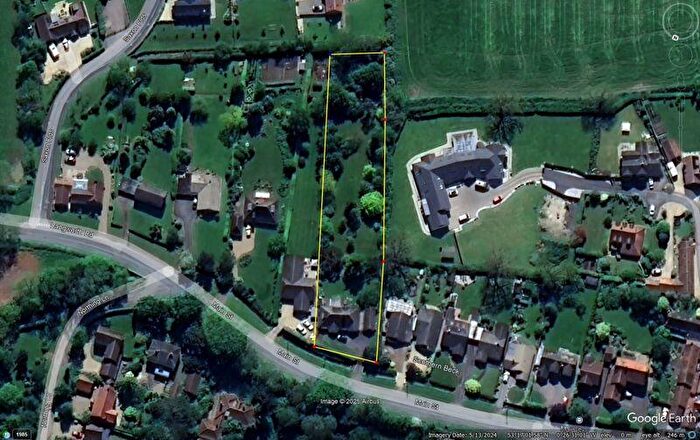
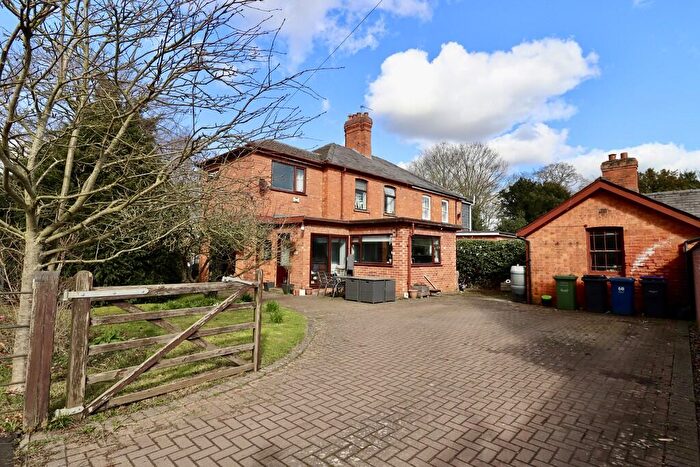
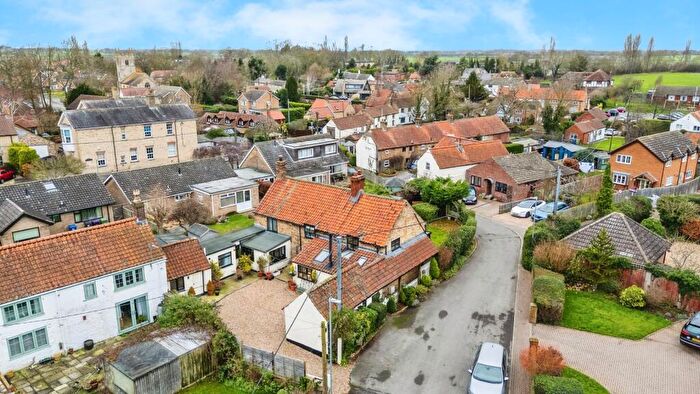
Properties in Sudbrooke have an average house price of £358,716.00 and had 124 Property Transactions within the last 3 years¹.
Sudbrooke is an area in Lincoln, Lincolnshire with 1,047 households², where the most expensive property was sold for £1,075,000.00.
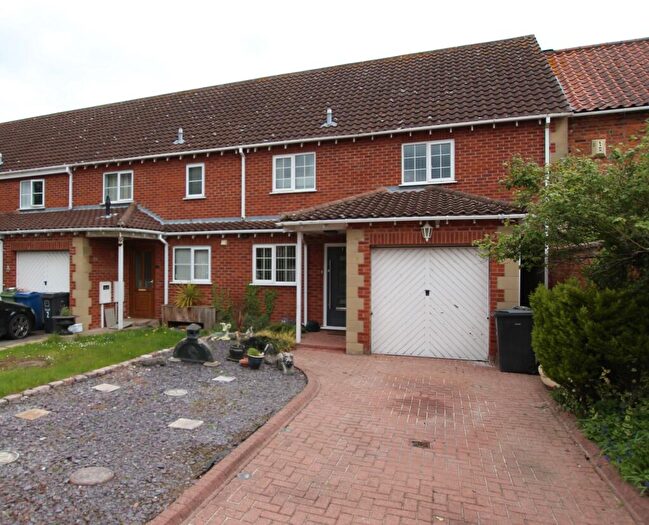
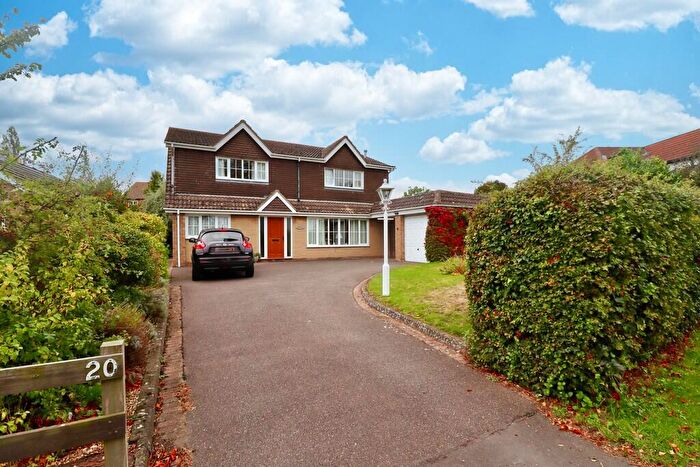
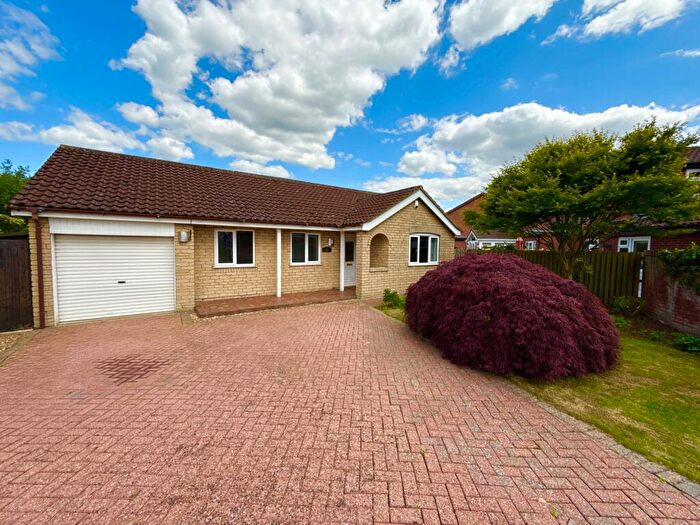
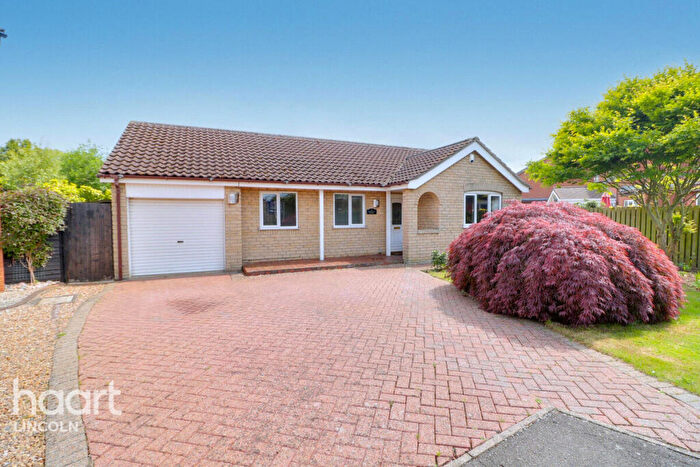
Properties for sale in Sudbrooke
Roads and Postcodes in Sudbrooke
Navigate through our locations to find the location of your next house in Sudbrooke, Lincoln for sale or to rent.
| Streets | Postcodes |
|---|---|
| Abbots Way | LN2 2FA |
| Back Lane | LN2 2WP |
| Beech Close | LN2 2QW |
| Beresford Drive | LN2 2YH |
| Broad Dale Close | LN2 2FD |
| Cade Close | LN2 2WJ |
| Cedar Close | LN2 2RF |
| Chapel Walk | LN2 2UH |
| Chestnut Close | LN2 2RD |
| Chestnut Drive | LN2 2RB |
| Church Court | LN2 2EL |
| Church Lane | LN2 2QH |
| Church Street | LN2 2UA |
| Courtfield Close | LN2 2QN |
| Craypool Lane | LN2 2UT LN2 2UU |
| Dunholme Road | LN2 2UD LN2 2UE |
| Ellison Close | LN2 2SE |
| Elm Drive | LN2 2SG |
| Elmdene | LN2 2UL |
| Esher Road | LN2 2ZG |
| Fir Tree Close | LN2 2YG |
| Fox Covert | LN2 2BN |
| Green Way | LN2 2YA |
| Heath Road | LN2 3QD LN2 2FJ |
| Heathlea | LN2 2TZ |
| Holme Drive | LN2 2QL LN2 2SF |
| Juniper Drive | LN2 2WA |
| Langworth Road | LN2 2UP |
| Lime Tree Paddock | LN2 2XD |
| Main Drive | LN2 2QY |
| Main Street | LN2 2UF LN2 2UG LN2 2UJ LN2 2UW |
| Manor Court | LN2 2SH |
| Manor Drive | LN2 2QG |
| Maple Drive | LN2 2YE |
| Meadow Close | LN2 2UN |
| Meadow Place | LN2 2ZN |
| Mill Rise | LN2 2WZ |
| Nettleham Road | LN2 2TY |
| Northfield Avenue | LN2 2FB |
| Northing Lane | LN2 2WL |
| Oak Close | LN2 2RG |
| Orchard Close | LN2 2XB |
| Park Close | LN2 2RE |
| Parklands Drive | LN2 2ZH |
| Pelham Close | LN2 2SQ |
| Poachers Lane | LN2 2GA |
| Sandown Road | LN2 2ZF |
| Saxon Fields | LN2 2YX |
| School Crescent | LN2 2UQ |
| Scothern Lane | LN2 2QJ LN2 2QP LN2 2QT |
| Shepherds Way | LN2 2FE |
| Sibthorpe Drive | LN2 2RQ |
| St Edwards Drive | LN2 2QR |
| St Germains Way | LN2 2GG |
| Stainton Lane | LN2 2UR LN3 5WA |
| Sudbrooke Place | LN2 2GQ |
| Sudbrooke Road | LN2 2UX LN2 2UY LN2 2UZ |
| The Alders | LN2 2WD |
| The Oaks | LN2 2WB |
| The Paddock | LN2 2QS |
| Thorne Lane | LN2 2FZ |
| Vicarage Lane | LN2 2UB |
| Weir Farm Paddock | LN2 2XA |
| West Drive | LN2 2QZ LN2 2RA |
| Windsor Close | LN2 2YD |
| Woolley Road | LN2 2FF |
| Wragby Road | LN2 2QU LN2 2QX |
| LN2 2ZJ |
Transport near Sudbrooke
- FAQ
- Price Paid By Year
- Property Type Price
Frequently asked questions about Sudbrooke
What is the average price for a property for sale in Sudbrooke?
The average price for a property for sale in Sudbrooke is £358,716. This amount is 51% higher than the average price in Lincoln. There are 324 property listings for sale in Sudbrooke.
What streets have the most expensive properties for sale in Sudbrooke?
The streets with the most expensive properties for sale in Sudbrooke are Saxon Fields at an average of £782,500, Thorne Lane at an average of £583,500 and School Crescent at an average of £556,500.
What streets have the most affordable properties for sale in Sudbrooke?
The streets with the most affordable properties for sale in Sudbrooke are Manor Court at an average of £210,000, Fox Covert at an average of £212,500 and Abbots Way at an average of £215,166.
Which train stations are available in or near Sudbrooke?
Some of the train stations available in or near Sudbrooke are Lincoln Central, Hykeham and Market Rasen.
Property Price Paid in Sudbrooke by Year
The average sold property price by year was:
| Year | Average Sold Price | Price Change |
Sold Properties
|
|---|---|---|---|
| 2025 | £333,450 | -9% |
46 Properties |
| 2024 | £364,918 | -6% |
49 Properties |
| 2023 | £388,313 | -2% |
29 Properties |
| 2022 | £397,944 | 11% |
63 Properties |
| 2021 | £354,114 | -9% |
106 Properties |
| 2020 | £386,203 | 21% |
63 Properties |
| 2019 | £306,317 | 13% |
48 Properties |
| 2018 | £267,788 | 2% |
52 Properties |
| 2017 | £262,098 | -11% |
49 Properties |
| 2016 | £290,929 | 7% |
57 Properties |
| 2015 | £271,029 | 17% |
40 Properties |
| 2014 | £224,243 | -3% |
49 Properties |
| 2013 | £231,053 | 7% |
39 Properties |
| 2012 | £215,051 | -11% |
34 Properties |
| 2011 | £238,755 | 2% |
40 Properties |
| 2010 | £233,953 | 22% |
37 Properties |
| 2009 | £183,571 | -3% |
37 Properties |
| 2008 | £189,052 | -17% |
19 Properties |
| 2007 | £221,459 | 8% |
55 Properties |
| 2006 | £202,808 | 4% |
48 Properties |
| 2005 | £194,307 | 1% |
39 Properties |
| 2004 | £191,621 | -17% |
59 Properties |
| 2003 | £223,865 | 38% |
35 Properties |
| 2002 | £139,836 | 21% |
72 Properties |
| 2001 | £110,799 | 3% |
99 Properties |
| 2000 | £107,959 | 19% |
69 Properties |
| 1999 | £87,291 | -4% |
75 Properties |
| 1998 | £91,187 | 23% |
61 Properties |
| 1997 | £69,802 | -2% |
56 Properties |
| 1996 | £71,022 | -5% |
45 Properties |
| 1995 | £74,319 | - |
43 Properties |
Property Price per Property Type in Sudbrooke
Here you can find historic sold price data in order to help with your property search.
The average Property Paid Price for specific property types in the last three years are:
| Property Type | Average Sold Price | Sold Properties |
|---|---|---|
| Semi Detached House | £238,750.00 | 12 Semi Detached Houses |
| Detached House | £375,343.00 | 110 Detached Houses |
| Terraced House | £164,000.00 | 2 Terraced Houses |

