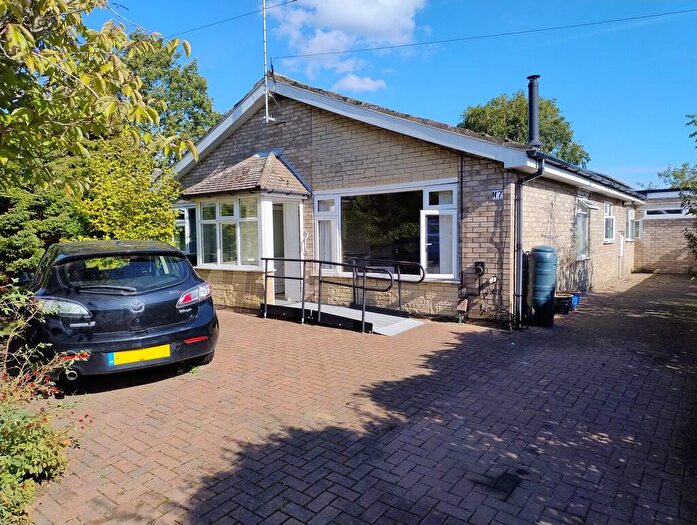
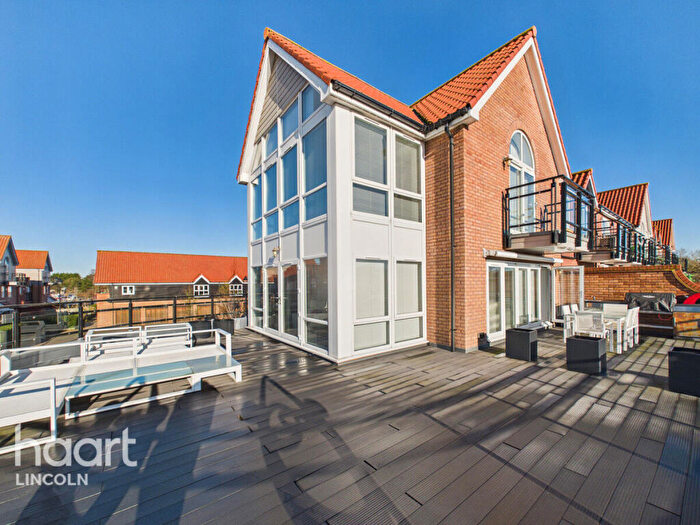
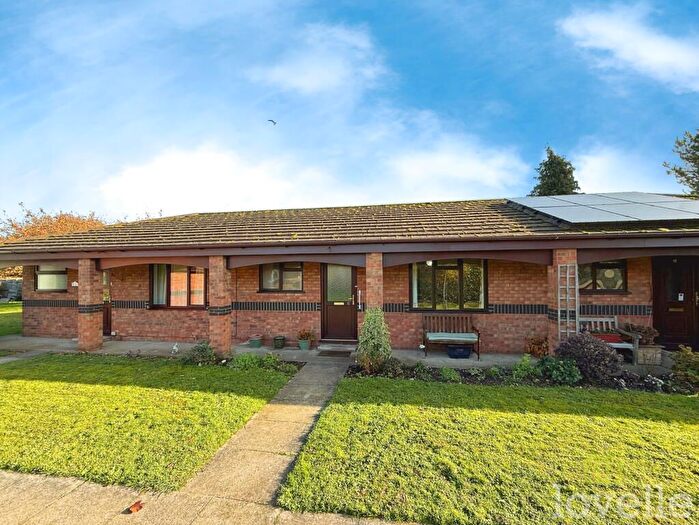
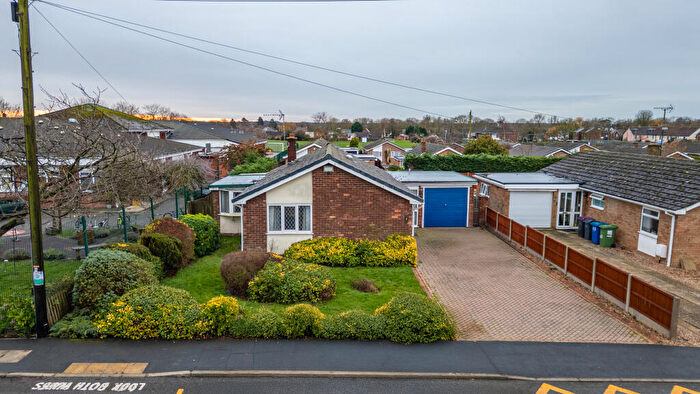
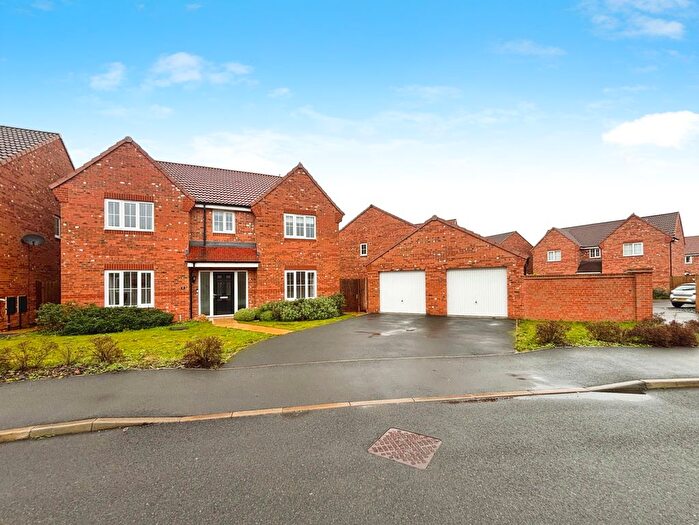
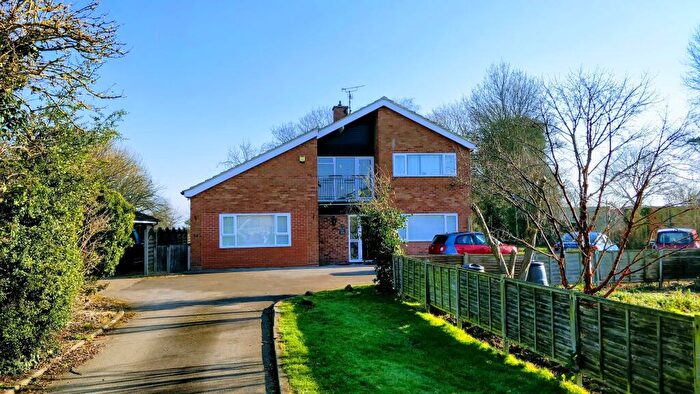
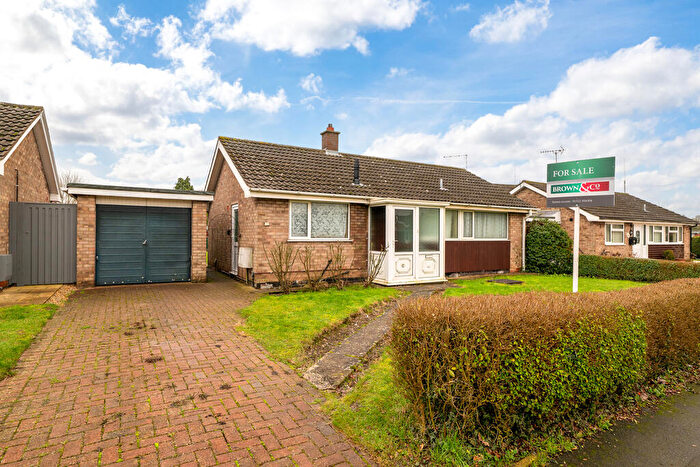
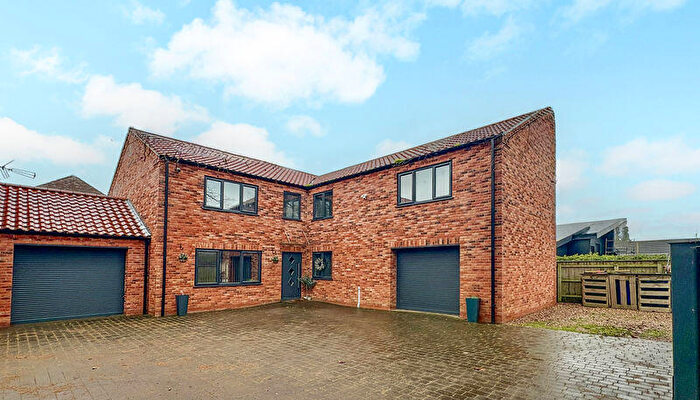
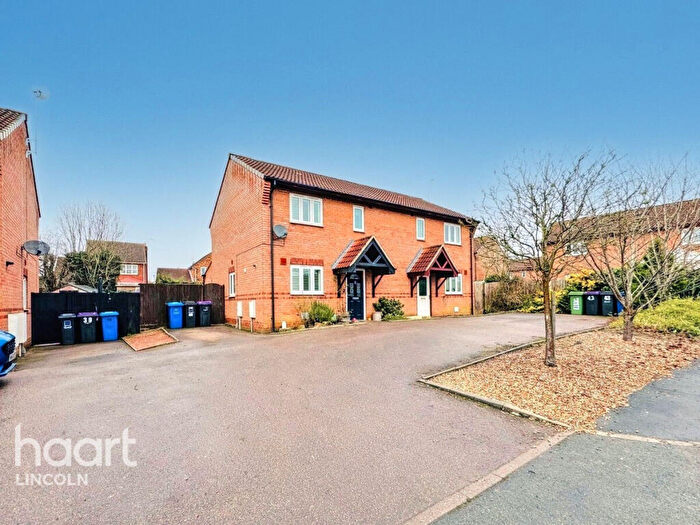
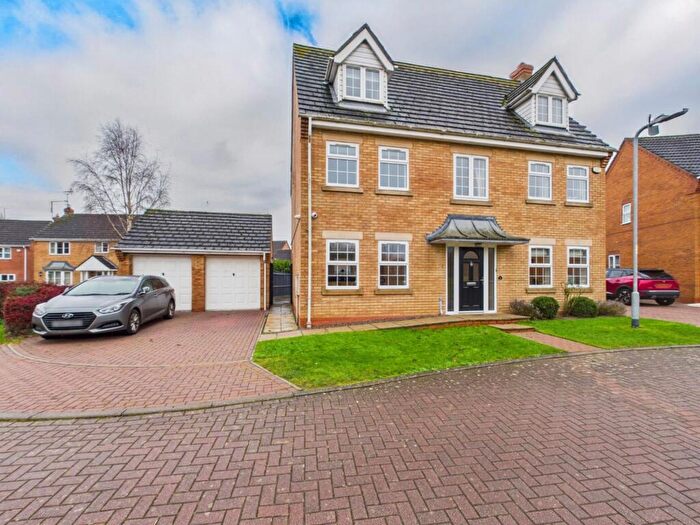
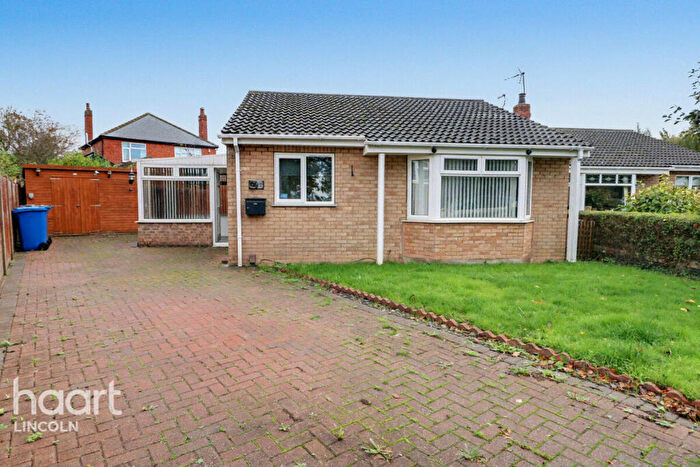
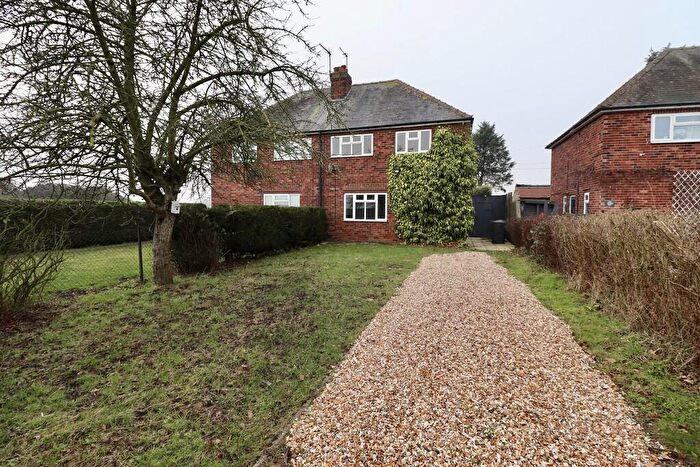
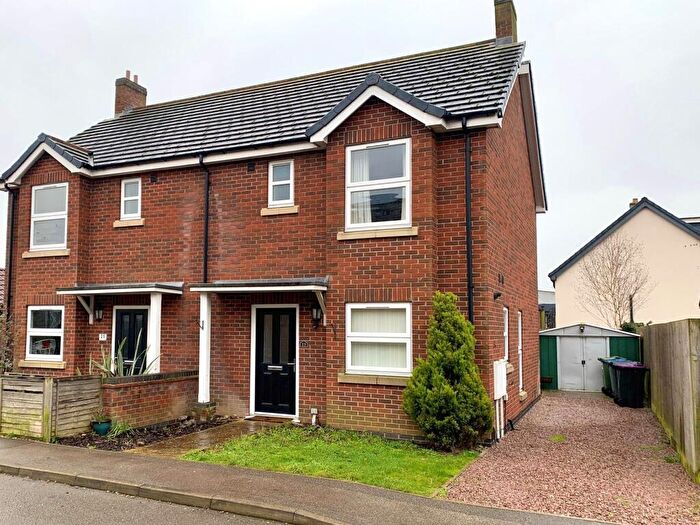
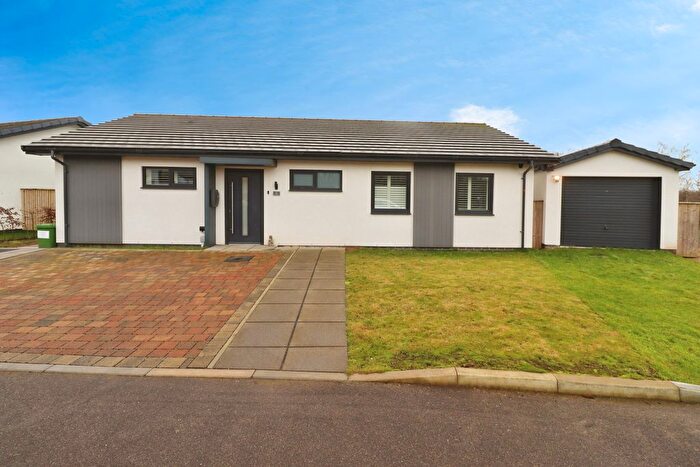
Houses for sale & to rent in Saxilby, Lincoln
House Prices in Saxilby
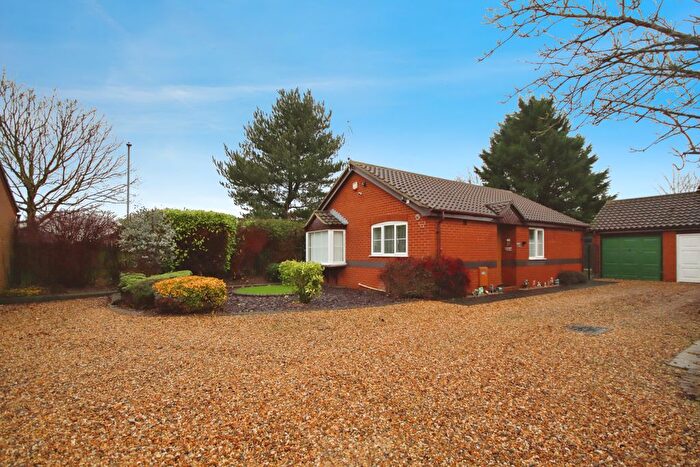
Properties in Saxilby have an average house price of £279,094.00 and had 259 Property Transactions within the last 3 years¹.
Saxilby is an area in Lincoln, Lincolnshire with 2,243 households², where the most expensive property was sold for £840,000.00.
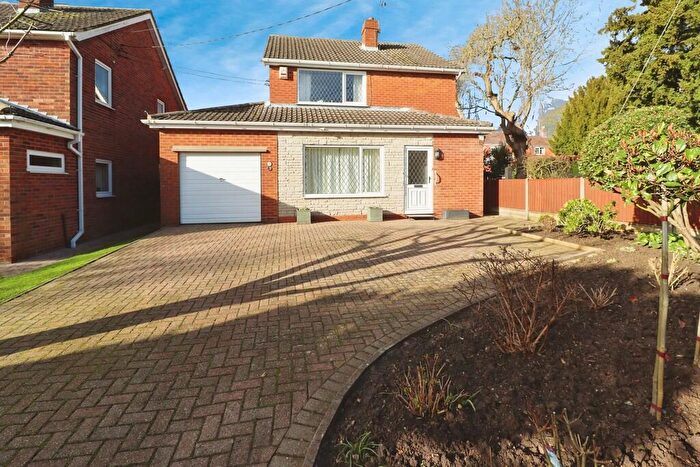
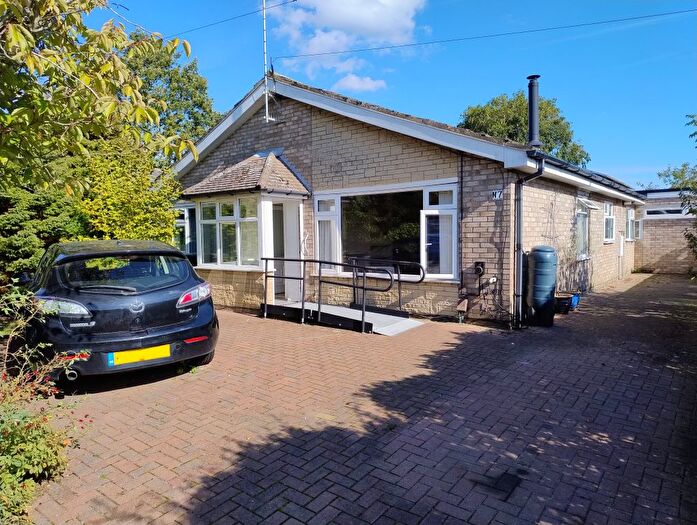
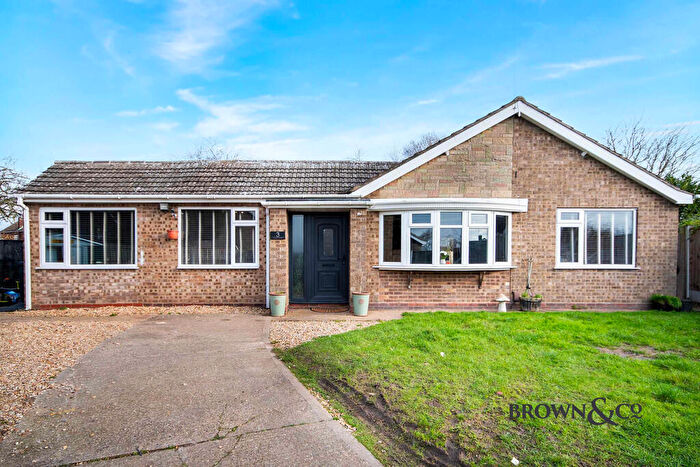
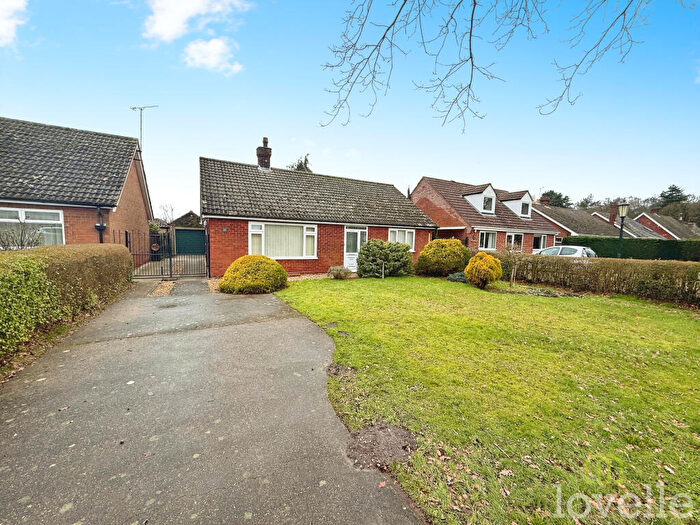
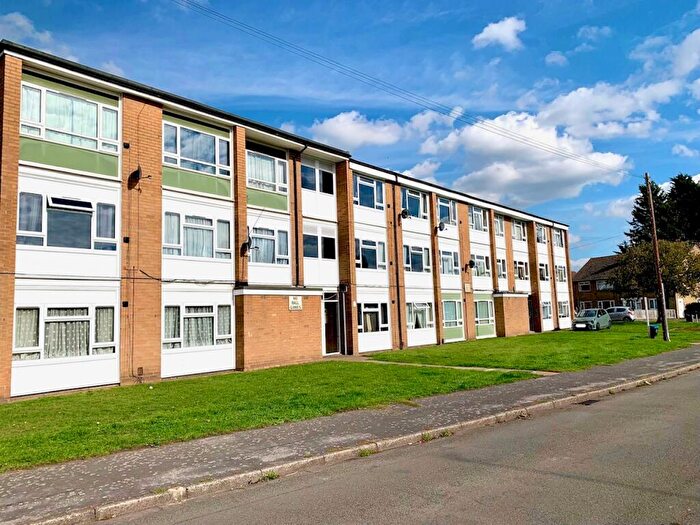
Properties for sale in Saxilby
Roads and Postcodes in Saxilby
Navigate through our locations to find the location of your next house in Saxilby, Lincoln for sale or to rent.
| Streets | Postcodes |
|---|---|
| Almond Close | LN1 2HS |
| Ashfield Grange | LN1 2NP |
| Ballerini Way | LN1 2QY |
| Bay Willow Road | LN1 2ZG |
| Blades Drive | LN1 4AH |
| Blankney Close | LN1 2JA |
| Brackenbury Road | LN1 4AF |
| Bridge Place | LN1 2QA |
| Bridge Street | LN1 2PZ |
| Bridge Walk | LN1 2WR |
| Broadholme Road | LN1 2NE |
| Broxholme Lane | LN1 2FA LN1 2NQ LN1 4AX LN1 4BA |
| Burton Lane End | LN1 2WN LN1 2UA |
| Canal Court | LN1 2GT |
| Canon Cook Close | LN1 2RZ |
| Carlton Lane | LN1 2YS |
| Century Lane | LN1 2FD |
| Chapel Yard | LN1 2HD |
| Church Lane | LN1 2PE LN1 2RS LN1 2XE LN1 2ZS |
| Church Road | LN1 2HH LN1 2HJ |
| Cricket Green | LN1 4AG |
| Cypress Way | LN1 4AY |
| Daubeney Avenue | LN1 2WA |
| Dennis Brown Court | LN1 2QZ |
| Eastcroft | LN1 2TX |
| Ellisons Quay | LN1 2GG |
| Elm Close | LN1 2QH |
| Ernie White Close | LN1 4AT |
| Fallow Croft | LN1 2SJ |
| Fen Lane | LN1 2RN |
| Field Avenue | LN1 2SR |
| Field View | LN1 4AL |
| Forrington Place | LN1 2WJ |
| Foss Dyke Court | LN1 2RY |
| Fossdyke Gardens | LN1 2QF |
| Fosse Grove | LN1 2QR |
| Gainsborough Road | LN1 2JH |
| Green Lane | LN1 4AW |
| Hall Yard | LN1 2RD |
| Hardwick Close | LN1 2WU |
| Hawthorne Close | LN1 4AA |
| High Street | LN1 2HA LN1 2HG LN1 2LN |
| Highfield Road | LN1 2QJ LN1 2QP |
| Hilton Court | LN1 2GP |
| Horncastle Lane | LN1 2ZR |
| Horton Place | LN1 2GW |
| Hotchkin Avenue | LN1 2GU |
| Hughes Ford Way | LN1 2WB |
| Ingamells Drive | LN1 2WX |
| Jean Revill Close | LN1 4AR |
| Kenilworth Close | LN1 2FQ |
| Lambert Place | LN1 4AP |
| Library Court | LN1 2GL |
| Lincoln Road | LN1 2NF |
| Lingfield Close | LN1 2FR |
| Macphail Crescent | LN1 2WL |
| Maiden Court | LN1 2WH |
| Main Street | LN1 2NG LN1 2RR LN1 2RH |
| Manor Lane | LN1 2NA |
| Manor Road | LN1 2HP LN1 2HX |
| Maple Court | LN1 2FJ |
| Marina Court | LN1 2ZL |
| Marine Approach | LN1 2LW LN1 2WW |
| Marine Walk | LN1 2TS |
| Mays Lane | LN1 2QE |
| Meadow Rise | LN1 2HW |
| Meadow Walk | LN1 2GX |
| Middle Street | LN1 2RB LN1 2RF LN1 2RG LN1 2RW LN1 2RQ |
| Mill Lane | LN1 2HL LN1 2HN LN1 2QD LN1 2QG LN1 2QQ |
| Millfield Avenue | LN1 2QN |
| Mulberry Way | LN1 4AB |
| Navigation Court | LN1 2YF |
| Newport Farm Close | LN1 2GN |
| Northcroft | LN1 2PU |
| Northfield Rise | LN1 2WT |
| Nursery Close | LN1 2JD |
| Oakfield | LN1 2QW |
| Oaklands | LN1 2JF |
| Occupation Lane | LN1 2NB |
| Old Hall Paddocks | LN1 2BH |
| Orchard Lane | LN1 2HT |
| Otter Avenue | LN1 2HU |
| Paddock View | LN1 2JQ |
| Park Lane | LN1 2UZ LN1 2WP LN1 2ZD |
| Parman Court | LN1 2ZN |
| Poachers Court | LN1 2HR |
| Queensway | LN1 2QB |
| Queensway Court | LN1 2QT |
| Railway Court | LN1 2PF |
| Read Robinson Avenue | LN1 4AJ |
| Riverside Mews | LN1 2TQ |
| Rooks Close | LN1 2RA |
| Rosehill Close | LN1 2JB |
| Rowan Avenue | LN1 4AE |
| Rutherglen Park | LN1 2QS |
| Salisbury Close | LN1 2FS |
| Saxilby Road | LN1 2BB LN1 2GQ LN1 2ND |
| School Lane | LN1 2LZ LN1 2RL |
| Skellingthorpe Road | LN1 2FU LN1 2GH LN1 2LR LN1 5AB |
| Skirbeck Drive | LN1 2HE |
| Somersby Court | LN1 2RU |
| South Parade | LN1 2HQ |
| Spencer Close | LN1 2WY |
| St Andrews Drive | LN1 2PR |
| St Botolphs Close | LN1 2PS |
| St Botolphs Gate | LN1 2RX |
| St Georges Mews | LN1 2GR |
| Stable Yard | LN1 2WD |
| Station Approach | LN1 2HB |
| Sturton Road | LN1 2PG |
| Swallow Gate | LN1 4AN |
| Sykes Lane | LN1 2NS LN1 2NU LN1 2NX LN1 2PA LN1 2NR |
| Sykes Mews | LN1 2ZH |
| Ted Baker Way | LN1 4AQ |
| The Landings | LN1 2TU |
| The Moorings | LN1 2WQ |
| The Quays | LN1 2XG |
| The Row | LN1 2LX |
| The Rowans | LN1 2SP |
| The Sidings | LN1 2PX |
| Thonock Drive | LN1 2JE |
| Tom Otters Lane | LN1 2LY |
| Torksey Avenue | LN1 2HY |
| Vasey Close | LN1 2WG |
| Warwick Close | LN1 2FT |
| Wells Court | LN1 2GY |
| Wentworth Close | LN1 2FW |
| West Bank | LN1 2LU |
| West End | LN1 2RJ |
| Westcroft Drive | LN1 2PT |
| Western Avenue | LN1 2NT |
| William Street | LN1 2LP |
| Willow Close | LN1 2QL |
| Woodcock Lane | LN1 2BE |
| Woodcroft Road | LN1 2WS |
| Woodhall Crescent | LN1 2HZ |
| Woodlands Edge | LN1 2ZF |
| LN1 2PQ LN1 2RE LN1 2RP LN1 2AR LN1 2LT LN1 2PB LN1 2PD LN1 2PL LN1 2RT LN1 2TJ LN1 2TN LN1 2WZ LN1 4AD LN1 4AS LN1 4AU LN1 4AZ |
Transport near Saxilby
-
Saxilby Station
-
Lincoln Central Station
-
Hykeham Station
-
Swinderby Station
-
Gainsborough Lea Road Station
-
Collingham Station
- FAQ
- Price Paid By Year
- Property Type Price
Frequently asked questions about Saxilby
What is the average price for a property for sale in Saxilby?
The average price for a property for sale in Saxilby is £279,094. This amount is 17% higher than the average price in Lincoln. There are 1,539 property listings for sale in Saxilby.
What streets have the most expensive properties for sale in Saxilby?
The streets with the most expensive properties for sale in Saxilby are Macphail Crescent at an average of £505,000, Church Road at an average of £456,000 and Warwick Close at an average of £432,500.
What streets have the most affordable properties for sale in Saxilby?
The streets with the most affordable properties for sale in Saxilby are Hawthorne Close at an average of £64,500, Rooks Close at an average of £103,800 and Railway Court at an average of £119,992.
Which train stations are available in or near Saxilby?
Some of the train stations available in or near Saxilby are Saxilby, Lincoln Central and Hykeham.
Property Price Paid in Saxilby by Year
The average sold property price by year was:
| Year | Average Sold Price | Price Change |
Sold Properties
|
|---|---|---|---|
| 2025 | £257,432 | -20% |
85 Properties |
| 2024 | £309,959 | 12% |
81 Properties |
| 2023 | £272,009 | -22% |
93 Properties |
| 2022 | £330,708 | 14% |
156 Properties |
| 2021 | £285,030 | 13% |
219 Properties |
| 2020 | £249,154 | 11% |
129 Properties |
| 2019 | £220,750 | -9% |
154 Properties |
| 2018 | £240,894 | 2% |
98 Properties |
| 2017 | £236,533 | 4% |
141 Properties |
| 2016 | £227,773 | 9% |
123 Properties |
| 2015 | £208,268 | 5% |
178 Properties |
| 2014 | £198,852 | 1% |
127 Properties |
| 2013 | £196,830 | 10% |
113 Properties |
| 2012 | £177,138 | -3% |
66 Properties |
| 2011 | £182,984 | -4% |
79 Properties |
| 2010 | £190,099 | 8% |
95 Properties |
| 2009 | £174,089 | -29% |
90 Properties |
| 2008 | £225,187 | 14% |
94 Properties |
| 2007 | £192,791 | 7% |
133 Properties |
| 2006 | £179,979 | -6% |
123 Properties |
| 2005 | £190,190 | 3% |
92 Properties |
| 2004 | £183,974 | 12% |
170 Properties |
| 2003 | £162,523 | 18% |
183 Properties |
| 2002 | £133,548 | 28% |
210 Properties |
| 2001 | £95,943 | 23% |
217 Properties |
| 2000 | £73,733 | -1% |
162 Properties |
| 1999 | £74,457 | -1% |
140 Properties |
| 1998 | £75,216 | 18% |
108 Properties |
| 1997 | £62,003 | -4% |
74 Properties |
| 1996 | £64,414 | 21% |
50 Properties |
| 1995 | £50,885 | - |
63 Properties |
Property Price per Property Type in Saxilby
Here you can find historic sold price data in order to help with your property search.
The average Property Paid Price for specific property types in the last three years are:
| Property Type | Average Sold Price | Sold Properties |
|---|---|---|
| Flat | £192,147.00 | 17 Flats |
| Semi Detached House | £221,466.00 | 52 Semi Detached Houses |
| Detached House | £334,230.00 | 130 Detached Houses |
| Terraced House | £234,211.00 | 60 Terraced Houses |

