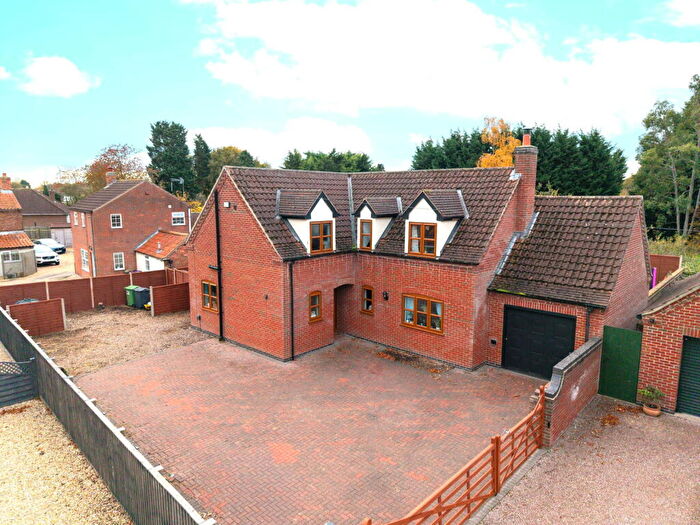
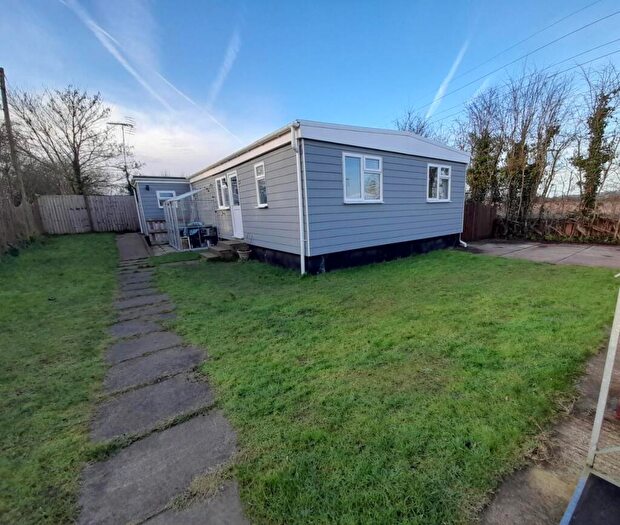
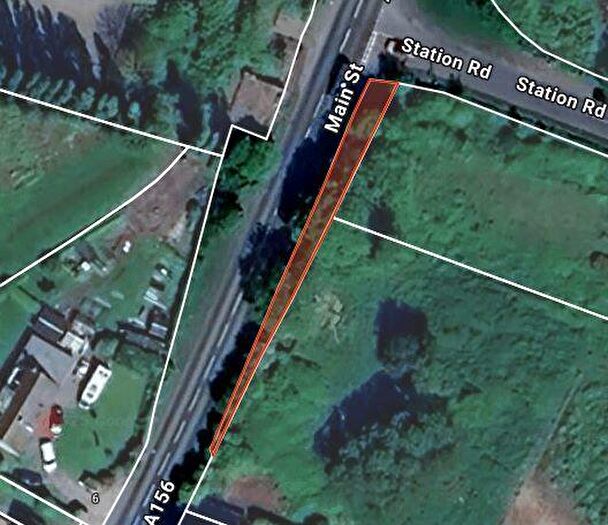
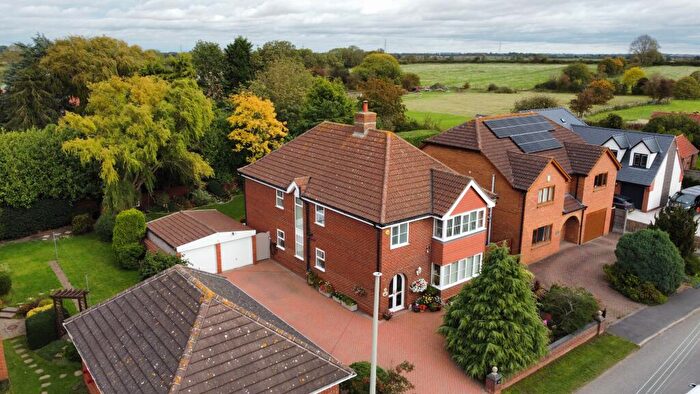
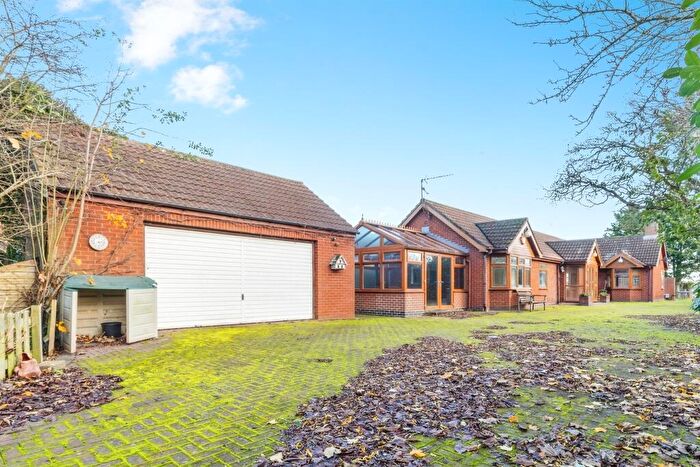
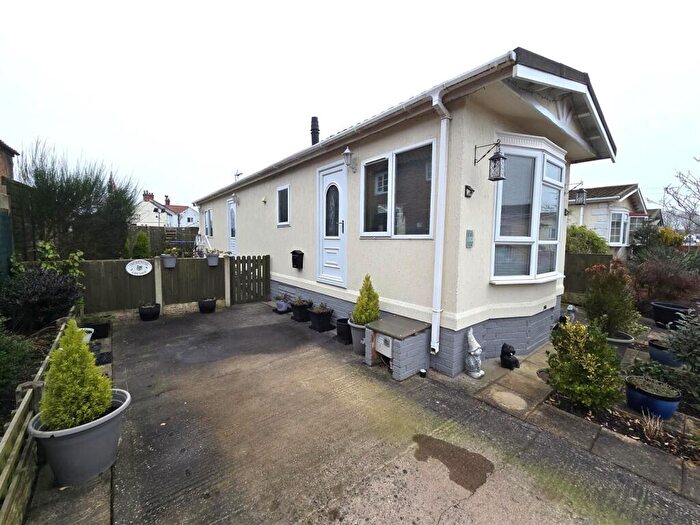
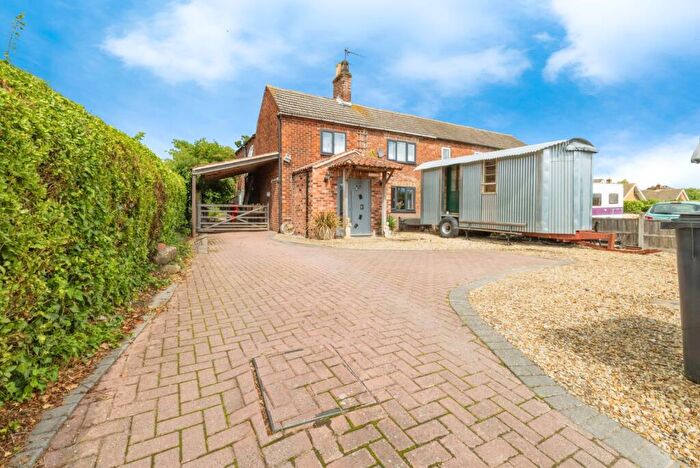
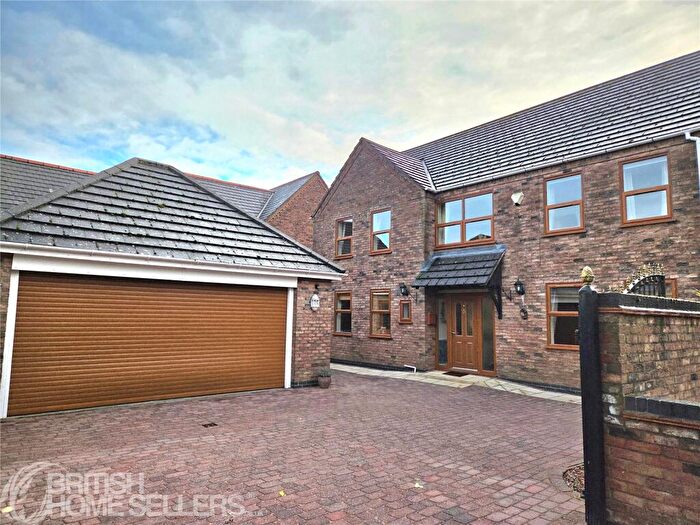
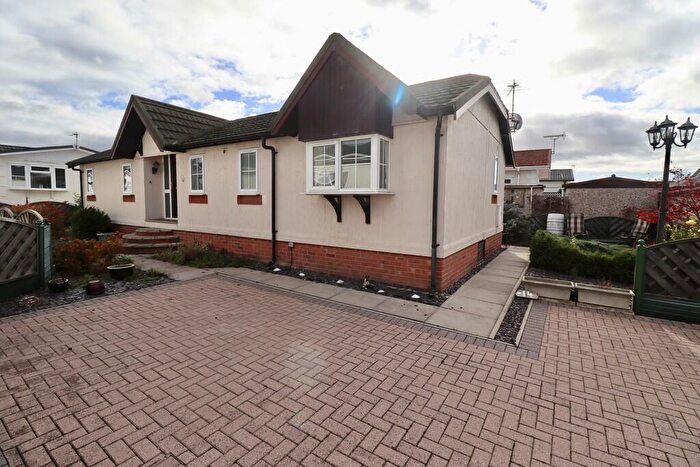
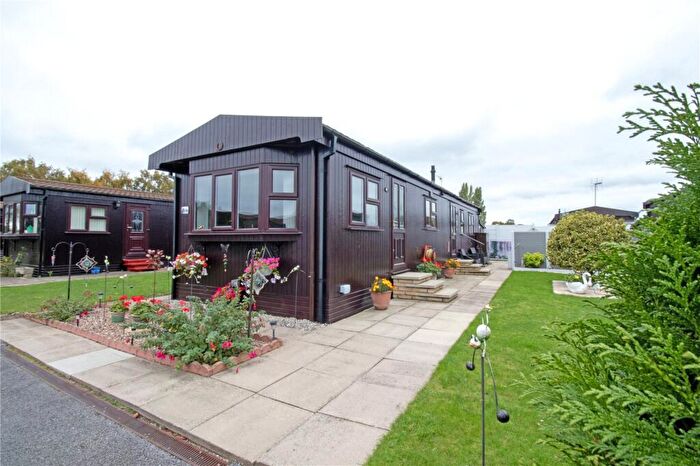
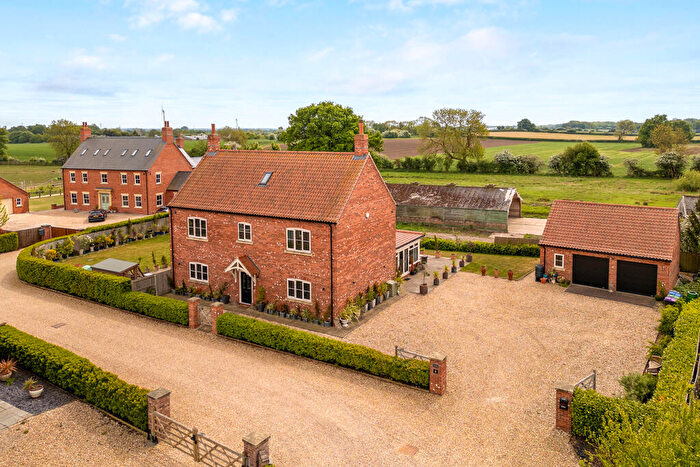
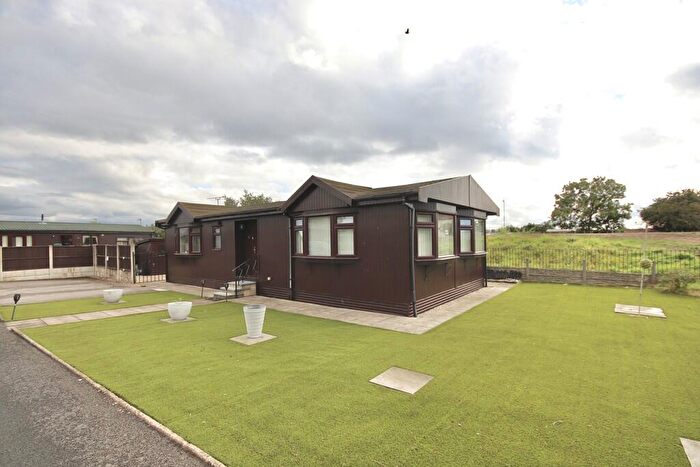
Houses for sale & to rent in Torksey, Lincoln
House Prices in Torksey
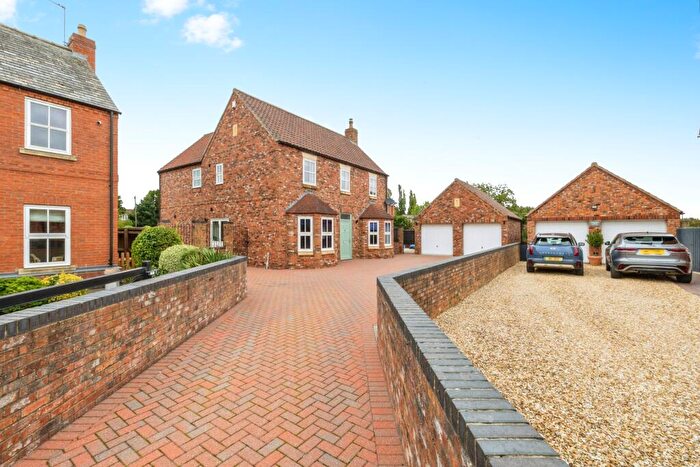
Properties in Torksey have an average house price of £340,941.00 and had 50 Property Transactions within the last 3 years¹.
Torksey is an area in Lincoln, Lincolnshire with 979 households², where the most expensive property was sold for £1,200,000.00.
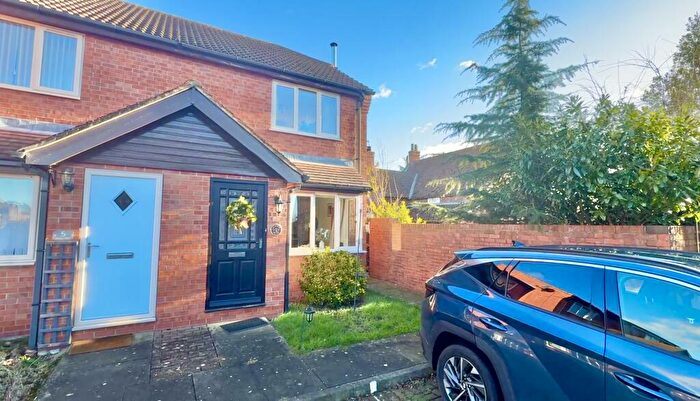
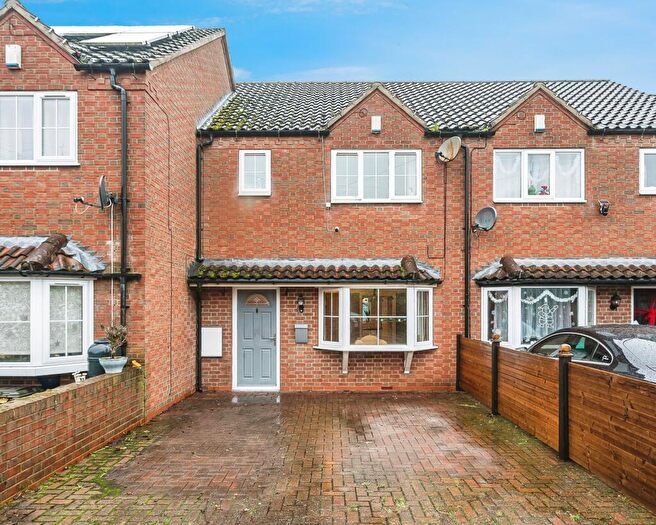
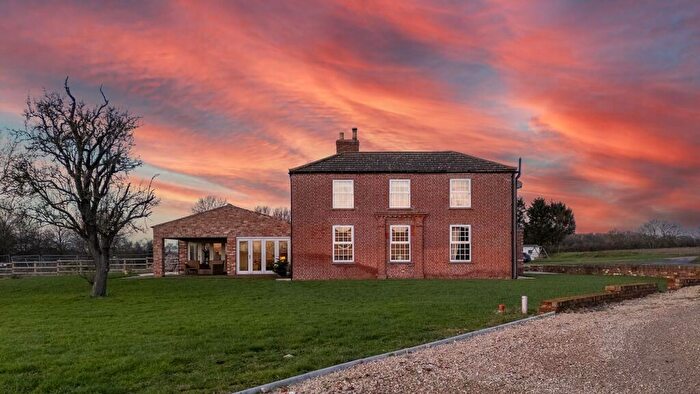
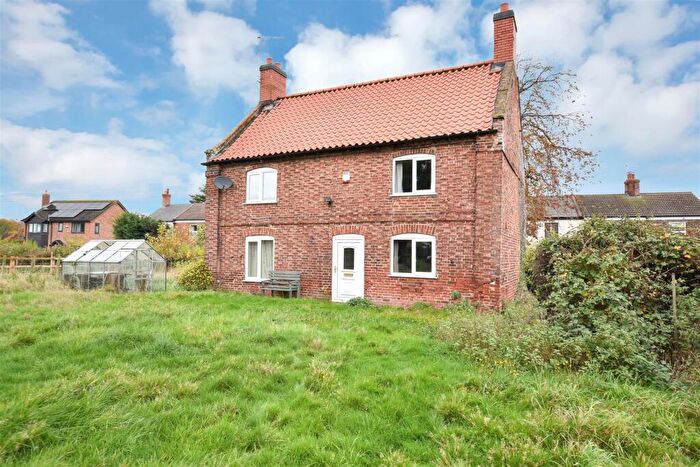
Properties for sale in Torksey
Roads and Postcodes in Torksey
Navigate through our locations to find the location of your next house in Torksey, Lincoln for sale or to rent.
| Streets | Postcodes |
|---|---|
| Abbey Park | LN1 2LS |
| Acacia Avenue | LN1 2NY |
| Addison Place | LN1 2SB |
| Alpine Crescent | LN1 2EX |
| Aspen Close | LN1 2LQ |
| Birch Grove | LN1 2EZ |
| Cedar Close | LN1 2NH |
| Chestnut Crescent | LN1 2NL |
| Church Lane | LN1 2YZ |
| Church Yard | LN1 2WF |
| Cockerels Roost | LN1 2FY |
| Collingham Road | LN1 2LL LN1 2JL |
| Dunham Close | LN1 2LH |
| Dunham Road | LN1 2JR |
| Elmdene Close | LN1 2EU |
| Fenton Fields | LN1 2GE |
| Fenton Grange | LN1 5AD |
| Ferry Lane | LN1 2LF |
| Fossdyke Walk | LN1 2EY |
| Friendship Close | LN1 2QX |
| Granary Court | LN1 2FL |
| Grosvenor Avenue | LN1 2GA |
| Hawthorn Avenue | LN1 2TW |
| High Street | LN1 2JP LN1 2JS |
| Home Farm Close | LN1 2BD |
| John Francis Way | LN1 2ZU |
| Kensington Grove | LN1 2GD |
| Kettlethorpe Lane | LN1 2GZ |
| Kettlethorpe Road | LN1 2ER LN1 2LB |
| Lime Close | LN1 2PN |
| Lincoln Court | LN1 2ZZ |
| Lincoln Lane | LN1 2QU LN1 2ZB |
| Lincoln Road | LN1 2EL LN1 2EN LN1 2EP |
| Lindum Way | LN1 2ET |
| Lock Row | LN1 2EH |
| Main Road | LN1 2JZ |
| Main Street | LN1 2EE |
| Maltkiln Road | LN1 2EW |
| Maple Avenue | LN1 2HF |
| Marsh Lane | LN1 2JX |
| Mulberry Way | LN1 2NZ |
| Newark Road | LN1 2EJ LN1 2JU LN1 2JT |
| Oak Drive | LN1 2PY |
| Orchard Close | LN1 2GJ |
| Park Farm Road | LN1 2LD |
| Poplar Drive | LN1 2NW |
| Regent Circle | LN1 2XB |
| Sallie Bank Lane | LN1 2JY |
| Sand Lane | LN1 2ED |
| Sheffield Road | LN1 2JJ |
| Southmoor Road | LN1 2LJ |
| St Peters Court | LN1 2XU |
| Station Road | LN1 2EQ LN1 2EB |
| Stow Park | LN1 2AL |
| Swynford Close | LN1 2LG |
| Sycamore Avenue | LN1 2NJ |
| The Brambles | LN1 2YU |
| The Fairways | LN1 2BJ |
| The Grove | LN1 2NN |
| The Old Stack Yard | LN1 2BW |
| The Oval | LN1 2ZT |
| The Paddocks | LN1 2JG |
| Till Bridge Lane | LN1 2AN |
| Trent Lane | LN1 2BF |
| Westmoor Lane | LN1 2JW LN1 2LE |
| Widows Row | LN1 2LA |
| Willow Lane | LN1 2PP |
| Woodland Court | LN1 2GF |
| LN1 2EG LN1 2PW LN1 2ES |
Transport near Torksey
-
Saxilby Station
-
Gainsborough Lea Road Station
-
Swinderby Station
-
Hykeham Station
-
Gainsborough Central Station
-
Retford Station
-
Lincoln Central Station
-
Collingham Station
- FAQ
- Price Paid By Year
- Property Type Price
Frequently asked questions about Torksey
What is the average price for a property for sale in Torksey?
The average price for a property for sale in Torksey is £340,941. This amount is 43% higher than the average price in Lincoln. There are 608 property listings for sale in Torksey.
What streets have the most expensive properties for sale in Torksey?
The streets with the most expensive properties for sale in Torksey are The Fairways at an average of £1,200,000, Trent Lane at an average of £575,000 and Abbey Park at an average of £465,000.
What streets have the most affordable properties for sale in Torksey?
The streets with the most affordable properties for sale in Torksey are Maltkiln Road at an average of £179,333, High Street at an average of £194,200 and Widows Row at an average of £205,000.
Which train stations are available in or near Torksey?
Some of the train stations available in or near Torksey are Saxilby, Gainsborough Lea Road and Swinderby.
Property Price Paid in Torksey by Year
The average sold property price by year was:
| Year | Average Sold Price | Price Change |
Sold Properties
|
|---|---|---|---|
| 2025 | £326,777 | -12% |
18 Properties |
| 2024 | £366,975 | 10% |
16 Properties |
| 2023 | £330,840 | -19% |
16 Properties |
| 2022 | £392,592 | 23% |
21 Properties |
| 2021 | £300,949 | -15% |
55 Properties |
| 2020 | £346,931 | 35% |
22 Properties |
| 2019 | £226,418 | -29% |
22 Properties |
| 2018 | £292,878 | 31% |
40 Properties |
| 2017 | £201,078 | -9% |
32 Properties |
| 2016 | £219,064 | 3% |
31 Properties |
| 2015 | £212,303 | 0,3% |
28 Properties |
| 2014 | £211,565 | 9% |
28 Properties |
| 2013 | £192,978 | 2% |
25 Properties |
| 2012 | £189,776 | -62% |
17 Properties |
| 2011 | £307,419 | 40% |
13 Properties |
| 2010 | £185,605 | 3% |
18 Properties |
| 2009 | £179,575 | 0,1% |
20 Properties |
| 2008 | £179,392 | -20% |
38 Properties |
| 2007 | £215,797 | 11% |
39 Properties |
| 2006 | £193,107 | 5% |
31 Properties |
| 2005 | £183,997 | 6% |
23 Properties |
| 2004 | £173,175 | 19% |
51 Properties |
| 2003 | £140,764 | 22% |
28 Properties |
| 2002 | £109,302 | 27% |
36 Properties |
| 2001 | £79,434 | 6% |
29 Properties |
| 2000 | £74,522 | 8% |
25 Properties |
| 1999 | £68,348 | 9% |
27 Properties |
| 1998 | £62,044 | -7% |
30 Properties |
| 1997 | £66,611 | 9% |
13 Properties |
| 1996 | £60,760 | 21% |
28 Properties |
| 1995 | £48,102 | - |
17 Properties |
Property Price per Property Type in Torksey
Here you can find historic sold price data in order to help with your property search.
The average Property Paid Price for specific property types in the last three years are:
| Property Type | Average Sold Price | Sold Properties |
|---|---|---|
| Semi Detached House | £196,992.00 | 7 Semi Detached Houses |
| Detached House | £402,905.00 | 36 Detached Houses |
| Terraced House | £166,214.00 | 7 Terraced Houses |

