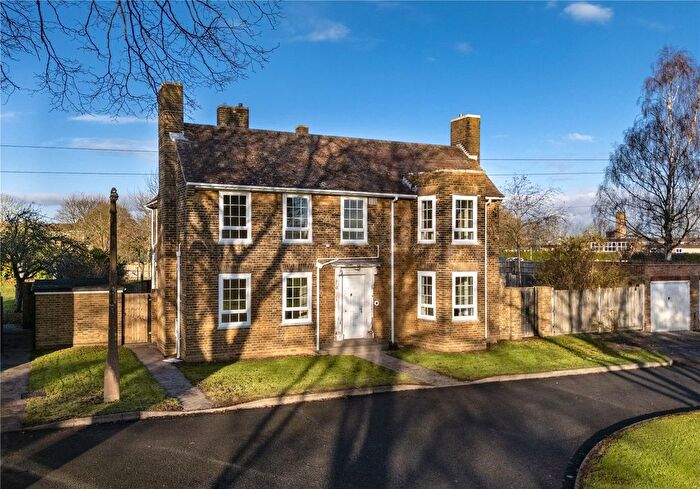
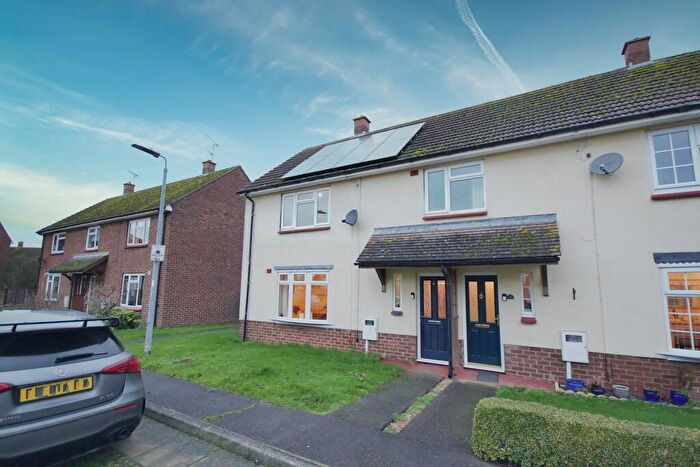
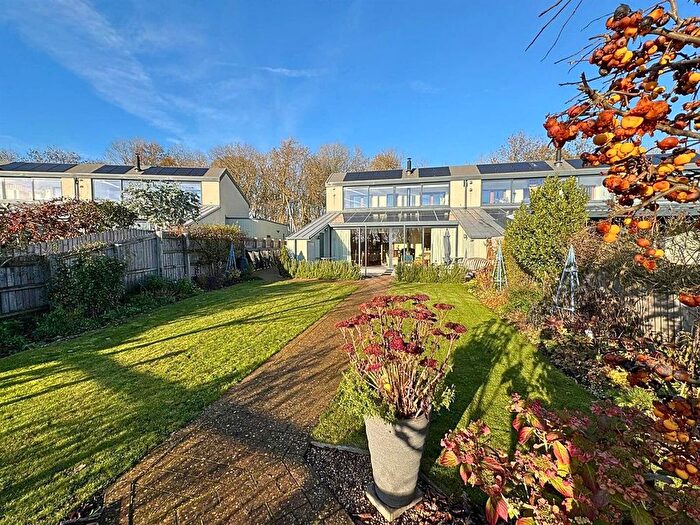
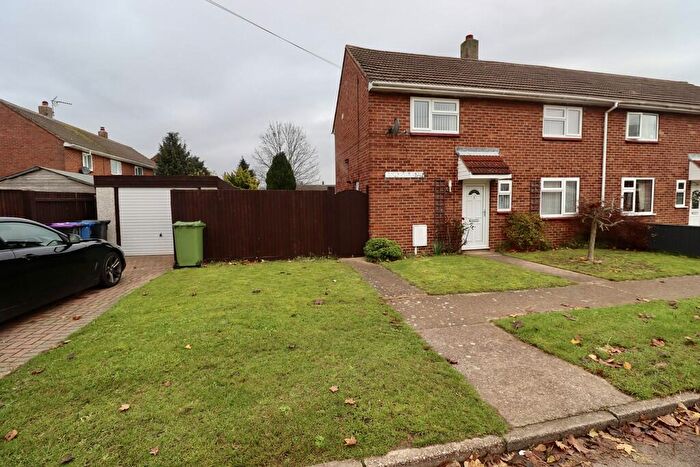
Houses for sale & to rent in Scampton, Lincoln
House Prices in Scampton
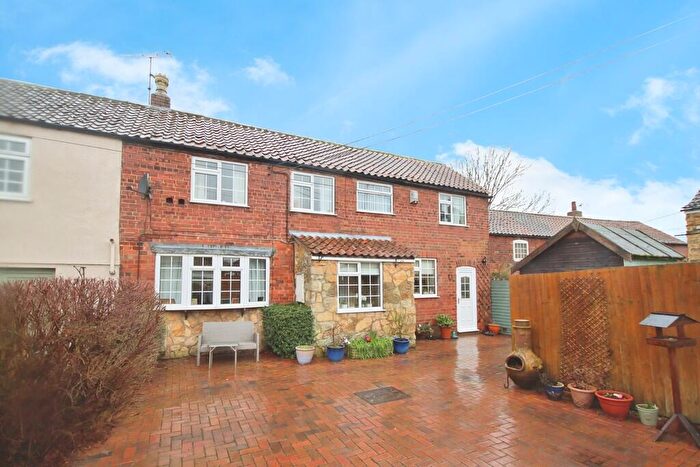
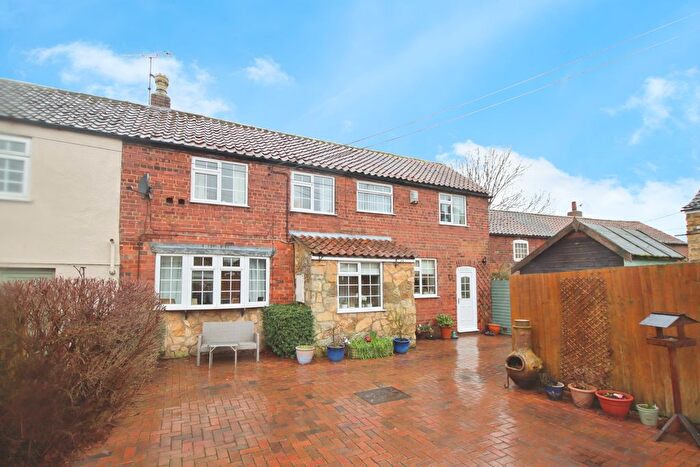
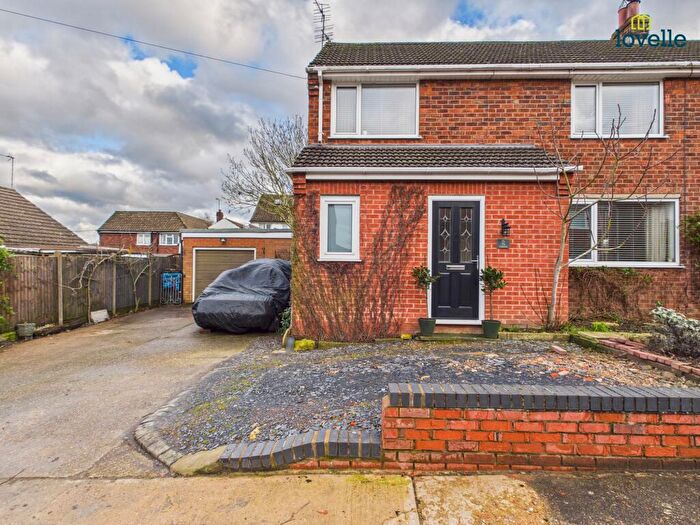
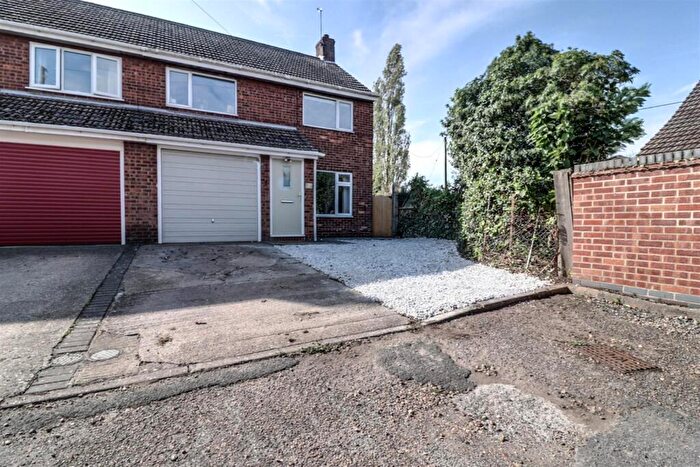
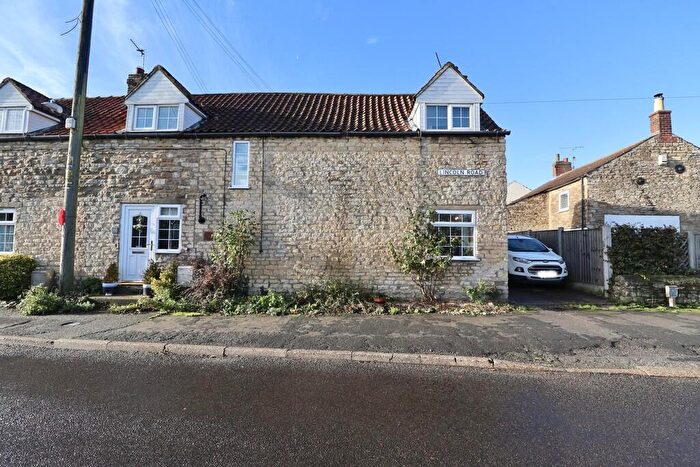
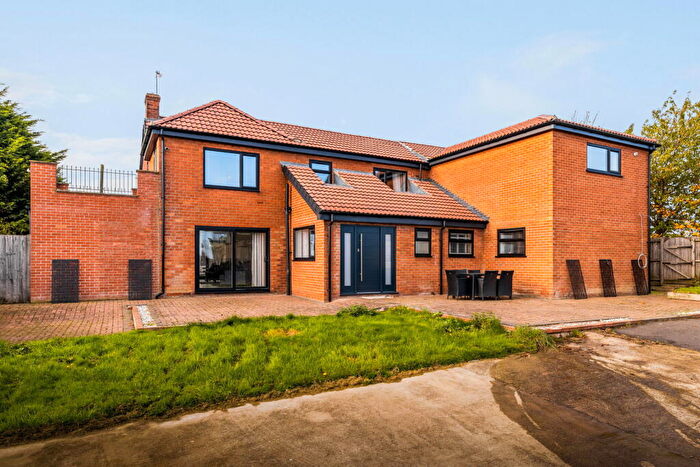
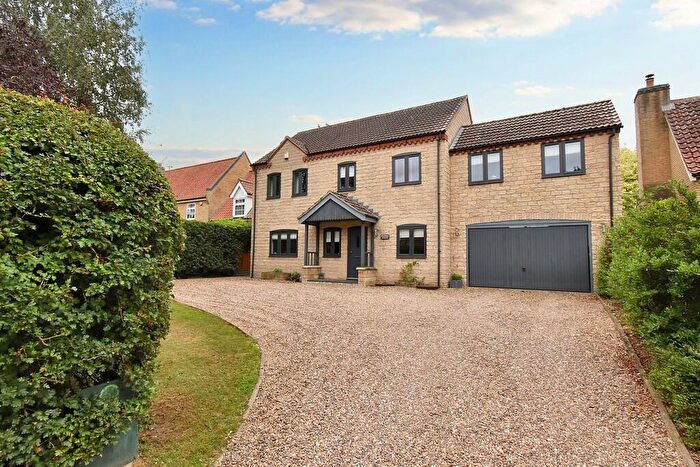
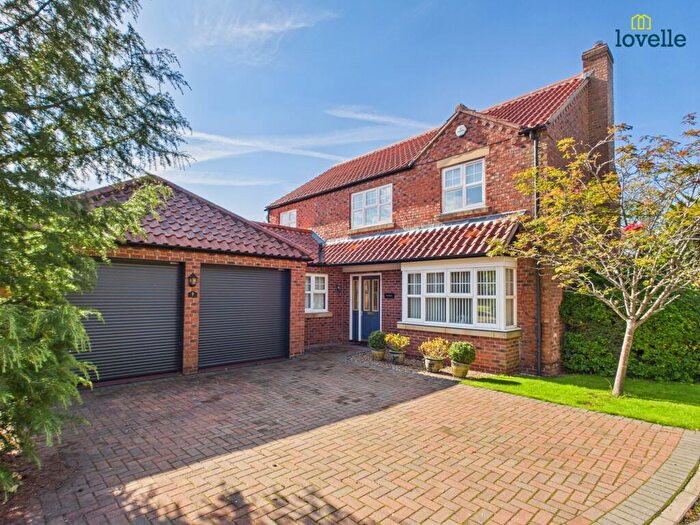
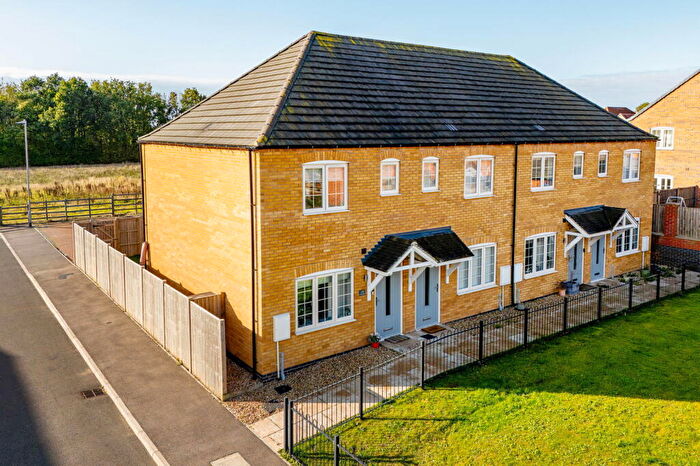
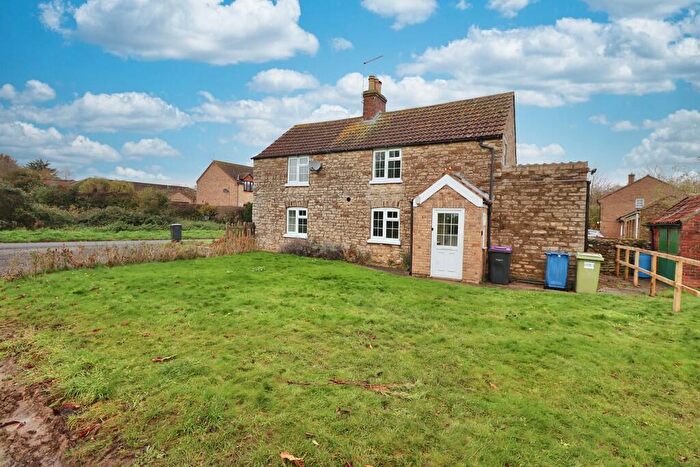
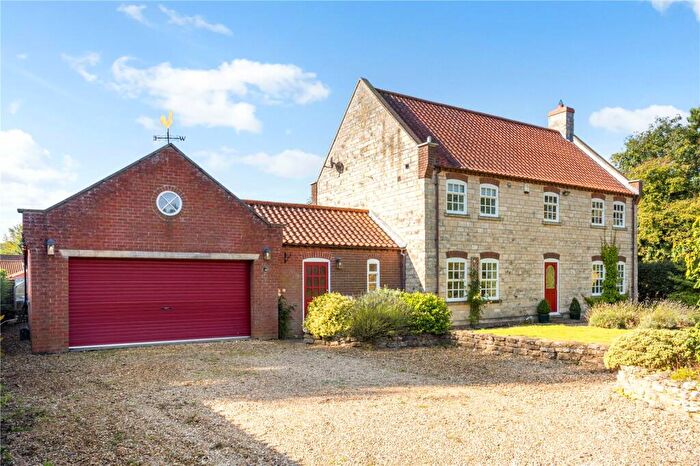
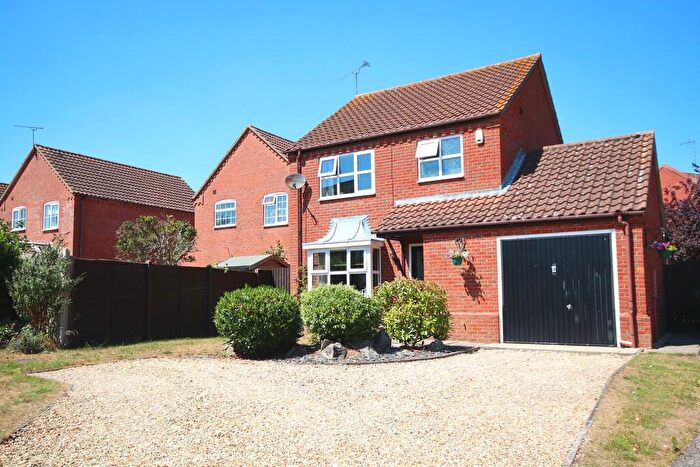
Properties in Scampton have an average house price of £212,355.00 and had 142 Property Transactions within the last 3 years¹.
Scampton is an area in Lincoln, Lincolnshire with 1,013 households², where the most expensive property was sold for £771,000.00.
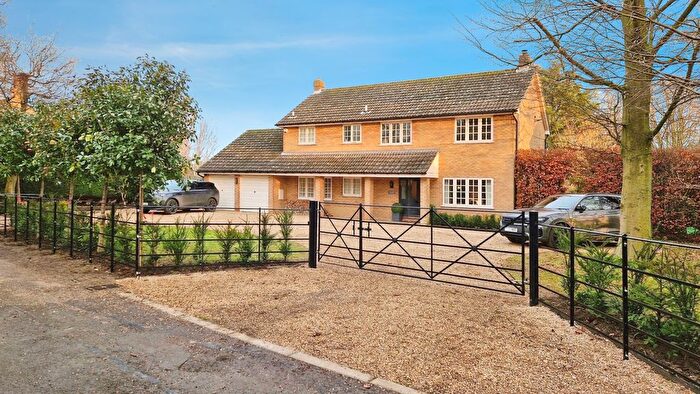
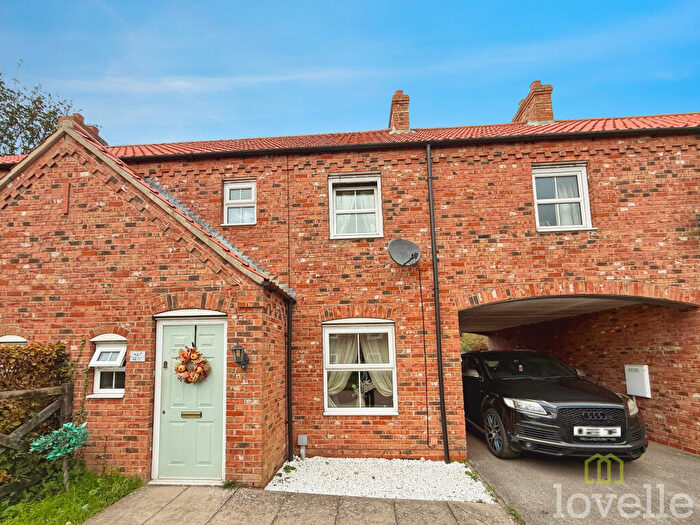
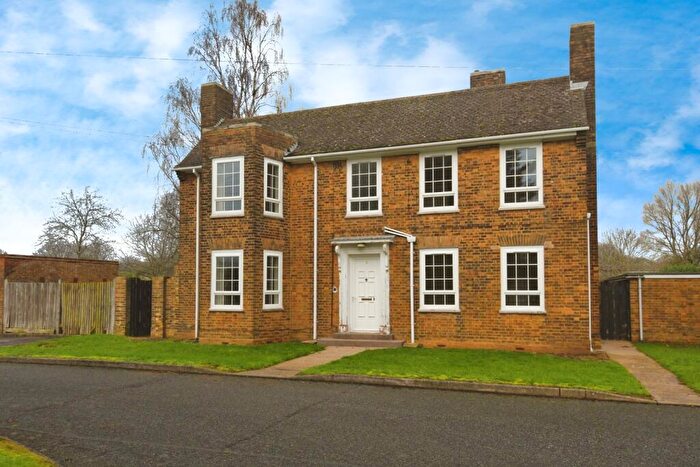
Properties for sale in Scampton
Roads and Postcodes in Scampton
Navigate through our locations to find the location of your next house in Scampton, Lincoln for sale or to rent.
| Streets | Postcodes |
|---|---|
| 617 Court | LN1 2TT |
| Anderson Court | LN1 2FG |
| Anyans Row | LN1 2XR |
| Canberra Drive | LN1 2TE |
| Church Hill | LN1 2YE LN1 2YG |
| Church Lane | LN1 2XW |
| Churchfield | LN1 2XJ |
| Cornwall Close | LN1 2UH |
| Cumberland Close | LN1 2YL |
| Cumberland Way | LN1 2UN |
| Devonshire Road | LN1 2UB |
| Dorset Place | LN1 2UF |
| Farriers Courtyard | LN1 2FB |
| Farrows Row | LN1 2XX |
| Fieldside | LN1 2XH |
| Fourth Avenue | LN1 2UP |
| Furze Hill | LN1 2DP |
| Gibson Drive | LN1 2FX |
| Glebe Close | LN1 2FN |
| Grange Close | LN1 2UY |
| Grange Lane | LN1 2YD |
| Hampden Street | LN1 2UU |
| Hayes Gardens | LN1 2XL |
| Hayes Yard | LN1 2XS |
| Heath Lane | LN1 2TY |
| High Street | LN1 2SD LN1 2SE LN1 2SS LN1 2YW |
| Jubilee Terrace | LN1 2XN |
| Lancaster Drive | LN1 2TF LN1 2TG |
| Lincoln Drive | LN1 2TB |
| Lincoln Road | LN1 2XF LN1 2ZA |
| Long Lane | LN1 2YB |
| Manor Farm Court | LN1 2EF |
| Norfolk Crescent | LN1 2UD |
| Northumberland Avenue | LN1 2UQ |
| Northumberland Close | LN1 2YJ |
| Pollyplatt Lane | LN1 2TL LN1 2TR |
| Rutland Way | LN1 2UJ |
| Saxon Way | LN1 2FP |
| School Lane | LN1 2TP |
| Second Avenue | LN1 2UX |
| Short Lane | LN1 2YA |
| Shropshire Road | LN1 2UE |
| Sidney Chase | LN1 2YY |
| St Johns Close | LN1 2SU |
| Stow Lane | LN1 2YP |
| Suffolk Road | LN1 2UG |
| Sussex Gardens | LN1 2UL |
| Sycamore Court | LN1 2YR |
| The Avenue | LN1 2XQ |
| The Cliff | LN1 2YQ LN1 2WE LN1 2YH |
| The Green | LN1 2XT |
| Third Avenue | LN1 2UT |
| Tillbridge Lane | LN1 2DS LN1 2SX |
| Trenchard Square | LN1 2TA |
| Vicarage Close | LN1 2XP |
| Vulcan Drive | LN1 2TD |
| Walnut Court | LN1 2XA |
| Wellington Street | LN1 2TH |
| Wessex Way | LN1 2GB LN1 2YT |
| West End | LN1 2XY |
| West End Caravan Park | LN1 2FH |
| West End Place | LN1 2XZ |
| Westmoreland Avenue | LN1 2UW |
| Whitley Street | LN1 2UR |
| Winstone Cottages | LN1 2SG |
| LN1 2DR LN1 2SH LN1 2SQ LN1 2YN LN1 2SF LN1 2SL LN1 2SN LN1 2ST |
Transport near Scampton
- FAQ
- Price Paid By Year
- Property Type Price
Frequently asked questions about Scampton
What is the average price for a property for sale in Scampton?
The average price for a property for sale in Scampton is £212,355. This amount is 11% lower than the average price in Lincoln. There are 265 property listings for sale in Scampton.
What streets have the most expensive properties for sale in Scampton?
The streets with the most expensive properties for sale in Scampton are Grange Close at an average of £738,000, Farrows Row at an average of £345,000 and High Street at an average of £344,250.
What streets have the most affordable properties for sale in Scampton?
The streets with the most affordable properties for sale in Scampton are Walnut Court at an average of £120,833, Second Avenue at an average of £140,000 and Jubilee Terrace at an average of £142,500.
Which train stations are available in or near Scampton?
Some of the train stations available in or near Scampton are Saxilby, Lincoln Central and Hykeham.
Property Price Paid in Scampton by Year
The average sold property price by year was:
| Year | Average Sold Price | Price Change |
Sold Properties
|
|---|---|---|---|
| 2025 | £217,741 | 17% |
31 Properties |
| 2024 | £181,428 | -67% |
84 Properties |
| 2023 | £302,388 | 7% |
27 Properties |
| 2022 | £280,917 | 11% |
47 Properties |
| 2021 | £248,782 | 18% |
83 Properties |
| 2020 | £204,090 | 2% |
45 Properties |
| 2019 | £199,793 | -16% |
46 Properties |
| 2018 | £230,992 | 12% |
50 Properties |
| 2017 | £202,745 | 2% |
54 Properties |
| 2016 | £199,341 | 3% |
37 Properties |
| 2015 | £193,160 | 10% |
53 Properties |
| 2014 | £174,765 | 17% |
42 Properties |
| 2013 | £144,877 | -20% |
33 Properties |
| 2012 | £174,160 | 5% |
25 Properties |
| 2011 | £165,627 | 10% |
25 Properties |
| 2010 | £148,853 | 6% |
26 Properties |
| 2009 | £139,311 | -51% |
45 Properties |
| 2008 | £210,999 | 4% |
26 Properties |
| 2007 | £203,499 | 29% |
56 Properties |
| 2006 | £143,924 | -2% |
48 Properties |
| 2005 | £146,198 | -4% |
61 Properties |
| 2004 | £152,547 | 12% |
58 Properties |
| 2003 | £133,649 | 24% |
63 Properties |
| 2002 | £101,204 | 46% |
88 Properties |
| 2001 | £54,971 | -22% |
184 Properties |
| 2000 | £66,988 | 7% |
69 Properties |
| 1999 | £62,175 | -10% |
91 Properties |
| 1998 | £68,097 | -21% |
39 Properties |
| 1997 | £82,390 | 17% |
31 Properties |
| 1996 | £68,758 | 25% |
29 Properties |
| 1995 | £51,355 | - |
19 Properties |
Property Price per Property Type in Scampton
Here you can find historic sold price data in order to help with your property search.
The average Property Paid Price for specific property types in the last three years are:
| Property Type | Average Sold Price | Sold Properties |
|---|---|---|
| Semi Detached House | £171,361.00 | 72 Semi Detached Houses |
| Detached House | £367,132.00 | 34 Detached Houses |
| Terraced House | £148,166.00 | 36 Terraced Houses |

